Review
. 2018 Sep 15:4:123-141.
doi: 10.1146/annurev-vision-091517-034055. Epub 2018 Jun 8.

Parallel Processing of Rod and Cone Signals: Retinal Function and Human Perception

Affiliations
Review

Parallel Processing of Rod and Cone Signals: Retinal Function and Human Perception

William N Grimes et al. Annu Rev Vis Sci. .

Abstract

We know a good deal about the operation of the retina when either rod or cone photoreceptors provide the dominant input (i.e., under very dim or very bright conditions). However, we know much less about how the retina operates when rods and cones are coactive (i.e., under intermediate lighting conditions, such as dusk). Such mesopic conditions span 20-30% of the light levels over which vision operates and encompass many situations in which vision is essential (e.g., driving at night). These lighting conditions are challenging because rod and cone signals differ substantially: Rod responses are nearing saturation, while cone responses are weak and noisy. A rich history of perceptual studies guides our investigation of how the retina operates under mesopic conditions and in doing so provides a powerful opportunity to link general issues about parallel processing in neural circuits with computation and perception. We review some of the successes and challenges in understanding the retinal basis of perceptual rod-cone interactions.

Keywords: circuit; cone; parallel processing; perception; retina; rod.


Figures

Figure 1:
Figure 1:
Potential sites of retinal rod-cone interactions. A. Sites in the outer retina include (1) gap junctions between rod and cones and (2) horizontal cells, which receive input from cones and provide feedback to rods and cones. B. In the inner retina, rod and cone signals are combined in the cone bipolar synaptic terminal. In the depicted On pathway, signals from the rod bipolar cell are conveyed by gap junctions to cone bipolar terminals, where they mix with cone signals originating from input to the cone bipolar cell dendrites.
Figure 2:
Figure 2:
Pathways conveying rod signals through the retina. A. Primary or rod bipolar pathway, in which rod signals are transmitted through the dedicated rod bipolar cell and AII amacrine cell. B. Secondary or rod-cone pathway, in which rod signals are conveyed to cones via gap junctions. C. Tertiary pathway, in which rods provide direct input to a subset of cone bipolar cells, such as the Off cone bipolar cell depicted here.
Figure 3:
Figure 3:
Impact of rod signals on color appearance. A. Spectral sensitivities of rods (R) and short-(S), middle- (M) and long- (L) wavelength sensitive cones. B. (left) Spectral sensitivity of hypothetical RGC receiving input in the receptive field center from L cones and in the surround from combination of L and M cones with and without rod input. Rod signals are assumed to add identically to all cone signals. (right) As in left panel, but for a RGC receiving center input from S cones.
Figure 4:
Figure 4:
Perceptual cancelation of rod and cone signals in mesopic vision (modified from Stockman and Sharpe (2006); see also MacLeod (1972)). A. The stimulus consists of a high-contrast flickering yellow spot superimposed on a large blue background. B. Detectability of the flicker in the yellow spot as a function of both spot (y-axis) and background (x-axis) intensity. Hashed regions show combinations of spot and background intensity for which flicker is invisible. C. Mean spike response in an On Parasol RGC to rod and cone flicker, presented individually and simultaneously.
Figure 5:
Figure 5:
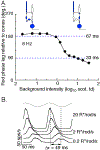
Change in kinetics of rod signals across the mesopic range. A. Perceptual delay in rod signals relative to cone signals in response to 8 Hz flicker across a range of mean light levels (modified from Sharpe and Stockman, 1999). This delay was measured as the phase advance applied to a rod stimuli required to create maximal cancelation between superimposed rod and cone stimuli. B. On parasol spike responses to an 8 Hz flickering spot (gray at top) across a range of mean light levels. 1 scotopic troland is approximately 4 R*/rod/sec.
Figure 6:
Figure 6:
Paired flash interactions are more consistent with a change in operating point than with synaptic depression. A. Schematic of how vesicle depletion (middle) and changes in operating point (right) are expected to change synaptic input-output relation. Top depicts complement of vesicles in a cone bipolar synaptic terminal, and release of vesicles in response to a depolarizing stimulus. Bottom shows relation between release and presynaptic voltage. Vesicle depletion compresses the entire input-output curve (middle) and hence changes gain. Changes in operating point do not alter the input-output curve (right) but change gain by shifting the synapse to a location with a different local slope. B. Time course of rod-cone interactions measured from rod adapting flashes (blue arrow) and cone test flashes (red arrows). Bottom shows index of suppression across a range of delays between rod and cone flashes (adapted from (Grimes et al., 2015)). The suppression index is a normalized measure of the ratio of the responses to the second of the paired flashes with and without the first flash. C. Increasing flash strength overcomes impact of rod adapting flash on response to cone test flash. Bottom shows index of suppression as a function of cone test flash strength.
Figure 7:
Figure 7:
Modeling the retinal integration and processing of rod and cone signals with a linear-nonlinear cascade model. A. Linear and nonlinear model components are derived from recordings of RGC responses to independent rod- and cone-preferring noise (0–40 Hz). B. Linear filters (top) and nonlinearities (bottom) derived from rod (blue)- and cone (red)-preferring noise stimuli. C. Model for predicting excitatory synaptic input to On parasol RGCs for arbitrary rod and cone stimuli. The final step of the model uses a common nonlinearity that reflects the average of the rod and cone derived nonlinearities. D. Model output in response to paired rod and cone flashes with a 0.2 s time offset. Gray lines are the linear sum of responses to separate rod and cone flashes, black lines are responses to the paired rod and cones flashes. E. Paired flash responses recorded from the same On parasol RGC used for noise experiments (A-D). Gray and black lines are the same as in D. Adapted from (Grimes et al., 2015).

Similar articles

Cited by

References

    1. Ala-Laurila P & Rieke F (2014) Coincidence detection of single-photon responses in the inner retina at the sensitivity limit of vision. Curr Biol, 24, 2888–2898. - PMC - PubMed
    1. Arden GB & Hogg CR (1985) Rod-cone interactions and analysis of retinal disease. Br J Ophthalmol, 69, 404–415. - PMC - PubMed
    1. Barlow HB, Levick WR & Yoon M (1971) Responses to single quanta of light in retinal ganglion cells of the cat. Vision Res, Suppl 3, 87–101. - PubMed
    1. Baylor DA, Lamb TD & Yau KW (1979) Responses of retinal rods to single photons. J Physiol, 288, 613–634. - PMC - PubMed
    1. Baylor DA, Nunn BJ & Schnapf JL (1984) The photocurrent, noise and spectral sensitivity of rods of the monkey Macaca fascicularis. J Physiol, 357, 575–607. - PMC - PubMed

Publication types

MeSH terms

LinkOut - more resources