

Food acquisition methods and correlates of food insecurity in adults on probation in Rhode Island
- PMID: 29883491
- PMCID: PMC5993252
- DOI: 10.1371/journal.pone.0198598
Food acquisition methods and correlates of food insecurity in adults on probation in Rhode Island
Abstract
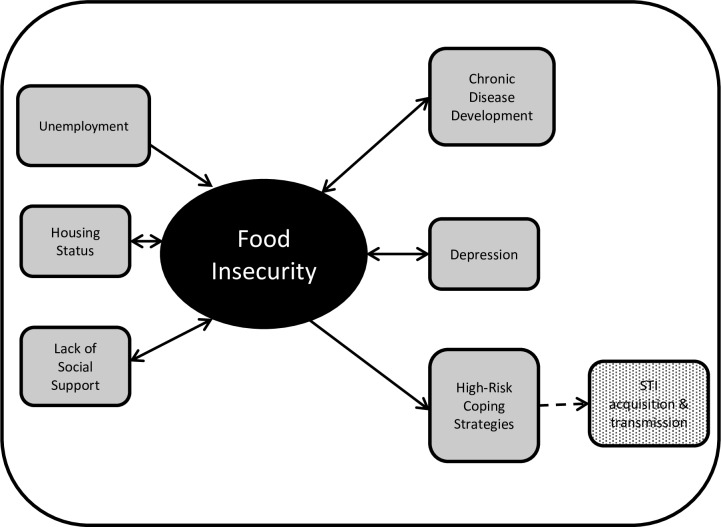
Background: Individuals under community corrections supervision may be at increased risk for food insecurity because they face challenges similar to other marginalized populations, such as people experiencing housing instability or substance users. The prevalence of food insecurity and its correlates have not been studied in the community corrections population.
Methods: We conducted a cross-sectional study in 2016, surveying 304 probationers in Rhode Island to estimate the prevalence of food insecurity, identify food acquisition methods, and determine characteristics of groups most at-risk for food insecurity. We used chi-square and Fisher's exact tests to assess differences in sociodemographics and eating and food acquisition patterns, GIS to examine geospatial differences, and ordinal logistic regression to identify independent correlates across the four levels of food security.
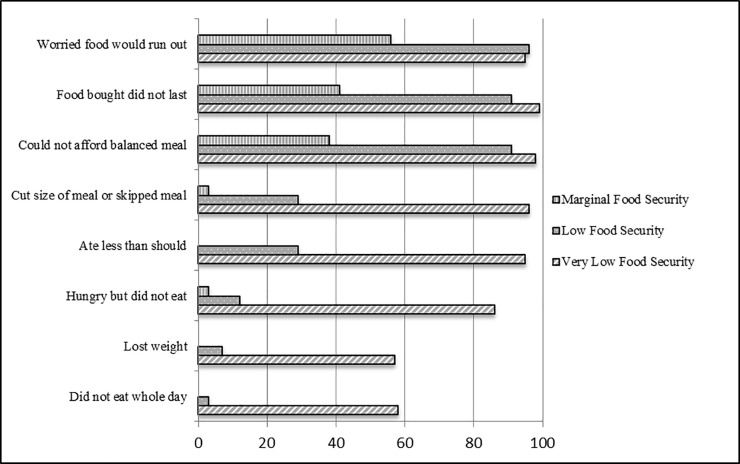
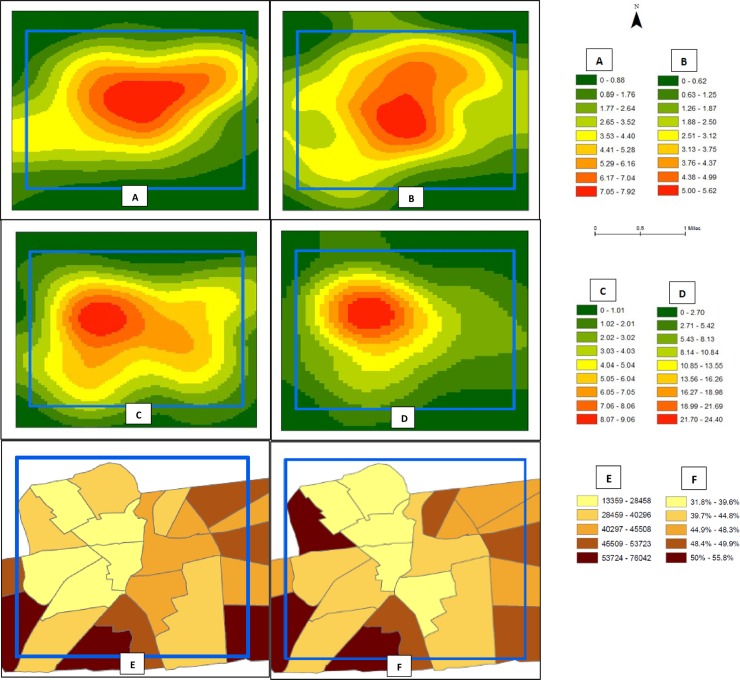
Results: Nearly three-quarters (70.4%) of the participants experienced food insecurity, with almost half (48.0%) having very low food security. This is substantially higher than the general population within the state of Rhode Island, which reported a prevalence of 12.8% food insecurity with 6.1% very low food security in 2016. Participants with very low food security most often acquired lunch foods from convenience stores (and less likely from grocery stores) compared to the other three levels of food security. Participants did not differ significantly with regards to places for food acquisition related to breakfast or dinner meals based upon food security status. In adjusted models, being homeless (AOR 2.34, 95% CI: 1.31, 4.18) and depressed (AOR 3.12, 95% CI: 1.98, 4.91) were independently associated with a greater odds of being in a food insecure group. Compared to having help with meals none of the time, participants who reported having meal help all of the time (AOR 0.28, 95% CI: 0.12, 0.64), most of the time (AOR 0.31, 95% CI: 0.15, 0.61), and some of the time (AOR 0.54, 95% CI: 0.29, 0.98) had a lower odds of being in a food insecure group. Food insecure participants resided in different neighborhoods than food secure participants. The highest density of food insecure participants resided in census tracts with the lowest median incomes for the general population. The areas of highest density for each level of food security for our participants were in the census tracts with the lowest levels of full-time employment for the general population.
Conclusions: The prevalence of food insecurity and very low food security were markedly higher in our probation population compared to the general RI population. These findings suggest that access to food on a regular basis is a challenge for adults on probation. Depression and being homeless were independently associated with a greater odds of being in a food insecure group. In addition to intervening directly on food insecurity, developing interventions and policies that address the contributing factors of food insecurity, such as safe housing and treatment for depression, are critical.
Conflict of interest statement
The authors have declared that no competing interests exist.
Figures
References
-
- Coleman-Jensen A, Rabbitt MP, Gregory CA, Singh A. Household Food Security in the United States in 2016, ERR-237. US Department of Agriculture, Economic Research Service; September 2017.
-
- Pager D. The mark of a criminal record. Americal Journal of Sociology. 2003;108:937–75.
-
- Schmitt J, Warner K. Ex-offenders and the Labor Market 2010. December 5, 2016 Available from: http://cepr.net/documents/publications/ex-offenders-2010-11.pdf.
-
- Kaeble D, Bonczar TP. Probation and Parole in the United States, 2015. US Department of Justice, Office of Justice Programs, Bureau of Justice Statistics; December 2016;NCJ 250230.
-
- Lurigio AJ, Cho YI, Swartz JA, Johnson TP, Graf I, Pickup L. Standardized assessment of substance-related, other psychiatric, and comorbid disorders among probationers. Int J Offender Ther Comp Criminol. 2003;47(6):630–52. doi: 10.1177/0306624X03257710 . - DOI - PubMed
Publication types
MeSH terms
Grants and funding
LinkOut - more resources
Full Text Sources
Other Literature Sources
Medical
