. 2018 Jun 7;70(5):894-905.e5.
doi: 10.1016/j.molcel.2018.05.008. Epub 2018 Jun 7.

Accessibility of the Shine-Dalgarno Sequence Dictates N-Terminal Codon Bias in E. coli

Affiliations

Accessibility of the Shine-Dalgarno Sequence Dictates N-Terminal Codon Bias in E. coli

Sanchari Bhattacharyya et al. Mol Cell. .

Abstract

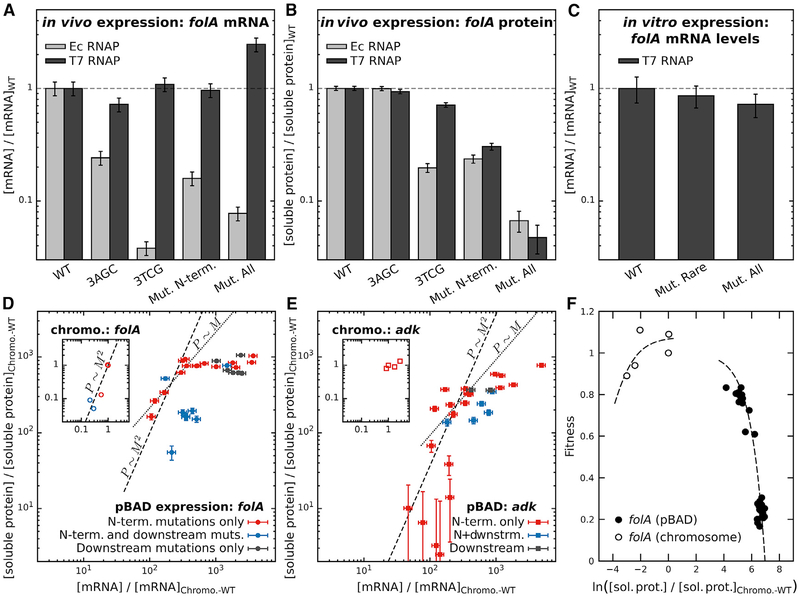
Despite considerable efforts, no physical mechanism has been shown to explain N-terminal codon bias in prokaryotic genomes. Using a systematic study of synonymous substitutions in two endogenous E. coli genes, we show that interactions between the coding region and the upstream Shine-Dalgarno (SD) sequence modulate the efficiency of translation initiation, affecting both intracellular mRNA and protein levels due to the inherent coupling of transcription and translation in E. coli. We further demonstrate that far-downstream mutations can also modulate mRNA levels by occluding the SD sequence through the formation of non-equilibrium secondary structures. By contrast, a non-endogenous RNA polymerase that decouples transcription and translation largely alleviates the effects of synonymous substitutions on mRNA levels. Finally, a complementary statistical analysis of the E. coli genome specifically implicates avoidance of intra-molecular base pairing with the SD sequence. Our results provide general physical insights into the coding-level features that optimize protein expression in prokaryotes.


Conflict of interest statement

DECLARATION OF INTERESTS

The authors declare no competing interests.

Figures

Figure 1.
Figure 1.. Synonymous Substitutions in the Chromosomal Copy of E. coli folA Affect Cellular Fitness, Soluble Protein Abundance, and mRNA Levels
(A) The locations of optimized codons within each folA construct are indicated by colored squares. (B) Replacing WT codons by their most frequently used synonymous variant on the chromosomal copy of folA gene has a deleterious effect on E. coli growth, reducing the exponential growth rate and increasing the lag time. (C) Synonymous substitutions affect both the soluble dihyrofolate reductase (DHFR) abundance and steady-state mRNA transcript levels. All values are normalized to chromosomal WT levels. Error bars indicate estimated SD of the measurements (see STAR Methods). Also see Figures S6 and S7.
Figure 2.
Figure 2.. The First Rare Codon Has the Largest Effect on Intracellular mRNA Levels
(A and B) Using an arabinose-inducible pBAD promoter, intracellular mRNA levels at an arabinose concentration of 0.05% were measured using qPCR and compared to their WT level (see Table S1). A systematic optimization of rare codons in both (A) folA and (B) adk revealed that optimizing the first rare codon in each gene has a dominant effect. At the same time, re-introduction of the first rare codon (3AGT for folA and 6CTT for adk) on the background of the MutRare construct largely rescued the mRNA levels. Error bars indicate estimated SD of the measurements (see STAR Methods). Also see Figures S6 and S7.
Figure 3.
Figure 3.. The Pivotal Role of the First Rare Codon Is Not due to Rarity
(A) All serine codons were incorporated at position 3 of folA. Other than the WT codon (AGT), only TCA was tolerated. (B) Similarly, all leucine codons were incorporated at position 6 of adk. CTA and CTC were found to increase the mRNA levels relative to the WT. In both (A) and (B), blue bars indicate common (optimized) codons whereas red indicates rare codons. Changes in the GC content, Δ(GC), due to these replacements at position 3 of folA and position 6 of adk are shown below the construct labels in(A) and (B). These constructs demonstrate that neither codon rarity nor GC content is responsible for the observed effects. (C and D) Substitutions at neighboring positions rescue the effects of optimizing position 3 of folA (C) or position 6 of adk (D), indicating that the role of the codons at these positions is context dependent. Error bars indicate estimated SD of the measurements (see STAR Methods). Also see Figures S6 and S7.
Figure 4.
Figure 4.. ΔGunfold Captures the Effects of Synonymous Substitutions in the N-Terminal Region as well as the Effect of the 5′ UTR
(A) A schematic representation of local contacts involving only the first L bases and non-local interactions. The 5′ UTR, the N-terminal, and downstream regions of the sequence are also defined. (B and C) The log ratio mRNA levels correlate well with ΔΔGunfold, with L corresponding to the sixth codon, for sequences that (B) contain N-terminal mutations only or (C) contain mutations both in the N-terminal and downstream regions. (D) This correlation is poor for constructs that only contain downstream mutations. (B–D) The constructs (see Table S1) are color coded as follows: synonymous replacements of the first rare codon (red); synonymous mutations adjacent to the first rare codon, keeping the latter optimized (orange); systematic mutations of other rare codons (blue); control sequences and other sequences designed to vary ΔGunfold (gray); and constructs that incorporate a synonymous anti-SD sequence (green). (E) Relative intracellular mRNA levels for select synonymous mutations engineered on the chromosomal copy of folA and adk genes in the MG1655 strain (filled symbols) are compared with those on the pBAD plasmid (empty symbols). Identical mutations on the two different backgrounds are connected by arrows, showing that the effects of synonymous substitutions are dependent on the 5′ UTR sequence. (B–E) Circles represent folA constructs whereas squares represent adk constructs. Error bars indicate estimated SD of the measurements (see STAR Methods). Also see Figure S1.
Figure 5.
Figure 5.. Synonymous Substitutions Result in Occlusion of the SD Sequence
(A) The statistical significance of the correlation between the log ratio mRNA levels and the log ratio of punbound, calculated using transcripts truncated after codon 20, is maximal for the base at position ‒ 10, which is located within the SD sequence. These calculations were performed using the subset of constructs with substitutions only in the 20-codon N-terminal region, and the p values are determined from a bootstrap analysis of these data (see STAR Methods). (B) By contrast, constructs with substitutions elsewhere in the coding region (small points shown by the arrow) have no dependence on punbound. The constructs are color coded as in Figures 4B–4D. (C) Synonymous sequences that incorporate designed anti-SD sequences at different positions in the coding region (red bars) show a substantial drop (40%–60%) in mRNA levels on the pBAD system, whereas control sequences with synonymous mutations that do not contain anti-SD sequences (gray bars) do not exhibit decreases in mRNA levels. Blue bars indicate sequences that were part of our codon optimized mutant collection (Table S1) and contain synonymous substitutions far downstream in the coding region; folA (158CGC + 159CGC) is partially complementary to the SD sequence. (D) A schematic representation of the designed anti-SD sequences. For each sequence, two subsequences are shown by colored boxes: a target sequence near the 5′ end and an exactly complementary downstream mutant sequence. The mutant bases in the downstream subsequence are shown in lowercase. The 5′ UTR and part of the N terminus are enlarged in the left panel for clarity, and the color codes are the same as in (C). In the case of the anti-SD constructs, the target sequence overlaps with or is immediately adjacent to the SD sequence, whereas for the control sequences, the target sequence is far from the SD region. This indicates that anti-SD sequences decrease the mRNA abundances irrespective of their positions within the coding region. Error bars indicate estimated SD of the measurements (see STAR Methods). Also see Figure S2.
Figure 6.
Figure 6.. A Mechanism of Co-translational mRNA Transcription Explains Sequence-Specific Variations in mRNA Levels, Protein Abundance, and Cellular Fitness
(A and B) Comparison of (A) relative mRNA and (B) relative soluble protein levels for selected folA mutants when expressed under the bacteriophage T7 promoter and under the pBAD promoter. The constructs 3TCG, MutN-term, and 3AGC, which all showed substantial drops in mRNA levels in the pBAD system, have mRNA levels equal to the WT sequence in the T7 system, whereas MutAll results in a large increase in mRNA but produces very little protein. The trends in protein levels are similar across both the systems. (C) In vitro transcription by T7 RNAP (see STAR Methods) shows that WT, MutAll, and MutRare variants of folA gene are transcribed similarly. (D and E) Soluble protein abundances (overexpression in the pBAD system relative to the chromosomal levels; see Table S1) are shown as a function of their mRNA abundances for (D) folA and (E) adk; note that this normalization hides the fact that adk is endogenously expressed at much higher levels than folA. For illustration, the dotted and dashed lines depict linear and quadratic relationships, respectively, between the protein, P, and mRNA abundances, M, at low to moderate expression levels on the log-log plots. The soluble protein abundances then appear to plateau relative to the intracellular mRNA abundances at the highest expression levels. The insets show equivalent plots for synonymous variants expressed on the chromosome. (F) Variations in soluble protein abundances arising from synonymous substitutions in folA predict cellular fitness (i.e., for chromosomal incorporations, the exponential phase growth rate was normalized by the WT growth rate, whereas for the pBAD constructs, normalization was done using growth rate at zero arabinose concentration). The under-expression arm exhibits Michaelis-Menten-like behavior, whereas the overexpression arm has a linear dependence on the soluble protein abundance. For (A), (B), (D), and (E), error bars indicate estimated SD of the measurements (see STAR Methods). For (C), the error bars indicate the SEM of three replicates. Also see Figures S3 and S4.
Figure 7.
Figure 7.. A Statistical Analysis of E. coli N-Terminal Codon Bias Provides Evidence for Selection against SD Mis-interactions
(A) A comparison of the genome-wide distributions of ΔGunfold for the wild-type (WT) and alternative synonymous sequences, assuming that all synonymous codons are used with equal frequencies. The first 15 bases of the coding region are mutated, and we have used L corresponding to the fifth codon in these calculations. (B) p values (see text) assess the statistical significance of the difference between the WT and control distributions, assuming that synonymous codons are selected either uniformly or according to the empirical genome-wide usage within the first five codons. (C) The average difference in the equilibrium base pairing probability, punbound, between the WT sequence and the mean of the uniformly weighted synonymous sequences for each gene. The most significant decrease in local secondary structure formation outside of the directly mutated bases (shaded region) coincides with the most probable location of the SD sequence (red curve); see also Figure S5. Error bars indicate the SEM (see STAR Methods). Also see Figure S5.

Similar articles

Cited by

References

    1. Adhya S, and Gottesman M (1978). Control of transcription termination. Annu. Rev. Biochem 47, 967–996. - PubMed
    1. Adkar BV, Manhart M, Bhattacharyya S, Tian J, Musharbash M, and Shakhnovich EI (2017). Optimization of lag phase shapes the evolution of a bacterial enzyme. Nat. Ecol. Evol 1, 149. - PMC - PubMed
    1. Bakshi S, Siryaporn A, Goulian M, and Weisshaar JC (2012). Superresolution imaging of ribosomes and RNA polymerase in live Escherichia coli cells. Mol. Microbiol 85, 21–38. - PMC - PubMed
    1. Bentele K, Saffert P, Rauscher R, Ignatova Z, and Blüthgen N (2013). Efficient translation initiation dictates codon usage at gene start. Mol. Syst. Biol 9, 675. - PMC - PubMed
    1. Bershtein S, Mu W, and Shakhnovich EI (2012). Soluble oligomerization provides a beneficial fitness effect on destabilizing mutations. Proc. Natl. Acad. Sci. USA 109, 4857–4862. - PMC - PubMed

Publication types

MeSH terms