. 2018 Jun 8;6(1):102.
doi: 10.1186/s40168-018-0488-2.

Insights into the ecology, evolution, and metabolism of the widespread Woesearchaeotal lineages

Affiliations

Insights into the ecology, evolution, and metabolism of the widespread Woesearchaeotal lineages

Xiaobo Liu et al. Microbiome. .

Abstract

Background: As a recently discovered member of the DPANN superphylum, Woesearchaeota account for a wide diversity of 16S rRNA gene sequences, but their ecology, evolution, and metabolism remain largely unknown.

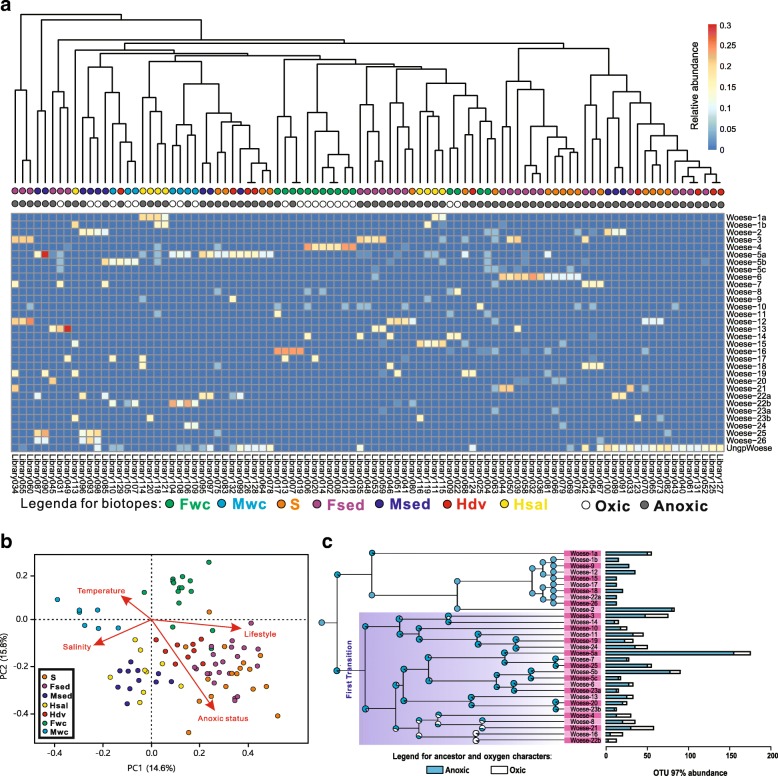
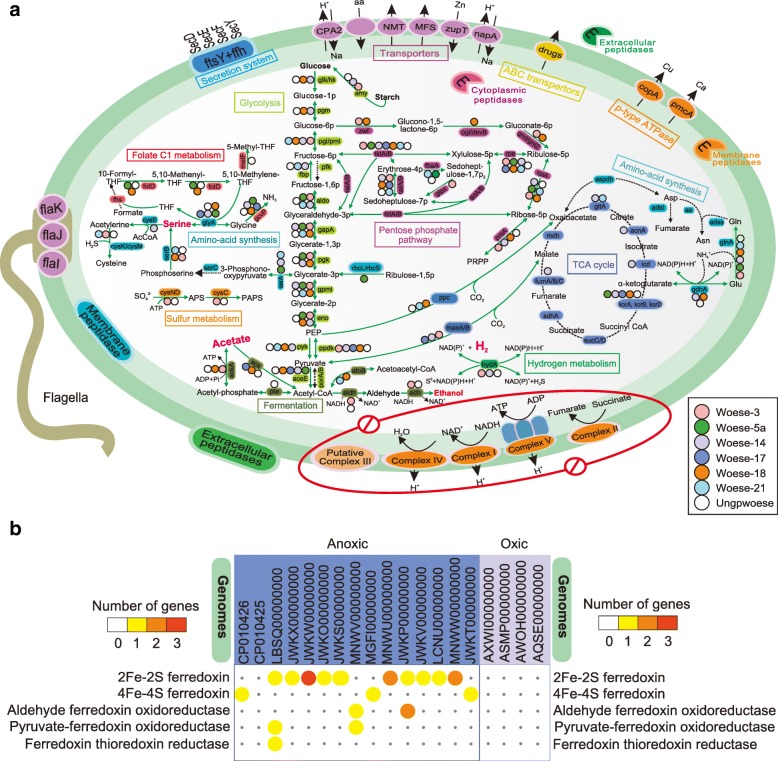
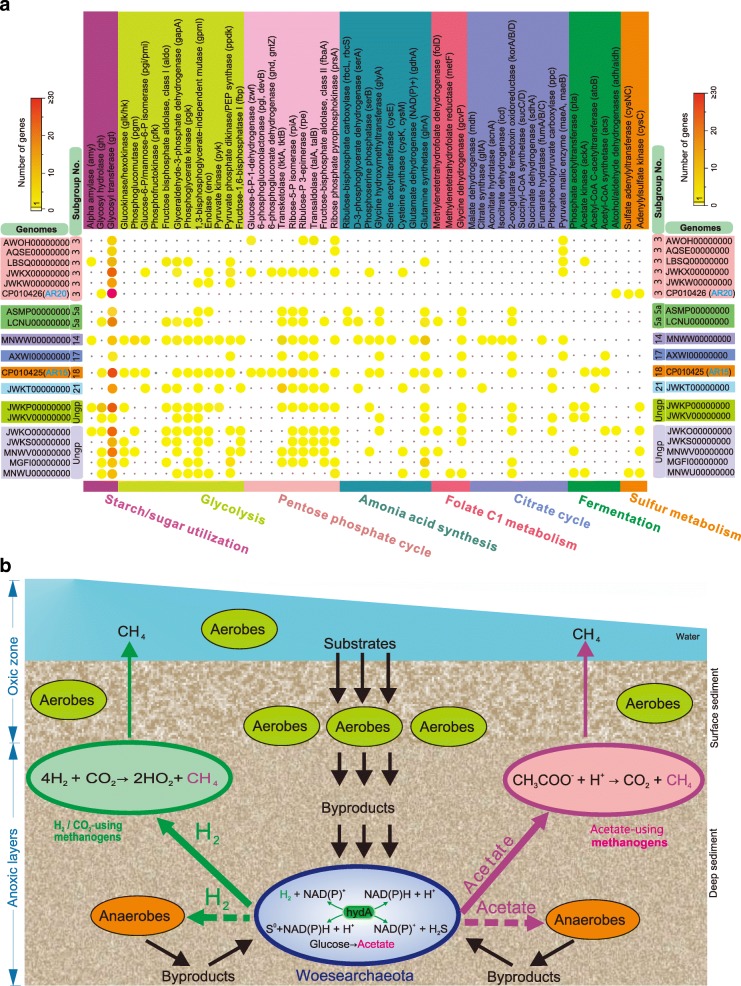
Results: Here, we assembled 133 global clone libraries/studies and 19 publicly available genomes to profile these patterns for Woesearchaeota. Phylogenetic analysis shows a high diversity with 26 proposed subgroups for this recently discovered archaeal phylum, which are widely distributed in different biotopes but primarily in inland anoxic environments. Ecological patterns analysis and ancestor state reconstruction for specific subgroups reveal that oxic status of the environments is the key factor driving the distribution and evolutionary diversity of Woesearchaeota. A selective distribution to different biotopes and an adaptive colonization from anoxic to oxic environments can be proposed and supported by evidence of the presence of ferredoxin-dependent pathways in the genomes only from anoxic biotopes but not from oxic biotopes. Metabolic reconstructions support an anaerobic heterotrophic lifestyle with conspicuous metabolic deficiencies, suggesting the requirement for metabolic complementarity with other microbes. Both lineage abundance distribution and co-occurrence network analyses across diverse biotopes confirmed metabolic complementation and revealed a potential syntrophic relationship between Woesearchaeota and methanogens, which is supported by metabolic modeling. If correct, Woesearchaeota may impact methanogenesis in inland ecosystems.

Conclusions: The findings provide an ecological and evolutionary framework for Woesearchaeota at a global scale and indicate their potential ecological roles, especially in methanogenesis.

Keywords: Ecology; Evolution; Metabolism; Methanogen; Subgroup; Woesearchaeota.


Conflict of interest statement

Ethics approval and consent to participate

Not applicable.

Competing interests

The authors declare that they have no competing interests.

Publisher’s Note

Springer Nature remains neutral with regard to jurisdictional claims in published maps and institutional affiliations.

Figures

Fig. 1
Fig. 1
Global distribution and biodiversity patterns of Woesearchaeota in seven types of biotopes from 133 libraries/studies. a Global occurrence and abundance of Woesearchaeota. The abundance of 16S rRNA gene sequences of Woesearchaeota is relative to total archaea sequences in the clone libraries/studies. Each node represents one clone library/study. Node color indicates the type of biotopes, and node size represents the relative abundance in the corresponding clone libraries/studies. b Principal coordinate analysis (PCoA) obtained with the UniFrac distance matrix comparing the 133 libraries/studies summarized in Additional file 1: Table S1. c Samples clustered by the seven types of biotopes. Distances between clusters are shown in UniFrac units: a distance of 0 indicates that two environments are identical while a distance of 1 indicates that two environments contain mutually exclusive lineages. Abbreviation: n, number of sequence; Nlib, number of libraries; PD ± SD, phylogenetic diversity (PD) with standard deviation (SD); PSV, phylogenetic species variability; Fwc, freshwater; Fsed, freshwater sediment; S, soil; Msed, marine sediment; Mwc, marine water column; Hsal, hypersaline environment; and Hdv, hydrothermal vent
Fig. 2
Fig. 2
Phylogeny of 26 proposed subgroups of Woesearchaeota. a Maximum likelihood phylogenetic tree of Woesearchaeota based on 663 representative 16S rRNA gene sequences (> 800 bp) dereplicated at a 97% cutoff. Subgroups from Woese-1 to Woese-26 are colored within the corresponding leaves in the tree. Uncolored leaves identify sequences not assigned to any subgroup (that is, ungrouped). Outer colored circles indicate sequence origin, as follows: circle I: anoxic (dark gray), oxic (light gray); and circle II: non-saline (ice blue), saline (sky blue), hypersaline (red). Tree was drawn using the web-based interactive tree of life. The full SSU rRNA gene tree is available in result format as Additional file 2: Dataset S1. b Coverage and similarity of each subgroup for the total of 3584 sequences (> 600 bp) of Woesearchaeota (Additional file 4: Dataset S3). The minimum intra-group similarity (%) is listed on the top of bar for the corresponding subgroup
Fig. 3
Fig. 3
Effects of environmental factors on the distribution and evolutionary diversity of Woesearchaeotal lineages. a Heatmap plotting the abundance and distribution of each subgroup across 95 libraries/studies with more than 10 representative sequences of Woesearchaeota. The abundance of Woesearchaeota is relative to the total archaea sequences in the corresponding library/study. Biotope type and oxic status are expressed by colored nodes which are shown under each leaf of the cluster. b Principle component analysis (PCA) based on Bray-Curtis distances comparing the influences of four environmental parameters. Correlations between environmental parameters and PCA axes are represented by the length and angle of arrows. c Ancestral state reconstruction (ASR) of oxic status for Woesearchaeota. Pie charts on the nodes show the relative likelihoods of the two states: oxic (white) and anoxic (blue). Bar charts on the right indicate the current oxic state for Woesearchaeotal OTUs (at a 97% cutoff)
Fig. 4
Fig. 4
Reconstruction of metabolic pathway of Woesearchaeota in the central carbon (a) and comparison of genes relating to the ferredoxin-dependent pathways between organisms from oxic and anoxic biotopes (b). Metabolic predictions are mainly generated by referring to the interface KEGG and GenBank NCBI-nr database. Each subgroup of Woesearchaeota is depicted as a colored circle (see figure legend). Functional genes (abbreviation by referring to KEGG) encoding the relevant proteins/enzymes are labeled for each metabolic step where colored circles (that is, Woesearchaeotal subgroups) are depicted to show the potential functions of each subgroup if any. Solid arrows indicate the corresponding genes are detected for the pathways while dotted arrows indicate the corresponding genes miss from the pathways. Red “no entry” signs indicate the whole pathways missing. The crucial intermediates for methanogenesis are colored in green. All putative transporters and A-type ATPases are shown as well as secretory pathways (components of the Sec pathway) and predicted components of flagella (Additional file 1: Figure S4). Key metabolic predictions are supported by the gene information in Additional file 5: Dataset S4 and Fig. 5a. Abbreviations: THF, tetrahydrofuran; APS, adenosine 5′-phosphosulfate; PAPS, 3′-Phosphoadenosine-5′-phosphosulfate
Fig. 5
Fig. 5
Overview of key metabolic predictions of Woesearchaeota and potential syntrophic metabolism model. a Comparative metabolic analyses of the 19 Woesearchaeotal genome bins generated by BLASTing against GenBank NCBI-nr database. Genes identified belong to the central carbon metabolism, nitrogen cycle, and sulfur cycle. Numbers of genes per genome matching the annotation are represented by colors in circles. b Syntrophic metabolic model for methanogenesis by a consortium of H2/CO2-using and acetate-using methanogens, Woesearchaeota, anaerobes, and/or aerobes. The habitat is supposed as freshwater sediments
Fig. 6
Fig. 6
Lineage abundance distribution (LAD) and co-occurrence patterns of Woesearchaeota with other archaea across the 133 libraries/studies. a Occurrence of archaeal lineages (number of studies where a given lineage was found) plotted against its mean abundance across these studies. Core lineages (in green) were defined as those appearing in more than 90 libraries while satellite lineages (in blue) appearing in less than 50 libraries. Solid circles indicate lineages from anoxic biotopes while hollow circles indicate lineages from oxic biotopes. b Occurrence of each archaeal lineage plotted against its dispersion index. The dash line depicts the 2.5% confidence limit of the χ2 distribution suggesting that lineages falling below this line follow a Poisson distribution and are therefore randomly dispersed in space. c Co-occurrence network based on correlation analysis. Each node denotes an archaeal OTU at 90% cutoff. Node size indicates the closeness centrality (that is, the mean shortest path of this node to any other node), and node color represents taxonomy (see abbreviations below). Edge lines between nodes denote significant co-occurrence relationships. Edge size shows the strength of Spearman correlation among nodes. d Same network as c, but nodes are colored according to core lineages (see figure legends). e Same network as c, but nodes are colored by modules. f Sub-network modules clustering all OTUs belonging to the same lineage colored by modularity. Edge size indicates the number of connections (degree). Abbreviation of taxonomy: Woese, Woesearchaeota; Metmic, Methanomicrobia; Metbac, Methanobacteria; Bathy-6/10/16, Bathyarchaeota subgroup-6/10/16; Thermpl, Thermoplasmata; SCG, Soil Crenarchaeotic Group; SAGMCG, South African Gold Mine Group 1; MG-I, Marine Group I; Halobacteria, Halo; Terrestrial group, Tergp; others (Additional file 1: Table S5)

References

    1. Lipp JS, Morono Y, Inagaki F, Hinrichs K-U. Significant contribution of Archaea to extant biomass in marine subsurface sediments. Nature. 2008;454:991–994. doi: 10.1038/nature07174. - DOI - PubMed
    1. Offre P, Spang A, Schleper C. Archaea in biogeochemical cycles. Annu Rev Microbiol. 2013;67:437–457. doi: 10.1146/annurev-micro-092412-155614. - DOI - PubMed
    1. Falkowski PG, Fenchel T, Delong EF. The microbial engines that drive Earth’s biogeochemical cycles. Science. 2008;320:1034–1039. doi: 10.1126/science.1153213. - DOI - PubMed
    1. Madsen EL. Microorganisms and their roles in fundamental biogeochemical cycles. Curr Opin Biotechnol. 2011;22:456–464. doi: 10.1016/j.copbio.2011.01.008. - DOI - PubMed
    1. Garcia J-L, Patel BK, Ollivier B. Taxonomic, phylogenetic, and ecological diversity of methanogenic Archaea. Anaerobe. 2000;6:205–226. doi: 10.1006/anae.2000.0345. - DOI - PubMed

Publication types

Substances