

Identifying Objective Physiological Markers and Modifiable Behaviors for Self-Reported Stress and Mental Health Status Using Wearable Sensors and Mobile Phones: Observational Study
- PMID: 29884610
- PMCID: PMC6015266
- DOI: 10.2196/jmir.9410
Identifying Objective Physiological Markers and Modifiable Behaviors for Self-Reported Stress and Mental Health Status Using Wearable Sensors and Mobile Phones: Observational Study
Abstract
Background: Wearable and mobile devices that capture multimodal data have the potential to identify risk factors for high stress and poor mental health and to provide information to improve health and well-being.
Objective: We developed new tools that provide objective physiological and behavioral measures using wearable sensors and mobile phones, together with methods that improve their data integrity. The aim of this study was to examine, using machine learning, how accurately these measures could identify conditions of self-reported high stress and poor mental health and which of the underlying modalities and measures were most accurate in identifying those conditions.
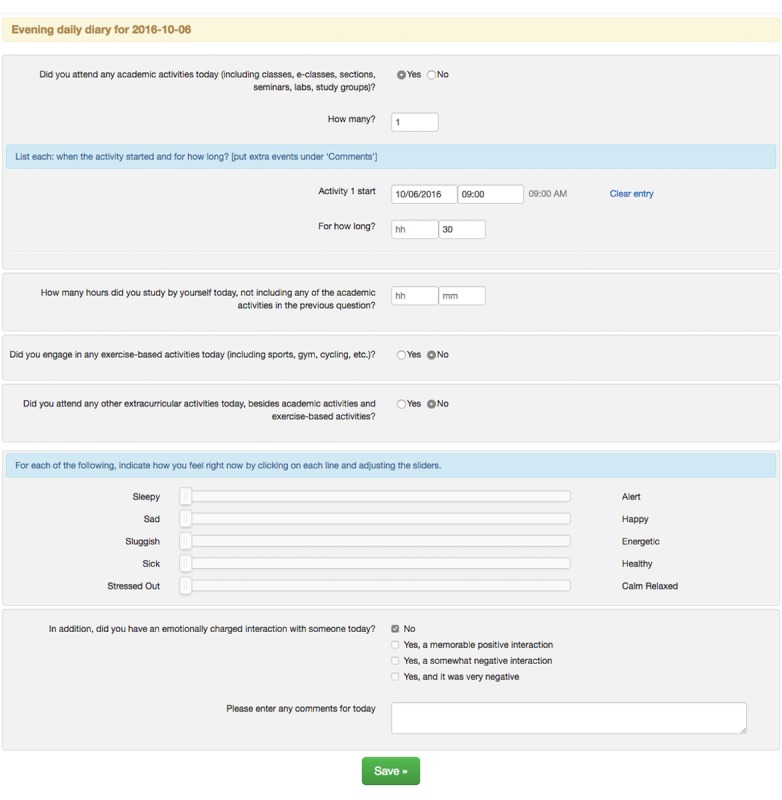
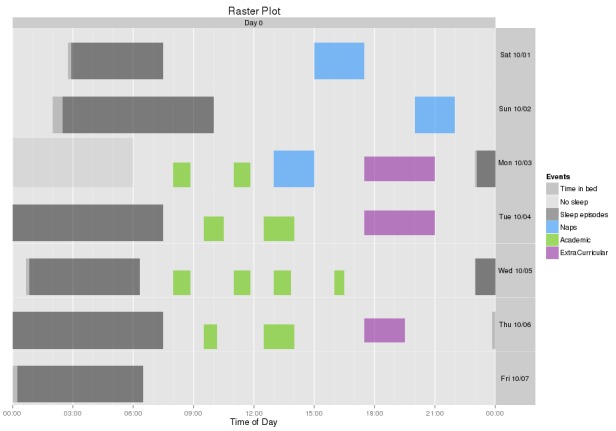
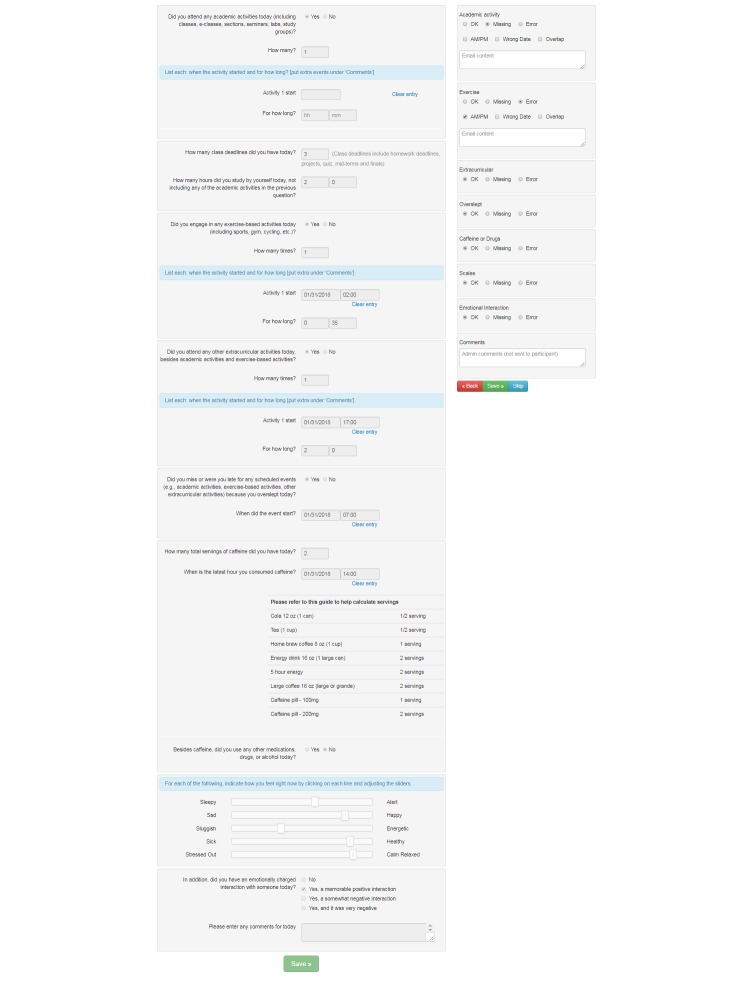
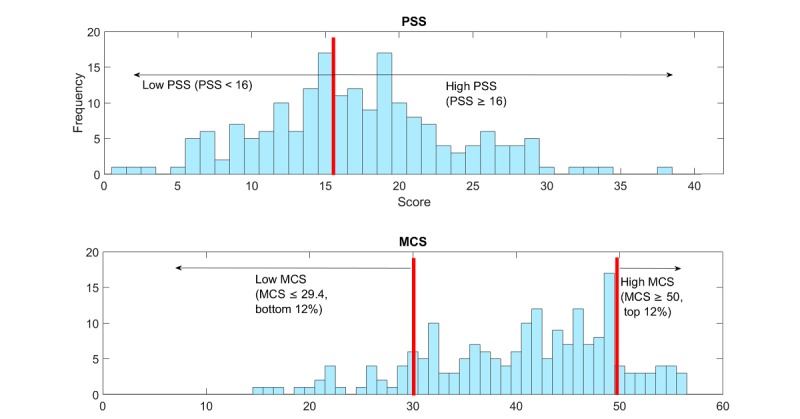
Methods: We designed and conducted the 1-month SNAPSHOT study that investigated how daily behaviors and social networks influence self-reported stress, mood, and other health or well-being-related factors. We collected over 145,000 hours of data from 201 college students (age: 18-25 years, male:female=1.8:1) at one university, all recruited within self-identified social groups. Each student filled out standardized pre- and postquestionnaires on stress and mental health; during the month, each student completed twice-daily electronic diaries (e-diaries), wore two wrist-based sensors that recorded continuous physical activity and autonomic physiology, and installed an app on their mobile phone that recorded phone usage and geolocation patterns. We developed tools to make data collection more efficient, including data-check systems for sensor and mobile phone data and an e-diary administrative module for study investigators to locate possible errors in the e-diaries and communicate with participants to correct their entries promptly, which reduced the time taken to clean e-diary data by 69%. We constructed features and applied machine learning to the multimodal data to identify factors associated with self-reported poststudy stress and mental health, including behaviors that can be possibly modified by the individual to improve these measures.
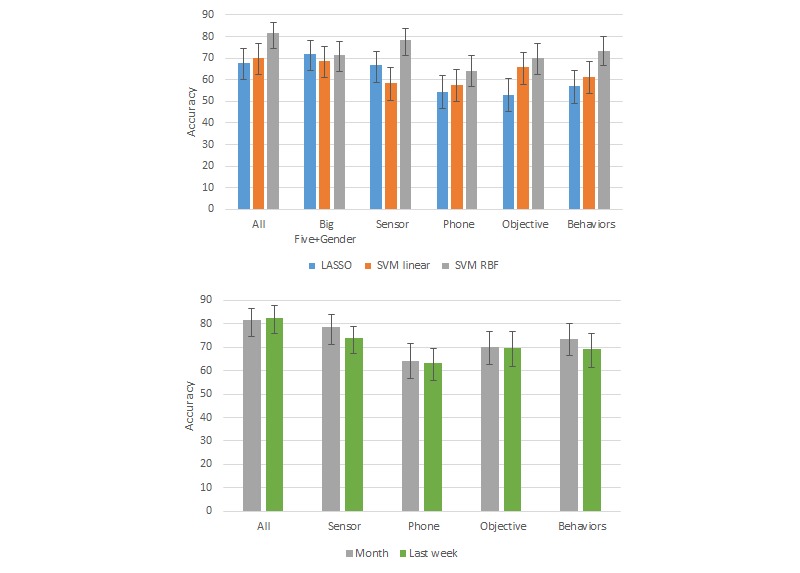
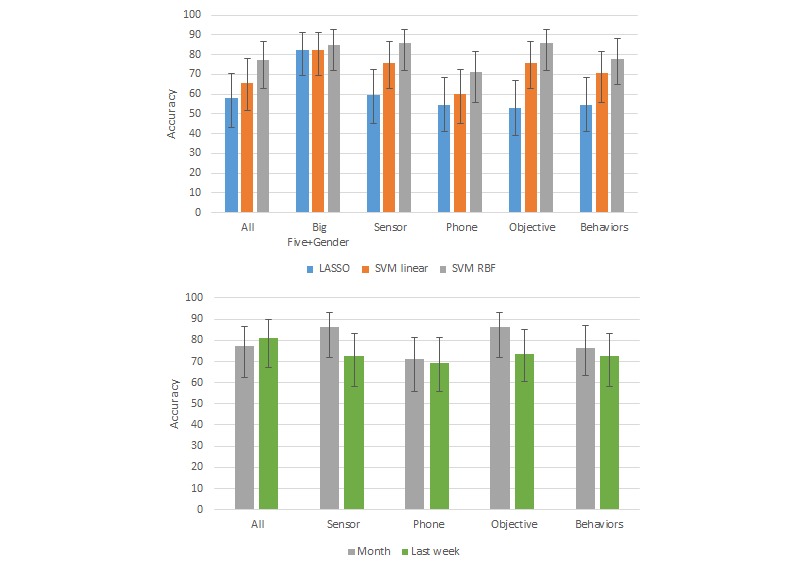
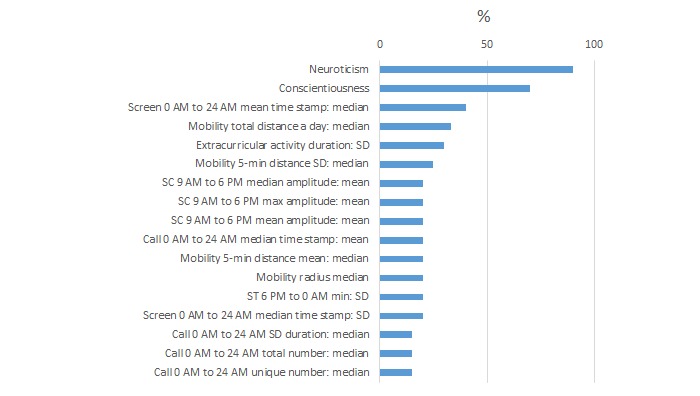
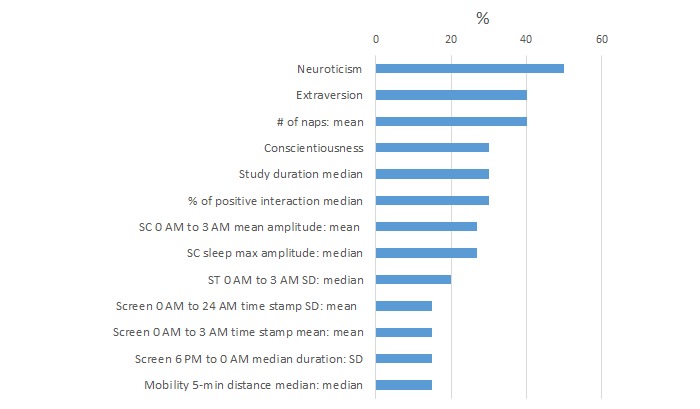
Results: We identified the physiological sensor, phone, mobility, and modifiable behavior features that were best predictors for stress and mental health classification. In general, wearable sensor features showed better classification performance than mobile phone or modifiable behavior features. Wearable sensor features, including skin conductance and temperature, reached 78.3% (148/189) accuracy for classifying students into high or low stress groups and 87% (41/47) accuracy for classifying high or low mental health groups. Modifiable behavior features, including number of naps, studying duration, calls, mobility patterns, and phone-screen-on time, reached 73.5% (139/189) accuracy for stress classification and 79% (37/47) accuracy for mental health classification.
Conclusions: New semiautomated tools improved the efficiency of long-term ambulatory data collection from wearable and mobile devices. Applying machine learning to the resulting data revealed a set of both objective features and modifiable behavioral features that could classify self-reported high or low stress and mental health groups in a college student population better than previous studies and showed new insights into digital phenotyping.
Keywords: machine learning; mental health; mobile health; mobile phone; mood; psychological stress; smartphone; wearable electronic devices.
©Akane Sano, Sara Taylor, Andrew W McHill, Andrew JK Phillips, Laura K Barger, Elizabeth Klerman, Rosalind Picard. Originally published in the Journal of Medical Internet Research (http://www.jmir.org), 08.06.2018.
Conflict of interest statement
Conflicts of Interest: RP is a cofounder of and shareholder in Affectiva, who commercialized the original sensors used in this study. RP is also a cofounder and shareholder in Empatica, a company that makes wearable sensors that can collect ambulatory data similar to the data collected in this study. EK has consulted for legal firms and for Pfizer Pharmaceuticals.
Figures

Similar articles
-
Ambulatory Smoking Habits Investigation based on Physiology and Context (ASSIST) using wearable sensors and mobile phones: protocol for an observational study.BMJ Open. 2019 Sep 5;9(9):e028284. doi: 10.1136/bmjopen-2018-028284. BMJ Open. 2019. PMID: 31492781 Free PMC article.
-
The Google Health Digital Well-Being Study: Protocol for a Digital Device Use and Well-Being Study.JMIR Res Protoc. 2024 May 14;13:e49189. doi: 10.2196/49189. JMIR Res Protoc. 2024. PMID: 38743938 Free PMC article.
-
Recognizing Academic Performance, Sleep Quality, Stress Level, and Mental Health using Personality Traits, Wearable Sensors and Mobile Phones.Int Conf Wearable Implant Body Sens Netw. 2015 Jun;2015:10.1109/BSN.2015.7299420. doi: 10.1109/BSN.2015.7299420. Epub 2015 Oct 19. Int Conf Wearable Implant Body Sens Netw. 2015. PMID: 28516162 Free PMC article.
-
Usefulness of Wearable Cameras as a Tool to Enhance Chronic Disease Self-Management: Scoping Review.JMIR Mhealth Uhealth. 2019 Jan 3;7(1):e10371. doi: 10.2196/10371. JMIR Mhealth Uhealth. 2019. PMID: 30609985 Free PMC article.
-
Wearable sensors with possibilities for data exchange: Analyzing status and needs of different actors in mobile health monitoring systems.Int J Med Inform. 2020 Jan;133:104017. doi: 10.1016/j.ijmedinf.2019.104017. Epub 2019 Oct 31. Int J Med Inform. 2020. PMID: 31778885 Review.
Cited by
-
Putting the usability of wearable technology in forensic psychiatry to the test: a randomized crossover trial.Front Psychiatry. 2024 Jun 14;15:1330993. doi: 10.3389/fpsyt.2024.1330993. eCollection 2024. Front Psychiatry. 2024. PMID: 38947186 Free PMC article.
-
Improving Stress Management and Sleep Hygiene in Intelligent Homes.Sensors (Basel). 2021 Mar 30;21(7):2398. doi: 10.3390/s21072398. Sensors (Basel). 2021. PMID: 33808468 Free PMC article.
-
Use of In-Game Rewards to Motivate Daily Self-Report Compliance: Randomized Controlled Trial.J Med Internet Res. 2019 Jan 3;21(1):e11683. doi: 10.2196/11683. J Med Internet Res. 2019. PMID: 30609986 Free PMC article. Clinical Trial.
-
Reproducible Analysis Pipeline for Data Streams: Open-Source Software to Process Data Collected With Mobile Devices.Front Digit Health. 2021 Nov 18;3:769823. doi: 10.3389/fdgth.2021.769823. eCollection 2021. Front Digit Health. 2021. PMID: 34870271 Free PMC article.
-
Proposal of layered mental healthcare for mental well-being.Healthc Technol Lett. 2021 May 13;8(4):85-89. doi: 10.1049/htl2.12012. eCollection 2021 Aug. Healthc Technol Lett. 2021. PMID: 34295505 Free PMC article.
References
-
- Torous J, Kiang MV, Lorme J, Onnela JP. New tools for new research in psychiatry: a scalable and customizable platform to empower data driven smartphone research. JMIR Ment Health. 2016 May 5;3(2):e16. doi: 10.2196/mental.5165. http://mental.jmir.org/2016/2/e16/ v3i2e16 - DOI - PMC - PubMed
-
- Li X, Dunn J, Salins D, Zhou G, Zhou W, Schüssler-Fiorenza Rose SM, Perelman D, Colbert E, Runge R, Rego S, Sonecha R, Datta S, McLaughlin T, Snyder MP. Digital health: tracking physiomes and activity using wearable biosensors reveals useful health-related information. PLoS Biol. 2017 Jan;15(1):e2001402. doi: 10.1371/journal.pbio.2001402. http://dx.plos.org/10.1371/journal.pbio.2001402 pbio.2001402 - DOI - DOI - PMC - PubMed
-
- Wang R, Chen F, Chen Z, Li T, Harari G, Tignor S, Zhou X, Ben-Zeev D, Campbell AT. StudentLife: assessing mental health, academic performance and behavioral trends of college students using smartphones. UbiComp '14 Proceedings of the 2014 ACM International Joint Conference on Pervasive and Ubiquitous Computing; September 13-17, 2014; Seattle, Washington. 2014. - DOI
-
- Bogomolov A, Lepri B, Pianesi F. Happiness recognition from mobile phone data. International Conference on Social Computing; September 8-14, 2013; Alexandria, VA, USA. 2013. - DOI
Publication types
MeSH terms
Grants and funding
- R01 HL128538/HL/NHLBI NIH HHS/United States
- KL2 TR002370/TR/NCATS NIH HHS/United States
- K24 HL105664/HL/NHLBI NIH HHS/United States
- F32 DK107146/DK/NIDDK NIH HHS/United States
- T32 HL007901/HL/NHLBI NIH HHS/United States
- M01 RR002635/RR/NCRR NIH HHS/United States
- R01 HL114088/HL/NHLBI NIH HHS/United States
- UL1 TR001102/TR/NCATS NIH HHS/United States
- UL1 RR025758/RR/NCRR NIH HHS/United States
- R01 GM105018/GM/NIGMS NIH HHS/United States
- R00 HL119618/HL/NHLBI NIH HHS/United States
- P01 AG009975/AG/NIA NIH HHS/United States
LinkOut - more resources
Full Text Sources
Other Literature Sources
Medical
