

Subtypes of Barrett's oesophagus and oesophageal adenocarcinoma based on genome-wide methylation analysis
- PMID: 29884612
- PMCID: PMC6565505
- DOI: 10.1136/gutjnl-2017-314544
Subtypes of Barrett's oesophagus and oesophageal adenocarcinoma based on genome-wide methylation analysis
Abstract
Objective: To identify and characterise DNA methylation subtypes in oesophageal adenocarcinoma (EAC) and its precursor Barrett's oesophagus (BE).
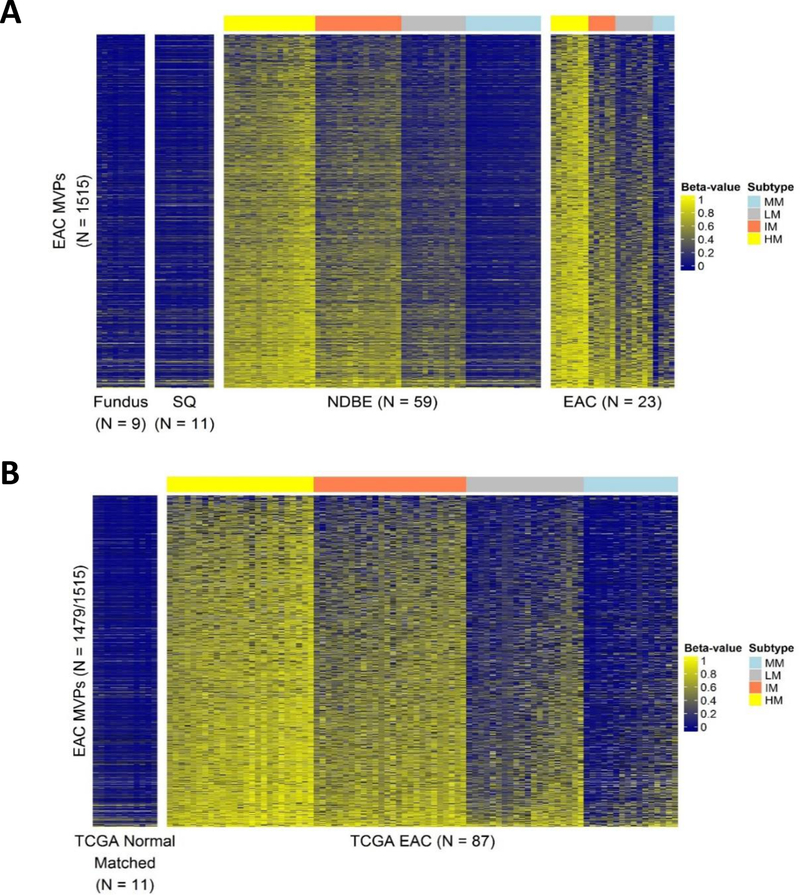
Design: We performed genome-wide DNA methylation profiling on samples of non-dysplastic BE from cancer-free patients (n=59), EAC (n=23), normal squamous oesophagus (n=33) and normal fundus (n=9), and identified methylation subtypes using a recursively partitioned mixture model. We assessed genomic alterations for 9 BE and 22 EAC samples with massively parallel sequencing of 243 EAC-associated genes, and we conducted integrative analyses with transcriptome data to identify epigenetically repressed genes. We also carried out in vitro experiments treating EAC cell lines with 5-Aza-2'-Deoxycytidine (5-Aza-dC), short hairpin RNA knockdown and anticancer therapies.
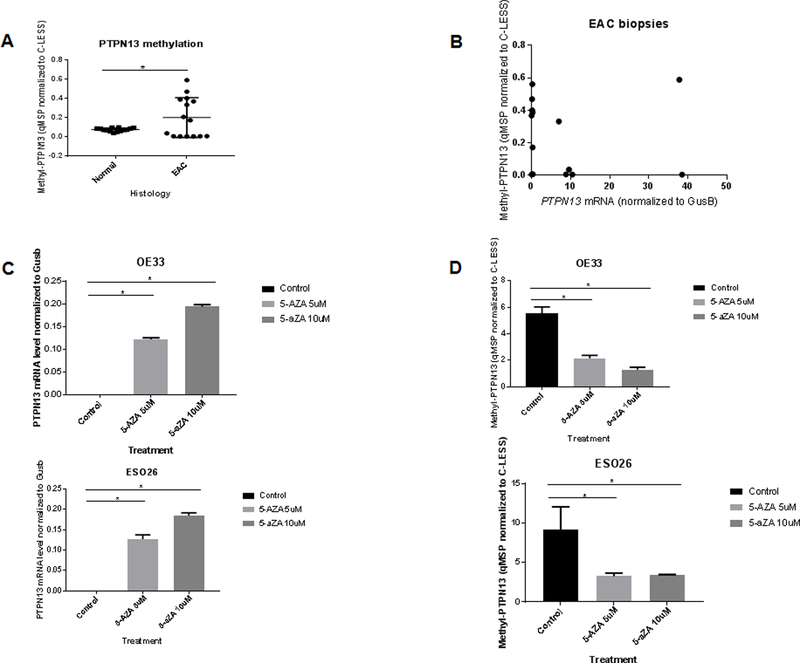
Results: We identified and validated four methylation subtypes of EAC and BE. The high methylator subtype (HM) of EAC had the greatest number of activating events in ERBB2 (p<0.05, Student's t-test) and the highest global mutation load (p<0.05, Fisher's exact test). PTPN13 was silenced by aberrant methylation in the HM subtype preferentially and in 57% of EACs overall. In EAC cell lines, 5-Aza-dC treatment restored PTPN13 expression and significantly decreased its promoter methylation in HM cell lines (p<0.05, Welch's t-test). Inhibition of PTPN13 expression in the SK-GT-4 EAC cell line promoted proliferation, colony formation and migration, and increased phosphorylation in ERBB2/EGFR/Src kinase pathways. Finally, EAC cell lines showed subtype-specific responses to topotecan, SN-38 and palbociclib treatment.
Conclusions: We identified and characterised methylator subtypes in BE and EAC. We further demonstrated the biological and clinical relevance of EAC methylator subtypes, which may ultimately help guide clinical management of patients with EAC.
Keywords: dysplasia; gastrointestinal cancer; methylation.
© Article author(s) (or their employer(s) unless otherwise stated in the text of the article) 2019. All rights reserved. No commercial use is permitted unless otherwise expressly granted.
Conflict of interest statement
Competing interests: None declared.
Figures


Similar articles
-
Identification of Subtypes of Barrett's Esophagus and Esophageal Adenocarcinoma Based on DNA Methylation Profiles and Integration of Transcriptome and Genome Data.Gastroenterology. 2020 May;158(6):1682-1697.e1. doi: 10.1053/j.gastro.2020.01.044. Epub 2020 Feb 4. Gastroenterology. 2020. PMID: 32032585 Free PMC article.
-
Hypomethylation of noncoding DNA regions and overexpression of the long noncoding RNA, AFAP1-AS1, in Barrett's esophagus and esophageal adenocarcinoma.Gastroenterology. 2013 May;144(5):956-966.e4. doi: 10.1053/j.gastro.2013.01.019. Epub 2013 Jan 16. Gastroenterology. 2013. PMID: 23333711 Free PMC article.
-
Alterations of the Wnt signaling pathway during the neoplastic progression of Barrett's esophagus.Oncogene. 2006 May 18;25(21):3084-92. doi: 10.1038/sj.onc.1209338. Oncogene. 2006. PMID: 16407829
-
Molecular Evolution of Metaplasia to Adenocarcinoma in the Esophagus.Dig Dis Sci. 2018 Aug;63(8):2059-2069. doi: 10.1007/s10620-018-5090-8. Dig Dis Sci. 2018. PMID: 29766388 Free PMC article. Review.
-
Genetic and Epigenetic Alterations in Barrett's Esophagus and Esophageal Adenocarcinoma.Gastroenterol Clin North Am. 2015 Jun;44(2):473-89. doi: 10.1016/j.gtc.2015.02.015. Epub 2015 Apr 1. Gastroenterol Clin North Am. 2015. PMID: 26021206 Free PMC article. Review.
Cited by
-
Unraveling epigenetic heterogeneity across gastrointestinal adenocarcinomas through a standardized analytical framework.Mol Oncol. 2025 Apr;19(4):1117-1131. doi: 10.1002/1878-0261.13772. Epub 2024 Dec 18. Mol Oncol. 2025. PMID: 39696831 Free PMC article.
-
Validation of a methylated DNA marker panel for the nonendoscopic detection of Barrett's esophagus in a multisite case-control study.Gastrointest Endosc. 2021 Sep;94(3):498-505. doi: 10.1016/j.gie.2021.03.937. Epub 2021 Apr 20. Gastrointest Endosc. 2021. PMID: 33857451 Free PMC article.
-
Challenges in Determining the Role of Microbiome Evolution in Barrett's Esophagus and Progression to Esophageal Adenocarcinoma.Microorganisms. 2021 Sep 22;9(10):2003. doi: 10.3390/microorganisms9102003. Microorganisms. 2021. PMID: 34683324 Free PMC article. Review.
-
DNA methylation profile in CpG-depleted regions uncovers a high-risk subtype of early-stage colorectal cancer.J Natl Cancer Inst. 2023 Jan 10;115(1):52-61. doi: 10.1093/jnci/djac183. J Natl Cancer Inst. 2023. PMID: 36171645 Free PMC article.
-
Identification of key genes associated with esophageal adenocarcinoma based on bioinformatics analysis.Ann Transl Med. 2021 Dec;9(23):1711. doi: 10.21037/atm-21-4015. Ann Transl Med. 2021. PMID: 35071405 Free PMC article.
References
-
- Reid BJ. RESPONSE: re: clonal expansion and loss of heterozygosity at chromosomes 9p and 17p in premalignant esophageal (Barrett’s) tissue. J Natl Cancer Inst 2000;92(14):1182A–183. - PubMed
Publication types
MeSH terms
Substances
Supplementary concepts
Grants and funding
LinkOut - more resources
Full Text Sources
Other Literature Sources
Medical
Molecular Biology Databases
Research Materials
Miscellaneous