. 2018 Jul;30(7):1511-1522.
doi: 10.1105/tpc.18.00236. Epub 2018 Jun 8.

m6A RNA Degradation Products Are Catabolized by an Evolutionarily Conserved N6-Methyl-AMP Deaminase in Plant and Mammalian Cells

Affiliations

m6A RNA Degradation Products Are Catabolized by an Evolutionarily Conserved N6-Methyl-AMP Deaminase in Plant and Mammalian Cells

Mingjia Chen et al. Plant Cell. 2018 Jul.

Abstract

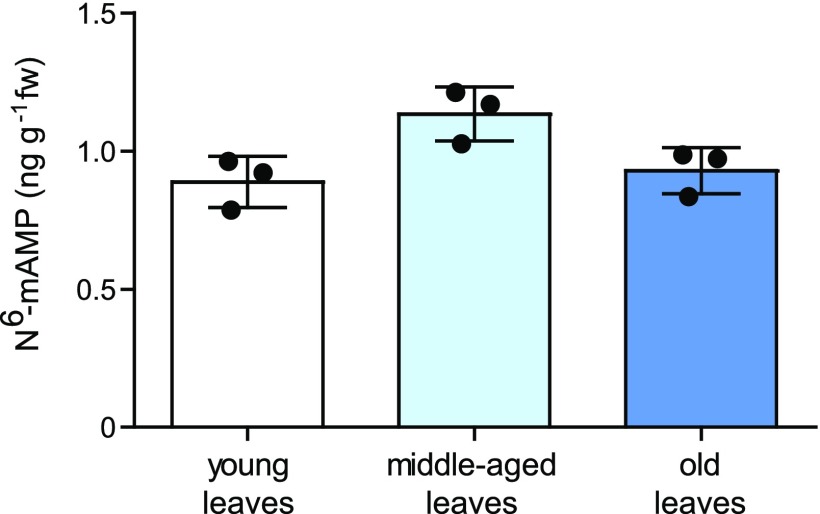
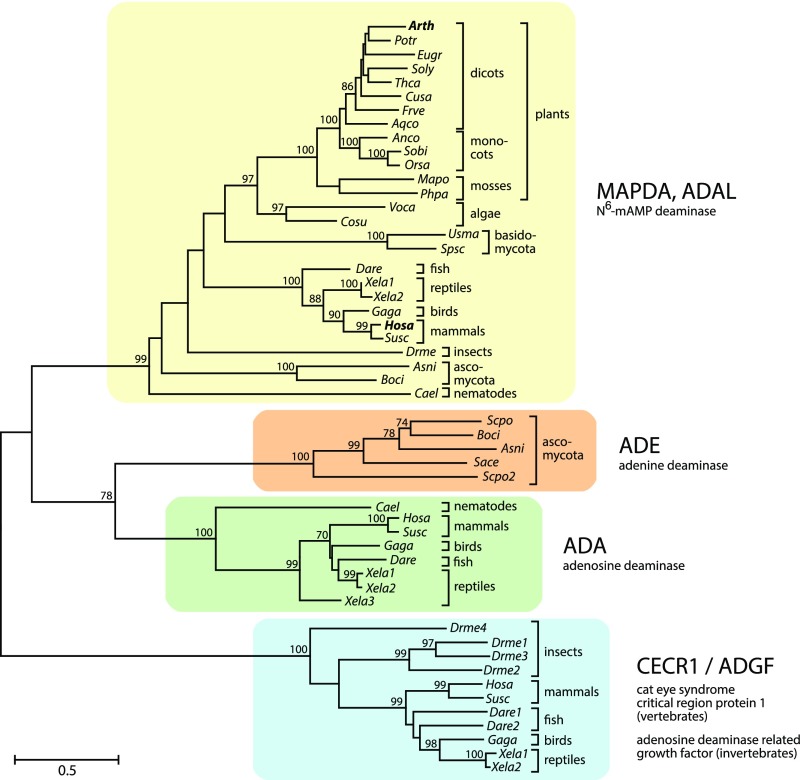
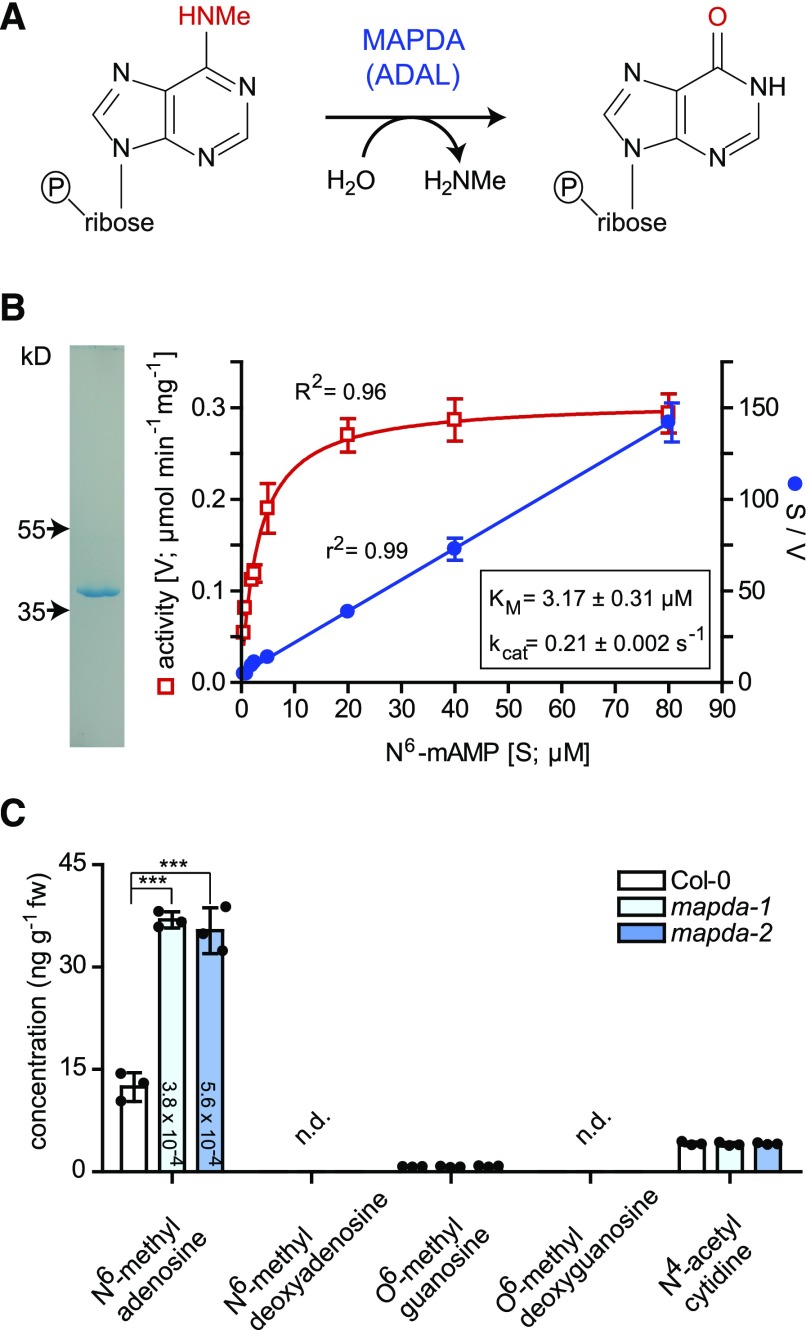
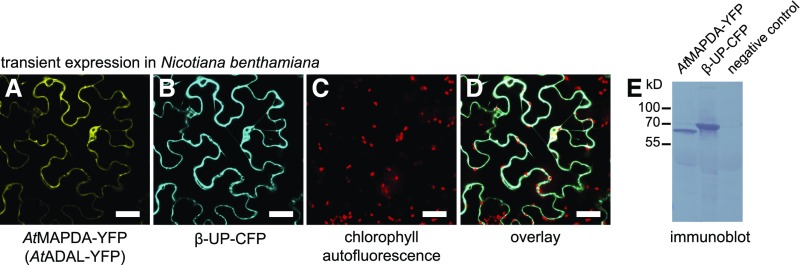
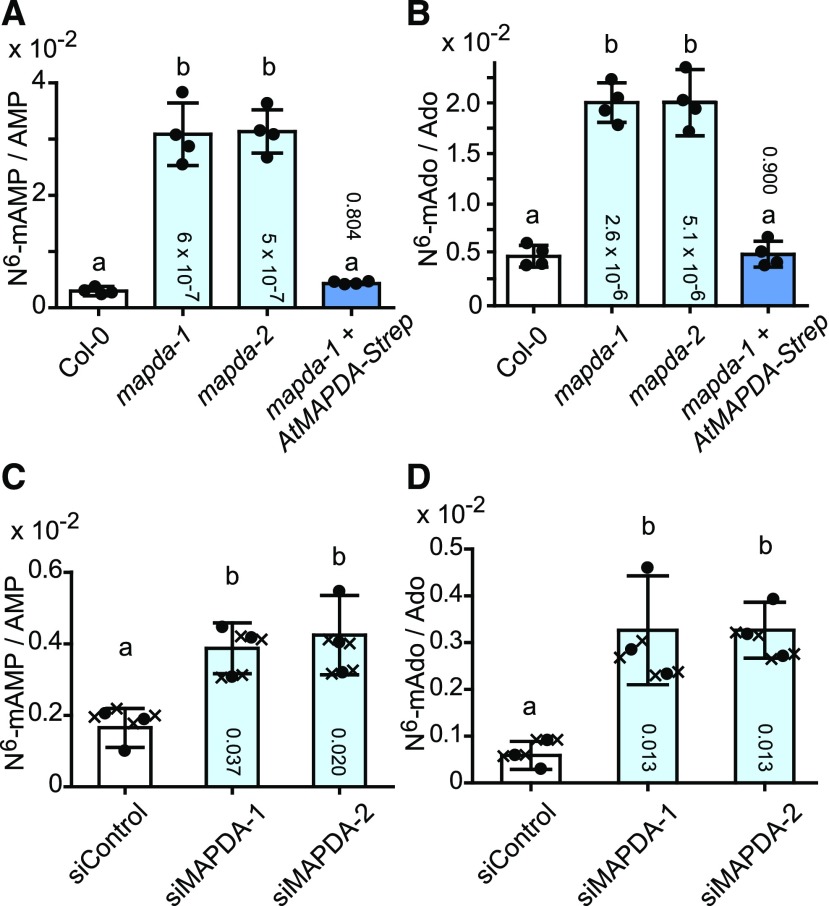
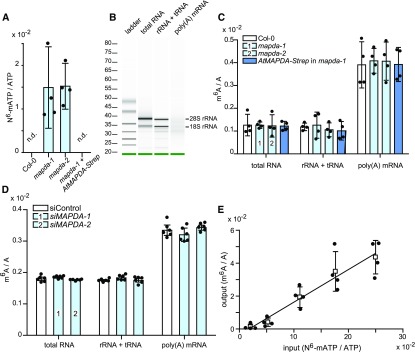
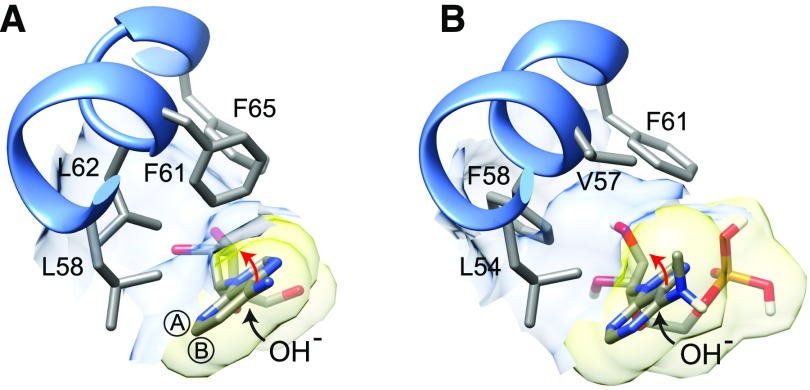
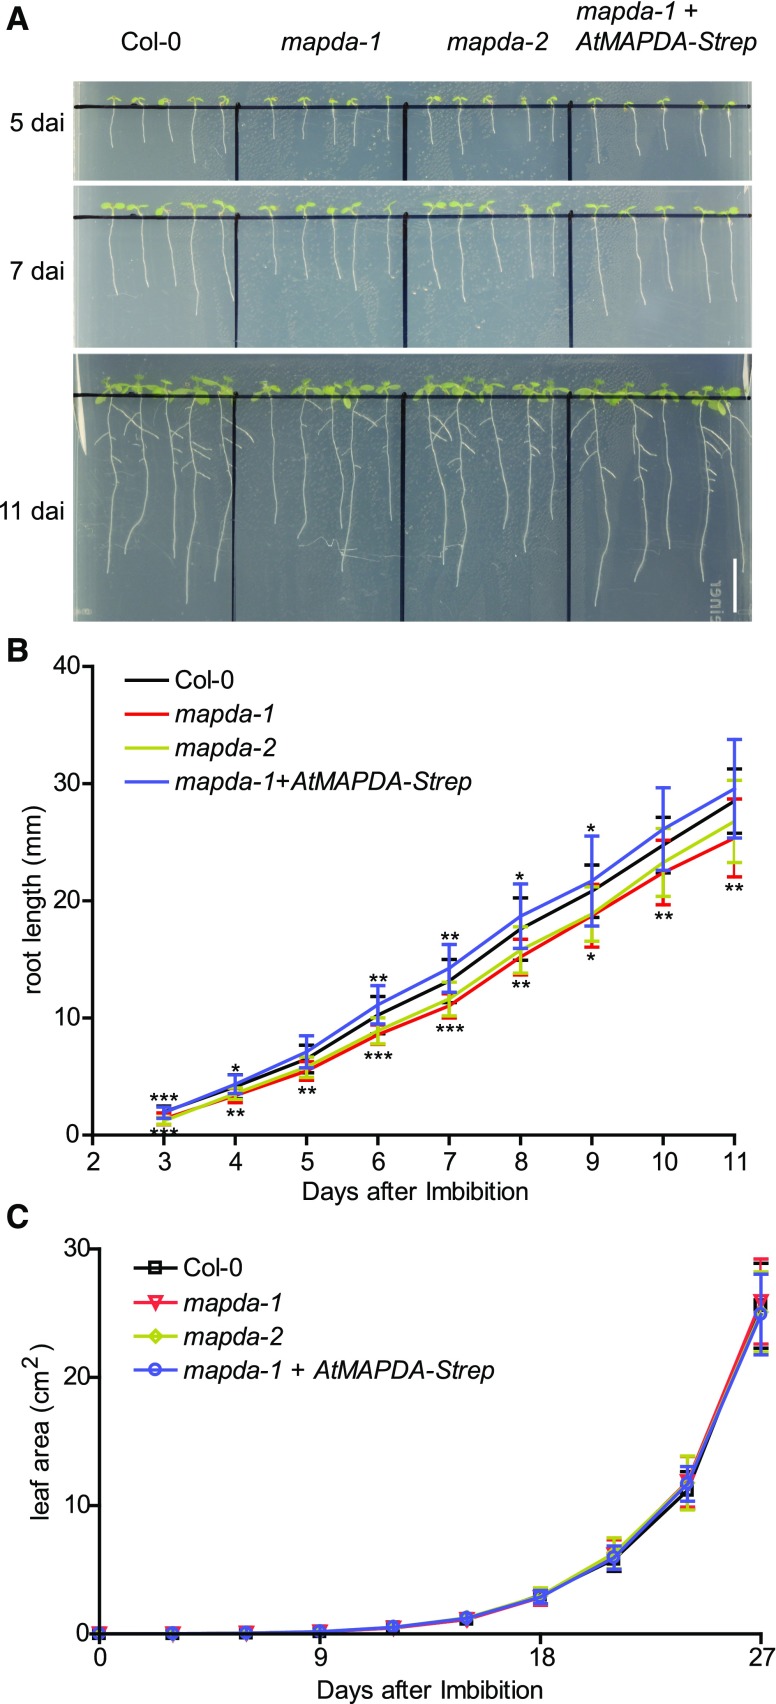
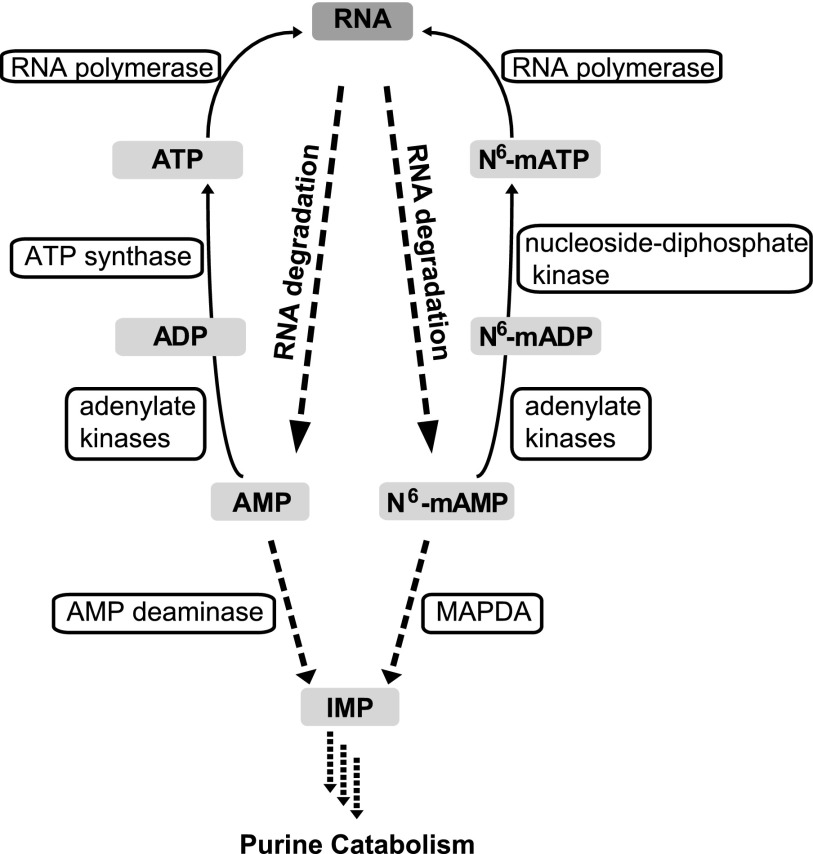
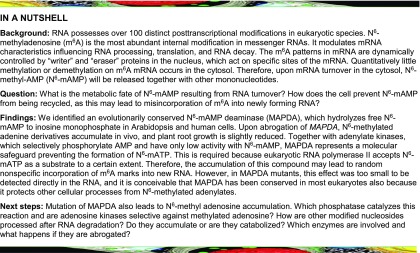
N6-methylated adenine (m6A) is the most frequent posttranscriptional modification in eukaryotic mRNA. Turnover of RNA generates N6-methylated AMP (N6-mAMP), which has an unclear metabolic fate. We show that Arabidopsis thaliana and human cells require an N6-mAMP deaminase (ADAL, renamed MAPDA) to catabolize N6-mAMP to inosine monophosphate in vivo by hydrolytically removing the aminomethyl group. A phylogenetic, structural, and biochemical analysis revealed that many fungi partially or fully lack MAPDA, which coincides with a minor role of N6A-RNA methylation in these organisms. MAPDA likely protects RNA from m6A misincorporation. This is required because eukaryotic RNA polymerase can use N6-mATP as a substrate. Upon abrogation of MAPDA, root growth is slightly reduced, and the N6-methyladenosine, N6-mAMP, and N6-mATP concentrations are increased in Arabidopsis. Although this will potentially lead to m6A misincorporation into RNA, we show that the frequency is too low to be reliably detected in vivo. Since N6-mAMP was severalfold more abundant than N6-mATP in MAPDA mutants, we speculate that additional molecular filters suppress the generation of N6-mATP. Enzyme kinetic data indicate that adenylate kinases represent such filters being highly selective for AMP versus N6-mAMP phosphorylation. We conclude that a multilayer molecular protection system is in place preventing N6-mAMP accumulation and salvage.


Figures

Figure 1.
Figure 1.
Absolute Quantification of N6-mAMP in Leaves of Different Ages. Young leaves (top 9 rosette leaves), middle-aged leaves (leaf position 20 to 22), and old leaves (leaf position 26 to 30) from 33-d-old plants were used. Statistical evaluation with ANOVA indicated a difference at P = 0.0338, but there is no tendency toward increased N6-mAMP content with leaf age. Error bars are sd (n = 3 independent plants).
Figure 2.
Figure 2.
Phylogenetic Analysis of the Eukaryotic Adenyl Deaminase Family Including MAPDA (ADAL), ADE, ADA, and the Adenosine Deaminase-Related Growth Factor. An unrooted maximum likelihood tree was constructed with MEGA 7 focusing on major model species representing a wide taxonomic range. The tree with the best log score is displayed, with branch lengths indicating the number of substitutions per site (legend). Numbers at branches indicate the percentage of trees in which associated taxa clustered together during bootstrap analysis (1000 bootstraps). Values below 70 are not shown. See Methods for details. CECR1/ADGF, adenosine deaminase-related growth factor.
Figure 3.
Figure 3.
Enzymatic Reaction of AtMAPDA (AtADAL). (A) Reaction scheme. (B) Purity after affinity purification of AtMAPDA-Strep shown on a Coomassie-stained gel (left panel) and determination of kinetic constants using this enzyme preparation (right panel). The kinetic data were fitted with the Michaelis-Menten equation (red) or by linear regression for the Hanes plot (S/V over S; blue). Error bars are sd (n = 3 independent reactions). (C) Concentrations of potential AtMAPDA substrates (after dephosphorylation) in leaf extracts of 7-d-old plants of the wild type and two independent AtMAPDA mutants. Detection limit of 0.0067 ng g−1 for N6-methyl deoxyadenosine and 0.56 ng g−1 for O6-methyl deoxyguanosine. Statistical evaluation with ANOVA followed by Tukey’s post test (relevant P values for the pairwise comparisons between Col-0 and the MAPDA mutants are shown on the columns; ***P < 0.001). Error bars are sd (n = 3 biological replicates, which are three pools containing several seedlings derived from seeds of three independent parental plants per genotype).
Figure 4.
Figure 4.
Subcellular Localization of AtMAPDA (AtADAL). (A) to (D) Confocal fluorescence microscopy images of cells at the lower leaf epidermis of N. benthamiana transiently coexpressing AtMAPDA C-terminally tagged with YFP (AtMAPDA-YFP) and cytosolic β-ureidopropionase C-terminally tagged with CFP (β-UP-CFP). YFP (A), CFP (B), autofluorescence of chloroplasts (C), and YFP, CFP, and autofluorescence detection (D). Bars = 40 µm. (E) Stability test of the AtMAPDA-YFP and β-UP-CFP fusion proteins analyzed by immunoblot developed with a GFP-specific antibody. The negative control was generated from leaves infiltrated only with the helper Agrobacterium tumefaciens carrying the silencing inhibitor construct.
Figure 5.
Figure 5.
Relative N6-mAMP and N6-Methyladenosine Accumulation in Arabidopsis Leaves and Human HeLa Cells Varying in MAPDA (ADAL) Expression. (A) N6-mAMP/AMP ratios of 7-d-old plants of Arabidopsis wild type (Col-0; white), the two AtMAPDA mutants (light blue), and a complementation line (dark blue). Error bars are sd (n = 4 biological replicates as defined in Figure 3C). (B) As in (A) but showing N6-methyladenosine/adenosine ratios (N6-mAdo/Ado). (C) N6-mAMP/AMP ratios in HeLa cells 3 d after transfection with either a control siRNA (siControl; white) or with two anti-HsMAPDA siRNAs (siMAPDA-1 and siMAPDA-2; light blue). Error bars are sd (n = 3 biological replicates from three independent transfections; “x” in contact with a data point of a biological replicate (circle) indicates technical replicates for this data point). (D) As in (C) but showing N6-methyladenosine/adenosine ratios. Statistical evaluation with ANOVA followed by Tukey’s post test. Probability values for pairwise comparisons to Col-0 or the siControl, respectively, are shown at the respective bars. Same letters label data that are not significantly different (P > 0.05).
Figure 6.
Figure 6.
Relative N6-mATP Accumulation and m6A Frequency in Different RNA Species in Arabidopsis Leaves and HeLa Cells Varying in MAPDA (ADAL) Expression and Selectivity of RNA Polymerase II for ATP versus N6-mATP. (A) N6-mATP/ATP ratio of 7-d-old seedlings of Arabidopsis wild type (Col-0), the two AtMAPDA mutants (light blue), and a complementation line. Error bars are sd (n = 4 biological replicates as defined in Figure 3C). (B) The integrity of the purified RNA samples and the efficient removal of rRNA from mRNA was analyzed using a Bioanalyzer 2100. The level of rRNA contamination in the mRNA was estimated to be 1.3%. (C) m6A frequency relative to A in total RNA, nonpolyadenylated RNA (rRNA and tRNA), and mRNA of 7-d-old seedlings of wild type (Col-0; white), the two AtMAPDA mutants (light blue), and the complementation line (dark blue). Error bars are sd (n = 4; two independent RNA extractions and RNA isolations, each RNA digested twice). Statistical evaluation with ANOVA showed no significant (P < 0.05) differences between the respective RNA species from the distinct genotypes. (D) m6A frequency relative to A in total RNA, nonpolyadenylated RNA (rRNA and tRNA), and mRNA from HeLa cells transfected either with control siRNA (white) or two independent siRNAs directed against HsMAPDA (light blue). Error bars are sd (n = 6 independent digestions from one RNA isolation). Statistical evaluation with ANOVA showed no significant (P < 0.05) differences between the genotypes. (E) Relative incorporation of m6A per total A into mRNA (output) synthesized in vitro by RNA polymerase II using a commercial HeLa cell transcription assay at varying input ratios of N6-mATP/ATP. Error bars are sd (n = 4 independent transcription reactions).
Figure 7.
Figure 7.
Models of Substrate Binding to ADA and MAPDA. (A) Binding of the A-face side of the 1-deaza-adenine ring of 1-deaza-adenosine to the hydrophobic residues between Leu-58 and Phe-65 of human ADA (PDB accession 1ADD). Encircled A and B indicate the A- and B-faces of the purine ring, respectively. (B) Hypothetical binding of the A-face of the N6-methyladenine ring of N6-mAMP to the hydrophobic residues between Leu-54 and Phe-61 of the Arabidopsis MAPDA protein model. The black arrows in (A) and (B) indicate that during catalysis, the addition of water occurs from the B-face side of the purine ring. This leads to a tetrahydral configuration on C6 moving the amino or methyl-amino group above the A-face side of the ring (red arrow) in the reaction intermediate. Note that in the MAPDA model, a putative hydrophobic pocket is formed by Val-57 and Phe-58, which can potentially accommodate the methyl-amino group.
Figure 8.
Figure 8.
Comparison of the Root Length and Rosette Leaf Area of the Wild Type, the MAPDA Mutants, and a Complementation Line. (A) Representative images of the root development observed for the respective genotypes grown on half-strength Murashige and Skoog plates under long-day conditions (16 h light). Bar = 10 mm. d.a.i., days after imbibition. (B) Root length analysis from plants grown as shown in (A). Statistical evaluation with ANOVA followed by Tukey’s post test. Significance levels of P < 0.05, P < 0.01, and P < 0.001 is indicated in the figure by single, double, and triple asterisks, respectively. Error bars are sd (n = 25 independent plants per genotype grown on five plates). (C) Quantification of rosette leave area for plants grown in soil under long-day conditions (16 h light). According to statistical evaluation with ANOVA, there are no significant (P < 0.05) differences between the genotypes. Error bar are sd (n = 10 independent plants per genotype grown as shown in Supplemental Figure 9).
Figure 9.
Figure 9.
A Model of Adenine Nucleotide Conversions. The phosphorylation of ADP to ATP is catalyzed by ATP synthase. By contrast, the phosphorylation of N6-mADP to N6-mATP is probably catalyzed by nucleoside diphosphate kinases, which use ATP to phosphorylate a broad range of purine and pyrimidine dinucleotides and deoxydinucleotides.
None

Comment in

References

    1. Alonso J.M., et al. (2003). Genome-wide insertional mutagenesis of Arabidopsis thaliana. Science 301: 653–657. - PubMed
    1. Chen M., Herde M., Witte C.-P. (2016). Of the nine cytidine deaminase-like genes in Arabidopsis, eight are pseudogenes and only one is required to maintain pyrimidine homeostasis in vivo. Plant Physiol. 171: 799–809. - PMC - PubMed
    1. Dahncke K., Witte C.-P. (2013). Plant purine nucleoside catabolism employs a guanosine deaminase required for the generation of xanthosine in Arabidopsis. Plant Cell 25: 4101–4109. - PMC - PubMed
    1. Ikeuchi Y., Kitahara K., Suzuki T. (2008). The RNA acetyltransferase driven by ATP hydrolysis synthesizes N4-acetylcytidine of tRNA anticodon. EMBO J. 27: 2194–2203. - PMC - PubMed
    1. Jia G., Fu Y., Zhao X., Dai Q., Zheng G., Yang Y., Yi C., Lindahl T., Pan T., Yang Y.-G., He C. (2011). N6-methyladenosine in nuclear RNA is a major substrate of the obesity-associated FTO. Nat. Chem. Biol. 7: 885–887. - PMC - PubMed

Publication types