. 2018 Jun 8;9(1):2260.
doi: 10.1038/s41467-018-04627-5.

Rapid and widespread white matter plasticity during an intensive reading intervention

Affiliations

Rapid and widespread white matter plasticity during an intensive reading intervention

Elizabeth Huber et al. Nat Commun. .

Abstract

White matter tissue properties are known to correlate with performance across domains ranging from reading to math, to executive function. Here, we use a longitudinal intervention design to examine experience-dependent growth in reading skills and white matter in grade school-aged, struggling readers. Diffusion MRI data were collected at regular intervals during an 8-week, intensive reading intervention. These measurements reveal large-scale changes throughout a collection of white matter tracts, in concert with growth in reading skill. Additionally, we identify tracts whose properties predict reading skill but remain fixed throughout the intervention, suggesting that some anatomical properties stably predict the ease with which a child learns to read, while others dynamically reflect the effects of experience. These results underscore the importance of considering recent experience when interpreting cross-sectional anatomy-behavior correlations. Widespread changes throughout the white matter may be a hallmark of rapid plasticity associated with an intensive learning experience.


Conflict of interest statement

The authors declare no competing interests.

Figures

Fig. 1
Fig. 1
Pathways connecting the core reading circuitry correlate with pre-intervention Reading Skill. Tract average mean diffusivity (MD) is plotted as a function of pre-intervention (Session 1) reading skill. Best-fit lines plotted in gray give estimates for the full dataset, while colored lines show fits for the intervention subjects, alone. Correlations for the intervention subjects are given in colored text below the value estimated for the full dataset (in black)
Fig. 2
Fig. 2
Change vs. stability in Tract Profiles during reading intervention. a Mean diffusivity (MD) values were mapped onto each of the 100 evenly spaced nodes spanning termination points at the gray–white matter boundary to create a ‘Tract Profile’ (see Methods and ref. for additional details of this analysis). For visualization purposes, the middle 80 nodes are plotted. Each line represents the group average MD across subjects, measured at four time points: pre-intervention (Session 1), after ~2.5 weeks of intervention (Session 2), after ~5 weeks of intervention (Session 3), and after 8 weeks of intervention (Session 4). Shaded error bars give ±1 standard error of the mean. Color values indicate session, ranging from darkest (Session 1) to brightest (Session 4) for each tract. The x axis shows the location where each tract was clipped prior to analysis (corresponding to black boundary lines in renderings,  below). Tract renderings are shown for an example subject. The middle 60% (bounded by black lines) of each tract was analyzed in b, c, to avoid partial volume effects that occur at endpoints of the tract, where it enters cortex. Both the arcuate fasciculus (AF) and inferior longitudinal fasciculus (ILF), but not the posterior callosal connections, show a systematic decrease in MD over the course of intervention. b, c Bars show model-predicted change (coefficients and standard errors from mixed effects model) in MD (b) and FA (c) for each session. Bar heights represent the magnitude of change observed in that session, relative to Session 1 (pre-intervention) baseline, as determined by the mixed effects model. As described in the main text, both the AF and ILF showed significant change between sessions for the intervention group (filled bars) but not the control group (unfilled bars). Asterisks indicate a significant decrease in MD (b) or increase in FA (c) for each session relative to the pre-intervention baseline at a Bonferroni-corrected *p < 0.05 and **p < 0.01
Fig. 3
Fig. 3
Reading intervention does not normalize differences in the white matter. Reading skill is plotted as a function of mean diffusivity for each session (1–4) for the left arcuate, ILF, and posterior callosal tracts in the intervention group. The gray circle and lines in each panel show the mean and standard error at Session 1 for the subset non-intervention control subjects with reading skills in the typical range (poor reading controls were excluded, leaving n = 10 typical reading controls). The dashed gray arrow shows the expected trajectory for MD values if the intervention group were to become more similar to the typical reading controls in terms of both reading skills and MD. In contrast, the true trajectory of change in plotted as a colored arrow in each panel. The intervention group includes some readers with only moderate reading impairments (and, therefore, higher MD values), and so the group difference in pre-intervention scores is less than would be expected for a group of good vs. poor readers. Supplementary Fig. 7 reproduces the intervention data alongside the same mean and SE plots for the full sample of control subjects during sessions 1–3, to further illustrate the relative stability of both white matter and behavior in the control group
Fig. 4
Fig. 4
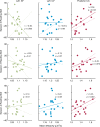
Correlations between white matter properties and reading skill change during learning. Plots show the cross-sectional correlation for sessions 2–4 (top to bottom) for each tract for the intervention group. A solid best-fit line is plotted for each session. A dashed line in each panel represents the best-fit line for the preceding session (session n−1) to illustrate the session-to-session changes. For the AF and ILF, correlations change in size and/or direction, demonstrating that anatomy–behavior relationships can depend on recent educational experience
Fig. 5
Fig. 5
Analysis of individual growth trajectories in the AF and ILF. a Left arcuate and ILF mean diffusivity (MD) time courses are correlated across individual subjects. For visualization, standardized MD values are plotted for each tract at each available time point for all subjects. Individual time courses are enlarged for a set of six example subjects to show greater detail. Individual AF and ILF time courses were positively correlated, and a cross-correlation analysis failed to detect a significant correlation at any non-zero lag, consistent with the interpretation that growth occurs in concert across tracts. b MD values were mean-centered for each subject, thus representing each subject’s time course of MD changes as modulations around their mean. Mean-centered values at each available time point are plotted for the AF vs. ILF showing tight correspondence between changes in these two tracts. c The time course of change in Reading Skill varies across subjects and is negatively related to individual white matter time courses: Within a subject, as MD decreases in the ILF, Reading Skill increase. For visualization, standardized Reading Skill and MD values are plotted for the ILF at each available time point for all subjects. As in a, time courses are enlarged for a set of six example subjects to show individual subject trajectories in greater detail. d Mean-centered MD values at each available time point for the ILF correlate with mean-centered Reading Skill assessed at each time point, demonstrating the relationship between time courses of MD and Reading Skill change. The scatter plots in b, d also make it clear that the time course of plasticity is more tightly coupled across tracts than it is to behavior. Hence, even though there is a statistically significant relationship between the time course of white matter and behavioral changes, there is also un-explained variance that is likely to be related to aspects of the intervention environment that do not directly impact behavior
Fig. 6
Fig. 6
Reading intervention causes distributed changes in the white matter. a Change in MD as a function of intervention time (in hours) for 18 tracts. Tracts showing significant change (Bonferroni-corrected p < 0.05) are indicated as gray filled bars. Error bars depict standard errors from a linear mixed effects model. b Hierarchical clustering based on the correlations between linear growth rates. The heat map represents Pearson correlations between linear growth rates for pairs of tracts across individuals. The matrix is sorted according to hierarchical clustering of these correlation coefficients. c Scatter plots of individual growth rates for three pairs of tracts: left vs. right IFOF, AF vs. CC, and AF vs. right thalamic radiation

References

    1. Klingberg T, et al. Microstructure of temporo-parietal white matter as a basis for reading ability: evidence from diffusion tensor magnetic resonance imaging. Neuron. 2000;25:493–500. doi: 10.1016/S0896-6273(00)80911-3. - DOI - PubMed
    1. Dougherty RF, et al. Temporal-callosal pathway diffusivity predicts phonological skills in children. Proc. Natl. Acad. Sci. USA. 2007;104:8556–8561. doi: 10.1073/pnas.0608961104. - DOI - PMC - PubMed
    1. Odegard TN, Farris EA, Ring J, McColl R, Black J. Brain connectivity in non-reading impaired children and children diagnosed with developmental dyslexia. Neuropsychologia. 2009;47:1972–1977. doi: 10.1016/j.neuropsychologia.2009.03.009. - DOI - PubMed
    1. Yeatman JD, et al. Anatomical properties of the arcuate fasciculus predict phonological and reading skills in children. J. Cogn. Neurosci. 2011;23:3304–3317. doi: 10.1162/jocn_a_00061. - DOI - PMC - PubMed
    1. Zhang M, et al. Language-general and -specific white matter microstructural bases for reading. Neuroimage. 2014;98:435–441. doi: 10.1016/j.neuroimage.2014.04.080. - DOI - PMC - PubMed

Publication types

LinkOut - more resources