. 2018 Jun 8;9(1):2223.
doi: 10.1038/s41467-018-04581-2.

Macrophage migration inhibitory factor is required for NLRP3 inflammasome activation

Affiliations

Macrophage migration inhibitory factor is required for NLRP3 inflammasome activation

Tali Lang et al. Nat Commun. .

Abstract

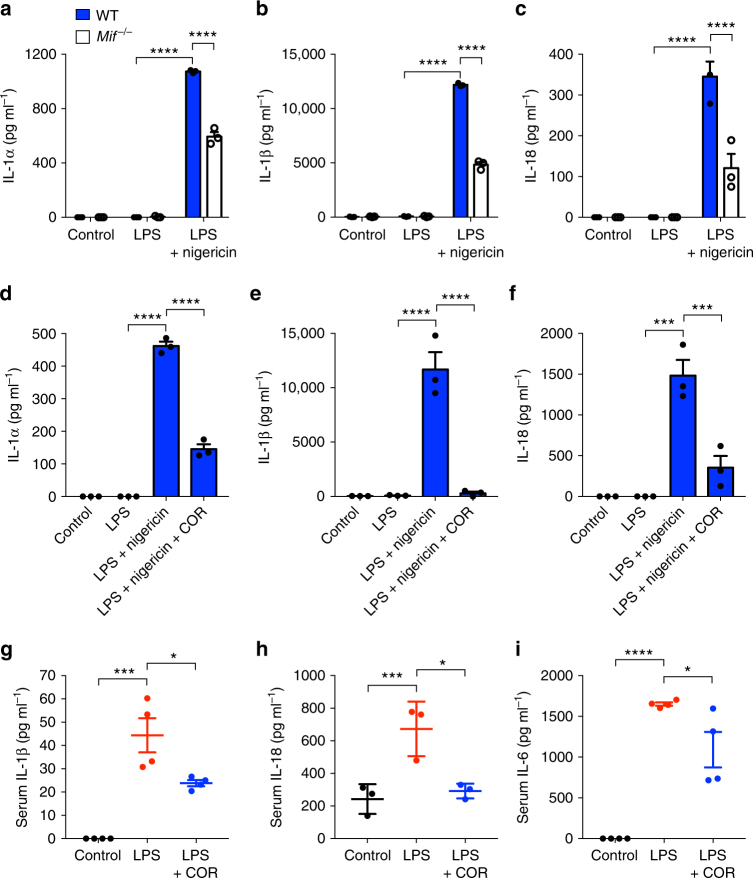
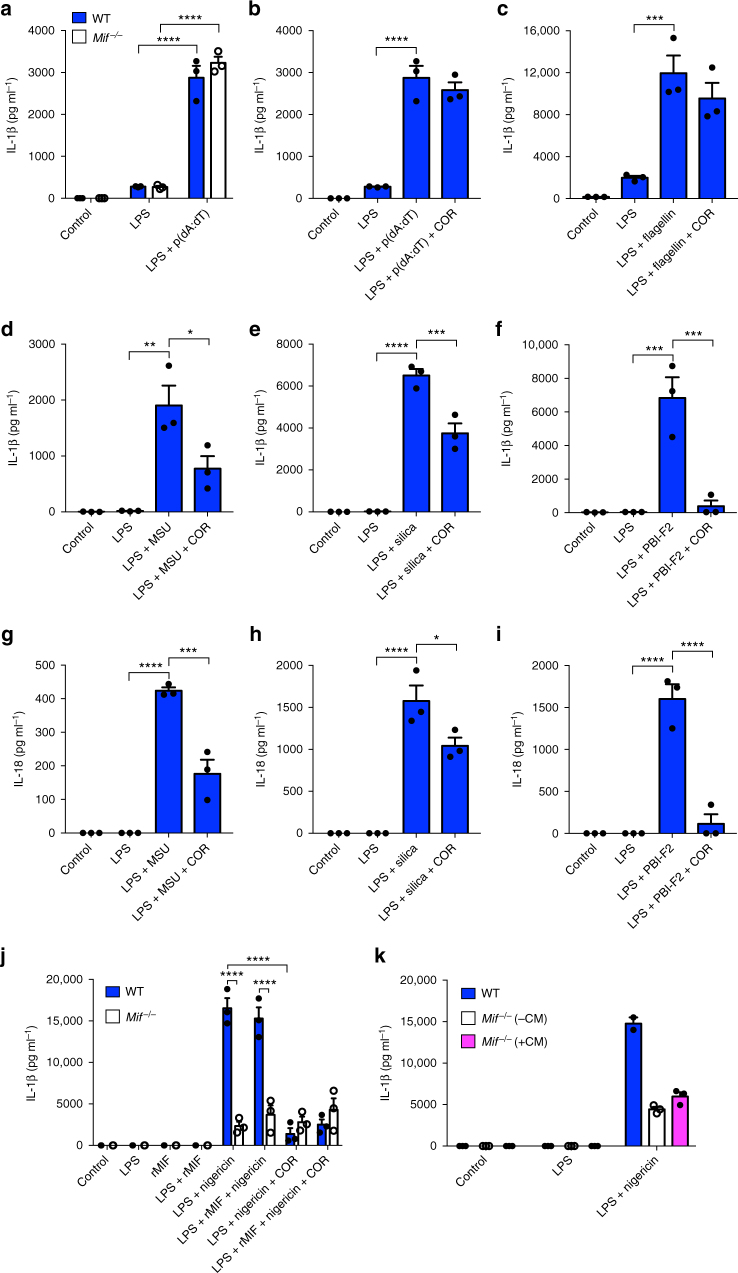
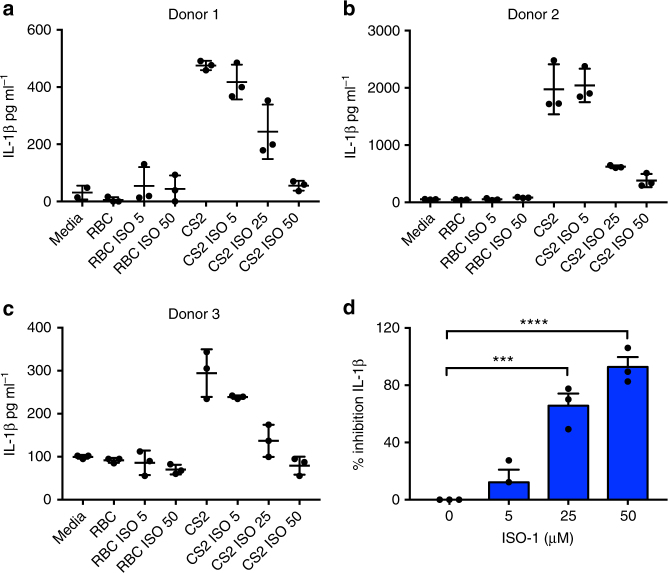
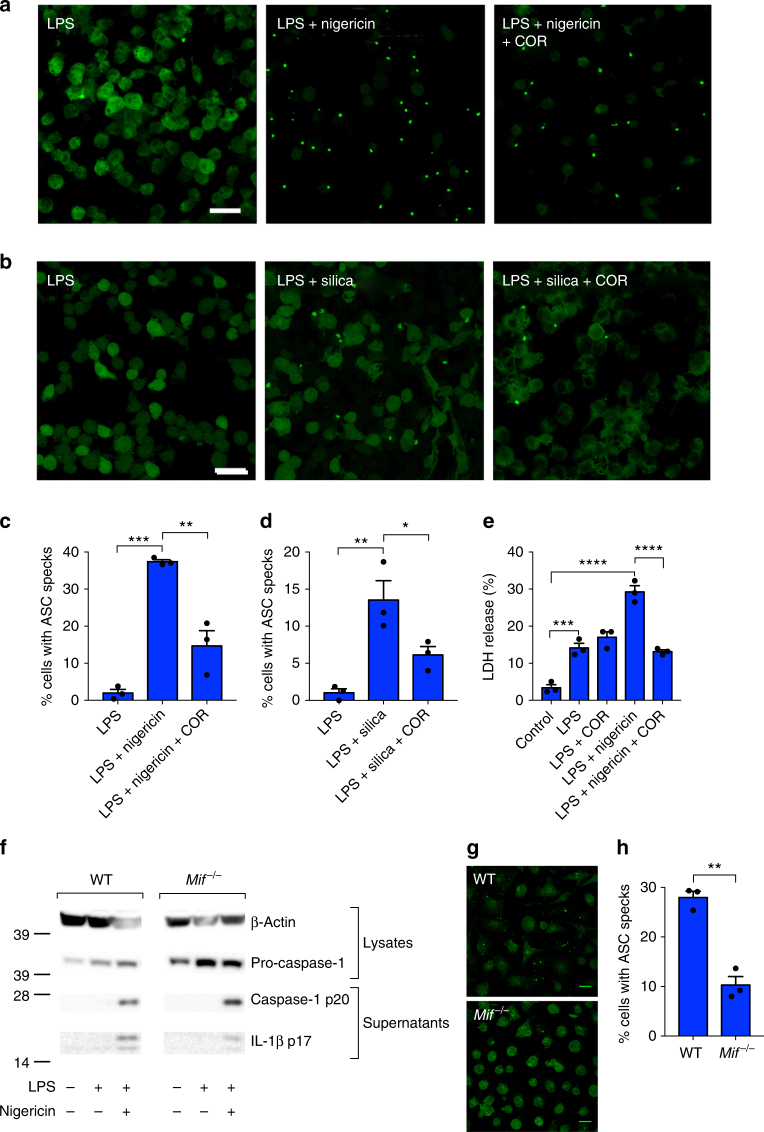
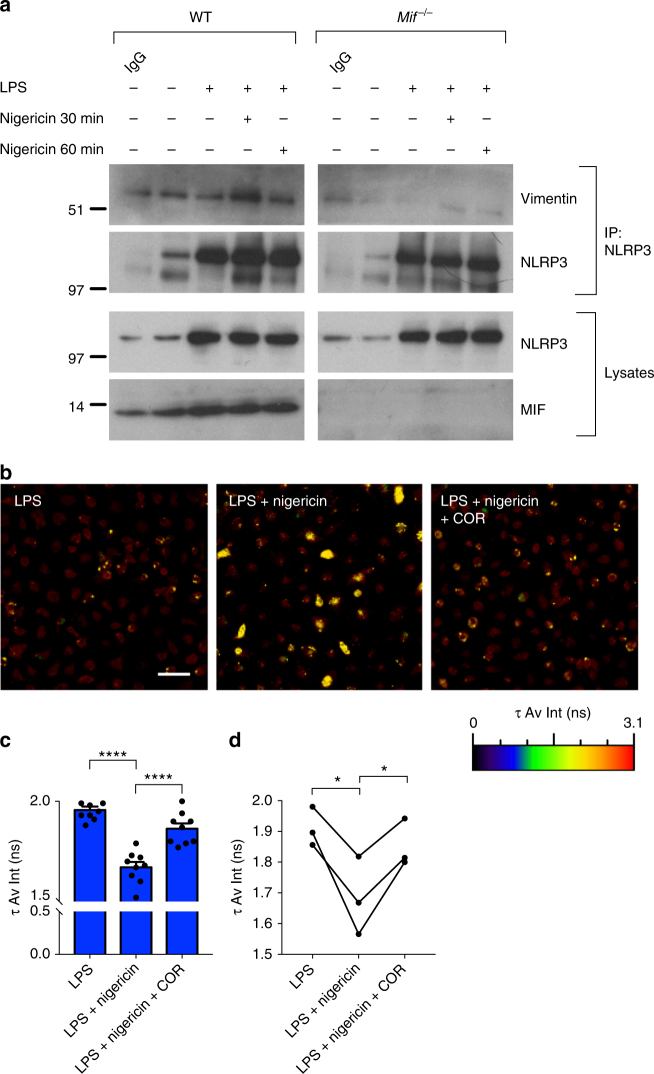
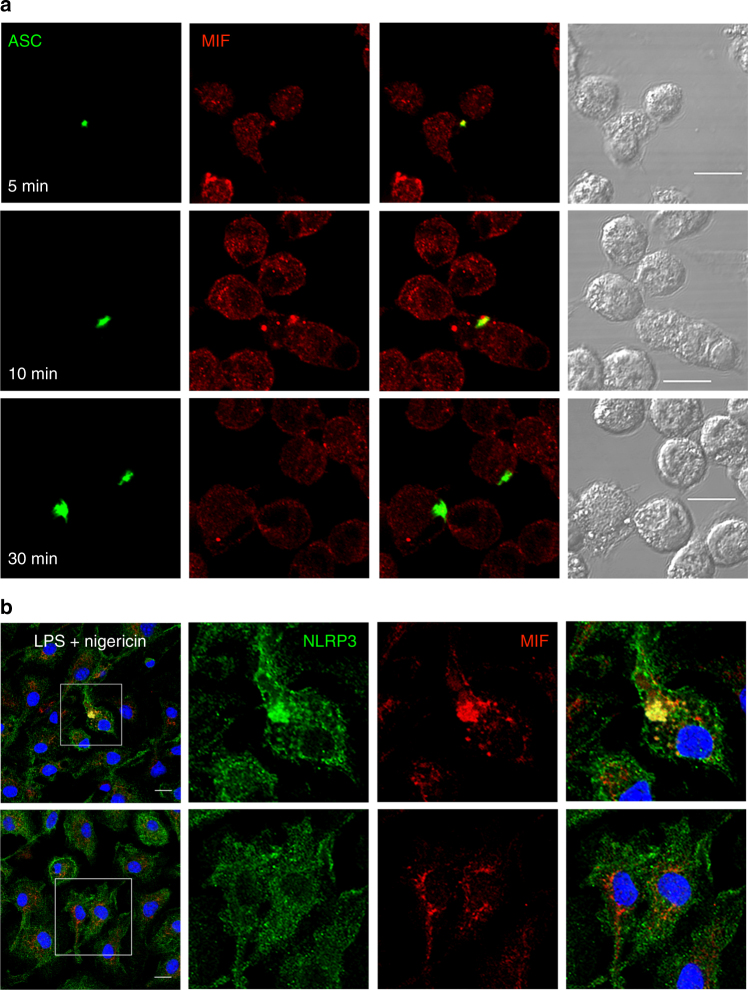
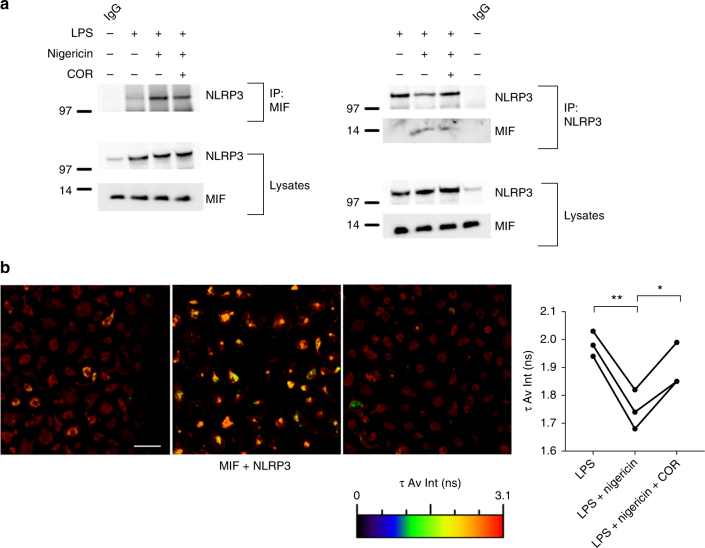
Macrophage migration inhibitory factor (MIF) exerts multiple effects on immune cells, as well as having functions outside the immune system. MIF can promote inflammation through the induction of other cytokines, including TNF, IL-6, and IL-1 family cytokines. Here, we show that inhibition of MIF regulates the release of IL-1α, IL-1β, and IL-18, not by affecting transcription or translation of these cytokines, but via activation of the NLRP3 inflammasome. MIF is required for the interaction between NLRP3 and the intermediate filament protein vimentin, which is critical for NLRP3 activation. Further, we demonstrate that MIF interacts with NLRP3, indicating a role for MIF in inflammasome activation independent of its role as a cytokine. These data advance our understanding of how MIF regulates inflammation and identify it as a factor critical for NLRP3 inflammasome activation.


Conflict of interest statement

The authors declare no competing interests.

Figures

Fig. 1
Fig. 1
MIF is required for the release of IL-1 family cytokines. Primary murine WT and Mif−/− BMDMs were left untreated (control), primed with LPS (10 ng ml1), or primed with LPS followed by nigericin (5 µM) treatment for 1 h. Levels of a IL-1α, b IL-1β, and c IL-18 in cell culture supernatants were assessed by ELISA. Primary WT BMDMs were left untreated, primed with LPS alone (10 ng ml1), primed with LPS, and then treated with or without COR123625 (50 µM) for 2 h before the addition of nigericin (5 µM) for 1 h. Levels of d IL-1α, e IL-1β, and f IL-18 in cell culture supernatants were assessed by ELISA. C57BL6/J mice were injected intraperitoneally with vehicle control (saline), LPS alone (2 mg kg1) or COR123625 (20 mg kg1) in combination with LPS for 2 h. Serum levels of g IL-1β, h IL-18, and i IL-6 were measured by ELISA. Data are expressed as means ± SEM, n = 3–4 mice per group. *P < 0.05, ***P < 0.005, ****P < 0.001, one-way ANOVA with a correction provided by the Tukey's multiple comparisons test
Fig. 2
Fig. 2
MIF regulates NLRP3-dependent release of IL-1 family cytokines. a Primary murine WT or Mif−/− BMDMs were left untreated, primed with LPS alone (10 ng ml1), or primed with LPS before transfection of poly dA:dT (1 µg ml1) for 5 h. WT BMDMs were left untreated, primed with LPS (10 ng ml1), or primed with LPS before the addition of COR123625 (50 µM) for 2 h before transfection of b poly dA:dT (1 µg ml1) or c flagellin (250 ng ml1) for 5 h. Alternatively, following priming of WT BMDMs with LPS, cells were treated with d, g MSU (150 µg ml1), e, h silica (150 µg ml1), or (f, i) PBI-F2 peptide (100 µg ml1) for 6 h. Levels of af IL-1β and gi IL-18 in cell culture supernatants were quantified by ELISA. j Primary WT or Mif−/− BMDMs were primed with LPS (10 ng ml1) in the presence or absence of recombinant murine MIF (rMIF, 10 ng ml1) before stimulation with nigericin (5 µM) for 1 h. In addition, cells were treated with or without COR123625. Levels of IL-1β in cell culture supernatants were assessed by ELISA. k Primary WT or Mif/ BMDMs were primed with LPS (10 ng ml1) in the presence or absence of MIF-containing conditioned media from WT BMDM before stimulation with nigericin (5 µM) for 1 h. Levels of IL-1β in cell culture supernatants were assessed by ELISA. Data are expressed as means ± SEM, n = 3 mice. *P < 0.05, **P < 0.01, ***P < 0.005, ****P < 0.001, one-way ANOVA with a correction provided by the Tukey's multiple comparisons test
Fig. 3
Fig. 3
ISO-1 inhibits IL-1β in response to Plasmodium falciparum. ac Viable human PBMCs collected from three donors were co-cultured with 2 × 106 non-infected or CS2-infected RBC. Cells were either treated with DMSO alone (control) or with increasing concentrations of ISO-1 (5, 25, or 50 µM) for 16 h. Levels of IL-1β in cell culture supernatants were quantified by ELISA. d Percentage inhibition calculated for all three donors ± SEM ***P < 0.005, ****P < 0.001, one-way ANOVA with a correction provided by the Tukey's multiple comparisons test
Fig. 4
Fig. 4
Inhibition of MIF does not prevent transcription or translation of IL-1β. a NF-κB luciferase activity measured in RAW-ELAM macrophages pre-treated with COR123625 (50 µM) for 1 h prior to priming with LPS (100 ng ml1) for 4 h. b Primary murine WT BMDM or c human undifferentiated THP-1 cells were left untreated, primed with LPS (100 ng ml1) alone for 4 h, or pre-treated with COR123625 (50 µM) for 1 h before the addition of LPS. Relative expression (RE—relative to 18S) of il1b mRNA was quantified using real-time PCR. Data are mean ± SEM, n = 3 independent experiments. *P < 0.05, ****P < 0.001, one-way ANOVA with a correction provided by the Tukey's multiple comparisons test. d WT BMDMs were left untreated, primed with LPS alone (100 ng ml1) for 5 h, pre-treated with COR123625 for 1 h prior to the addition of LPS, primed with LPS before inflammasome activation with nigericin (5 µM) for 1 h, or treated with COR123625 before LPS and nigericin stimulation. Western blot analysis of cellular supernatants and lysates to assess levels of NLRP3, ASC, pro-IL-1β, pro-caspase-1, mature IL-1β (p17), caspase-1 (p20), and β-actin was performed. e Densitometry was used to calculate expression of intracellular proteins shown in d. Mean expression was normalized to β-actin and expressed as relative to levels in control (untreated) samples n = 4 separate experiments (four mice)
Fig. 5
Fig. 5
Inhibition of MIF prevents NLRP3 inflammasome activation. ASC-cerulean macrophages were primed with LPS (10 ng ml1) overnight. The following day cells were treated with COR123625 (50 µM) for 2 h before activation of the inflammasome with a nigericin (10 µM) (1 h) or b silica (150 µg ml1) (4 h). Confocal images are representative of three independent experiments. c, d Data are presented as the percentage of ASC-speck-positive cells. Data shown are mean ± SEM of three independent experiments. e WT BMDMs were left untreated, treated with LPS alone (100 ng ml1) for 5 h, treated with COR123625 for 1 h prior to the addition of LPS, primed with LPS before inflammasome activation with nigericin (5 µM) for 1 h, or treated with COR123625 before LPS and nigericin stimulation. Levels of LDH release were quantified using the Promega cytotoxicity assay. f WT or Mif/ BMDMs were treated with LPS (10 ng ml1) + nigericin (5 μM) and lysates and supernatants analyzed by Western blot for caspase-1 and IL-1β. Images are representative of >3 mice. g BMDMs from WT and Mif/ mice were treated with (10 ng ml1) + nigericin (5 μM), fixed and stained for ASC, and analyzed by confocal microscopy. Images are z projections of multiple z-stacks. h Quantitation of ASC specks in g, n = 3 mice per group. Data are expressed as percentage increase of mean ± SEM from three mice. *P < 0.05, **P < 0.01, ***P < 0.005, or ****P < 0.001, one-way ANOVA with a correction provided by the Tukey's multiple comparisons test
Fig. 6
Fig. 6
MIF is required for interactions between NLRP3 and vimentin. a Primary murine WT and Mif−/− BMDMs were left untreated, primed with LPS alone (100 ng ml1) for 5 h, or primed with LPS before inflammasome activation with nigericin (5 µM) for indicated times. Lysates were immunoprecipitated with anti-NLRP3 antibody, followed by Western blot analysis with anti-vimentin antibody. b WT BMDMs were primed with LPS alone (100 ng ml1) for 5 h, primed with LPS followed by nigericin (5 µM) for 1 h, or primed with LPS followed by COR123625 (50 µM) for 2 h prior to nigericin (5 µM) treatment for 30 min. Levels of interaction between NLRP3 and vimentin were assessed by FLIM-FRET. FLIM-FRET images presented are representative of three independent experiments (three mice). Scale bar = 50 μm. c Changes in the amplitude-weighted average lifetime (τ Av Amp) of the donor (A488) due to proximity to the acceptor (A568). Representative graph from one mouse (nine separate fields per mouse). ****P < 0.001, one-way ANOVA with a correction provided by the Tukey's multiple comparisons test. d Combined data from three mice, analyzed by paired t test. *P < 0.05
Fig. 7
Fig. 7
MIF co-localizes with the NLRP3 inflammasome. a ASC-cerulean macrophages were primed with LPS (10 ng ml1) overnight. The following day cells were treated with nigericin (10 µM) for the indicated times. Co-localization of ASC (green) and MIF (red) were visualized using confocal microscopy. Confocal images are representative of at least three independent experiments. b Primary murine BMDMs were treated with LPS (10 ng ml1) overnight, and then treated with or without COR123625 (50 µM), followed by nigericin (5 µM) for 20 min. Cells were fixed and stained with antibodies against NLRP3 and MIF. Nuclei were stained with DAPI. All scale bars = 10 μm
Fig. 8
Fig. 8
MIF interacts with NLRP3. a Immortalized BMDMs were left untreated, primed with LPS alone (100 ng ml1) for 5 h, or primed with LPS before inflammasome activation with nigericin (5 µM, 30 min). Lysates were immunoprecipitated with anti-MIF or anti-NLRP3 antibody, followed by western blot analysis with antibodies against NLRP3 and MIF. b WT BMDMs were primed with LPS alone (10 ng ml1) for 5 h, primed with LPS followed by NLRP3 activation with nigericin (5 µM) for 30 min, or primed with LPS followed by COR123625 (50 µM) treatment for 2 h prior to the addition of nigericin (5 µM) for 30 min. Levels of interaction between MIF and NLRP3 were assessed by FLIM-FRET microscopy. FLIM-FRET images presented are representative of three independent experiments. Scale bar = 50 μm. Graphs show changes in the amplitude-weighted average lifetime (τ Av Amp) of the donor (A488) due to proximity to the acceptor (A568). Combined data from three mice, analyzed by paired t test. *P < 0.05, **P < 0.01

References

    1. Calandra T, Roger T. Macrophage migration inhibitory factor: a regulator of innate immunity. Nat. Rev. Immunol. 2003;3:791–800. doi: 10.1038/nri1200. - DOI - PMC - PubMed
    1. Kleemann R, et al. Disulfide analysis reveals a role for macrophage migration inhibitory factor (MIF) as thiol-protein oxidoreductase. J. Mol. Biol. 1998;280:85–102. doi: 10.1006/jmbi.1998.1864. - DOI - PubMed
    1. Subramanya HS, et al. Enzymatic ketonization of 2-hydroxymuconate: specificity and mechanism investigated by the crystal structures of two isomerases. Biochemistry. 1996;35:792–802. doi: 10.1021/bi951732k. - DOI - PubMed
    1. Sugimoto H, Suzuki M, Nakagawa A, Tanaka I, Nishihira J. Crystal structure of macrophage migration inhibitory factor from human lymphocyte at 2.1 A resolution. FEBS Lett. 1996;389:145–148. doi: 10.1016/0014-5793(96)00553-4. - DOI - PubMed
    1. Sun HW, Bernhagen J, Bucala R, Lolis E. Crystal structure at 2.6-A resolution of human macrophage migration inhibitory factor. Proc. Natl. Acad. Sci. USA. 1996;93:5191–5196. doi: 10.1073/pnas.93.11.5191. - DOI - PMC - PubMed

Publication types

Substances