

MicroRNA-7450 regulates non-thermal plasma-induced chicken Sertoli cell apoptosis via adenosine monophosphate-activated protein kinase activation
- PMID: 29884805
- PMCID: PMC5993736
- DOI: 10.1038/s41598-018-27123-8
MicroRNA-7450 regulates non-thermal plasma-induced chicken Sertoli cell apoptosis via adenosine monophosphate-activated protein kinase activation
Abstract
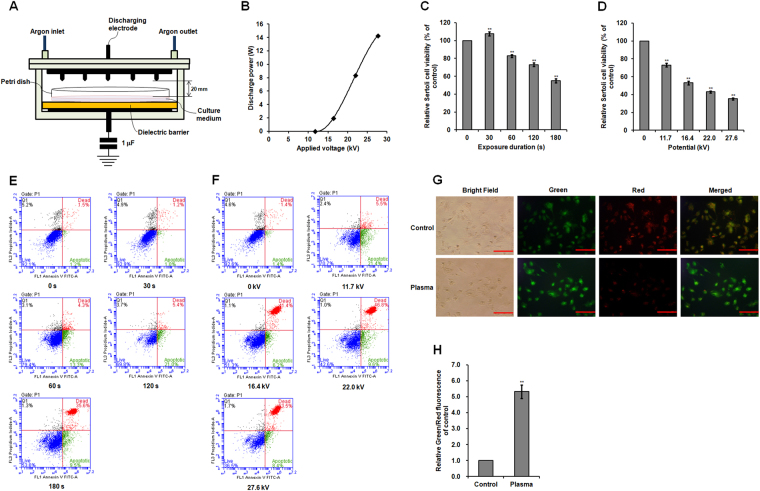
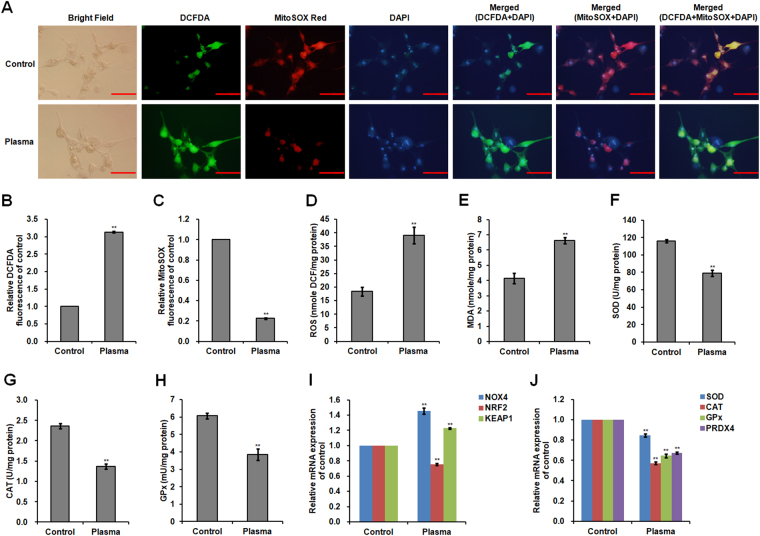
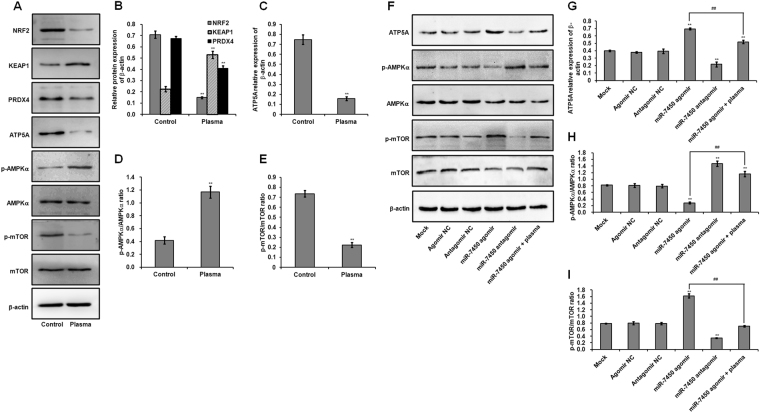
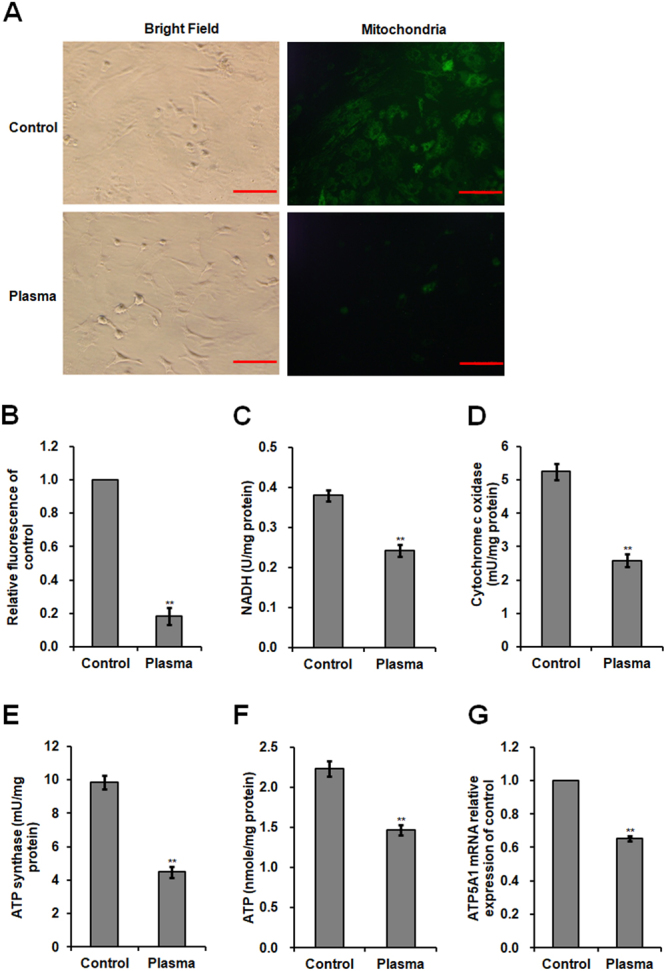
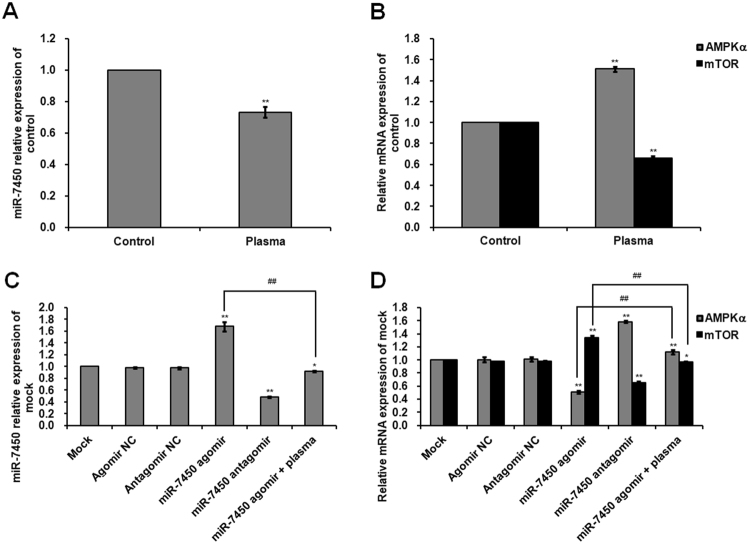
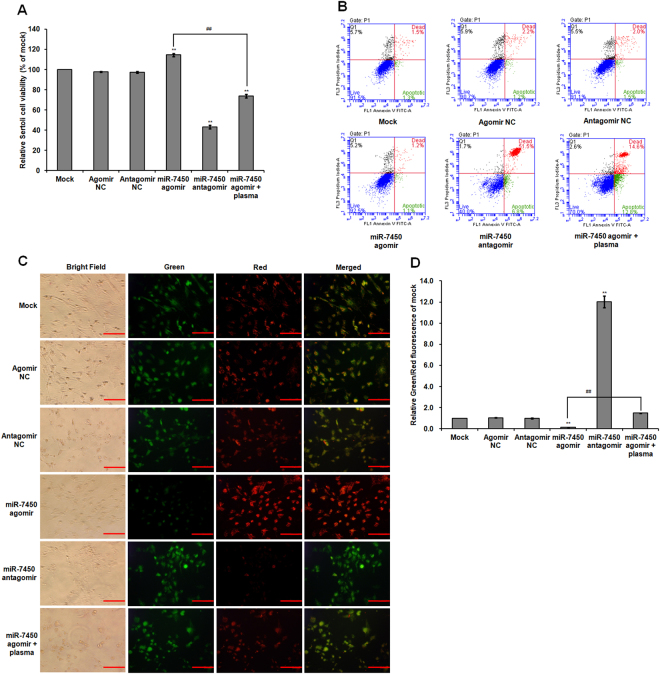
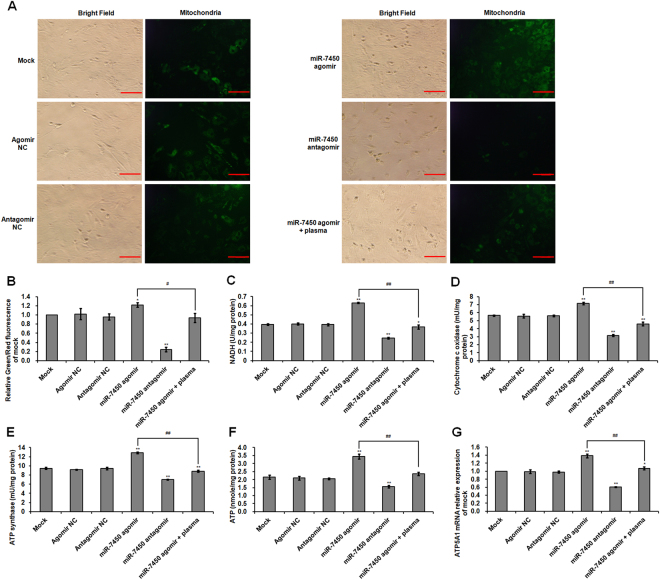
Non-thermal plasma treatment is an emerging innovative technique with a wide range of biological applications. This study was conducted to investigate the effect of a non-thermal dielectric barrier discharge plasma technique on immature chicken Sertoli cell (SC) viability and the regulatory role of microRNA (miR)-7450. Results showed that plasma treatment increased SC apoptosis in a time- and dose-dependent manner. Plasma-induced SC apoptosis possibly resulted from the excess production of reactive oxygen species via the suppression of antioxidant defense systems and decreased cellular energy metabolism through the inhibition of adenosine triphosphate (ATP) release and respiratory enzyme activity in the mitochondria. In addition, plasma treatment downregulated miR-7450 expression and activated adenosine monophosphate-activated protein kinase α (AMPKα), which further inhibited mammalian target of rapamycin (mTOR) phosphorylation in SCs. A single-stranded synthetic miR-7450 antagomir disrupted mitochondrial membrane potential and decreased ATP level and mTOR phosphorylation by targeting the activation of AMPKα, which resulted in significant increases in SC lethality. A double-stranded synthetic miR-7450 agomir produced opposite effects on these parameters and ameliorated plasma-mediated apoptotic effects on SCs. Our findings suggest that miR-7450 is involved in the regulation of plasma-induced SC apoptosis through the activation of AMPKα and the further inhibition of mTOR signaling pathway.
Conflict of interest statement
The authors declare no competing interests.
Figures
Similar articles
-
MicroRNA-1285 Regulates 17β-Estradiol-Inhibited Immature Boar Sertoli Cell Proliferation via Adenosine Monophosphate-Activated Protein Kinase Activation.Endocrinology. 2015 Nov;156(11):4059-70. doi: 10.1210/en.2014-1982. Epub 2015 Aug 19. Endocrinology. 2015. PMID: 26287402
-
Estradiol ameliorates metformin-inhibited Sertoli cell proliferation via AMPK/TSC2/mTOR signaling pathway.Theriogenology. 2021 Nov;175:7-22. doi: 10.1016/j.theriogenology.2021.08.030. Epub 2021 Aug 28. Theriogenology. 2021. PMID: 34481229
-
AMPK regulates immature boar Sertoli cell proliferation through affecting CDK4/Cyclin D3 pathway and mitochondrial function.Theriogenology. 2024 Aug;224:9-18. doi: 10.1016/j.theriogenology.2024.05.004. Epub 2024 May 4. Theriogenology. 2024. PMID: 38714024
-
Diabetes abolish cardioprotective effects of remote ischemic conditioning: evidences and possible mechanisms.J Physiol Biochem. 2019 Feb;75(1):19-28. doi: 10.1007/s13105-019-00664-w. Epub 2019 Feb 7. J Physiol Biochem. 2019. PMID: 30729392 Review.
-
Abnormal energy metabolism in the pathogenesis of systemic lupus erythematosus.Int Immunopharmacol. 2024 Jun 15;134:112149. doi: 10.1016/j.intimp.2024.112149. Epub 2024 Apr 30. Int Immunopharmacol. 2024. PMID: 38692019 Review.
Cited by
-
An Innovative Therapeutic Option for the Treatment of Skeletal Sarcomas: Elimination of Osteo- and Ewing's Sarcoma Cells Using Physical Gas Plasma.Int J Mol Sci. 2020 Jun 23;21(12):4460. doi: 10.3390/ijms21124460. Int J Mol Sci. 2020. PMID: 32585948 Free PMC article.
-
microRNA as an Important Mediator in the Regulation of Male Gallus gallus domesticus Reproduction: Current State of the Problem.Int J Mol Sci. 2024 Dec 26;26(1):112. doi: 10.3390/ijms26010112. Int J Mol Sci. 2024. PMID: 39795968 Free PMC article. Review.
-
Potential Applications of Non-thermal Plasma in Animal Husbandry to Improve Infrastructure.In Vivo. 2019 Jul-Aug;33(4):999-1010. doi: 10.21873/invivo.11569. In Vivo. 2019. PMID: 31280188 Free PMC article. Review.
-
Effects of non-thermal atmospheric plasma on protein.J Clin Biochem Nutr. 2022 Nov;71(3):173-184. doi: 10.3164/jcbn.22-17. Epub 2022 Sep 28. J Clin Biochem Nutr. 2022. PMID: 36447493 Free PMC article.
-
Demethylation and microRNA differential expression regulate plasma-induced improvement of chicken sperm quality.Sci Rep. 2019 Jun 20;9(1):8865. doi: 10.1038/s41598-019-45087-1. Sci Rep. 2019. PMID: 31222092 Free PMC article.
References
-
- von Woedtke T, Reuter S, Masur K, Weltmann KD. Plasmas for medicine. Physics Reports. 2013;530:291–320. doi: 10.1016/j.physrep.2013.05.005. - DOI
-
- Lunov O, et al. Towards the understanding of non-thermal air plasma action: effects on bacteria and fibroblasts. RSC Advances. 2016;6:25286–25292. doi: 10.1039/C6RA02368A. - DOI
-
- von Woedtke T, Metelmann HR, Weltmann KD. Clinical plasma medicine: state and perspectives of in vivo application of cold atmospheric plasma. Contributions to Plasma Physics. 2014;54:104–117. doi: 10.1002/ctpp.201310068. - DOI
Publication types
MeSH terms
Substances
LinkOut - more resources
Full Text Sources
Other Literature Sources
Miscellaneous
