. 2018 Jun 8;9(1):2229.
doi: 10.1038/s41467-018-04574-1.

Corticosteroid suppression of antiviral immunity increases bacterial loads and mucus production in COPD exacerbations

Affiliations

Corticosteroid suppression of antiviral immunity increases bacterial loads and mucus production in COPD exacerbations

Aran Singanayagam et al. Nat Commun. .

Abstract

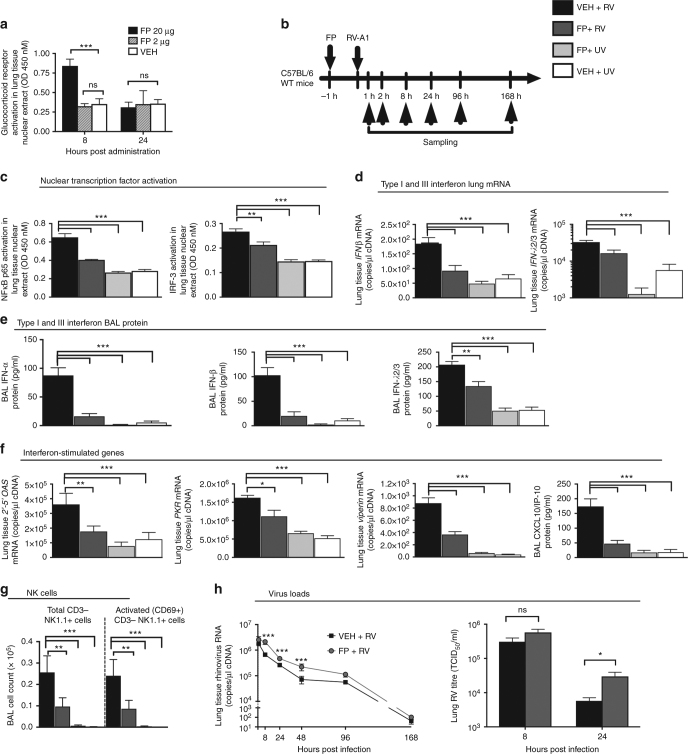
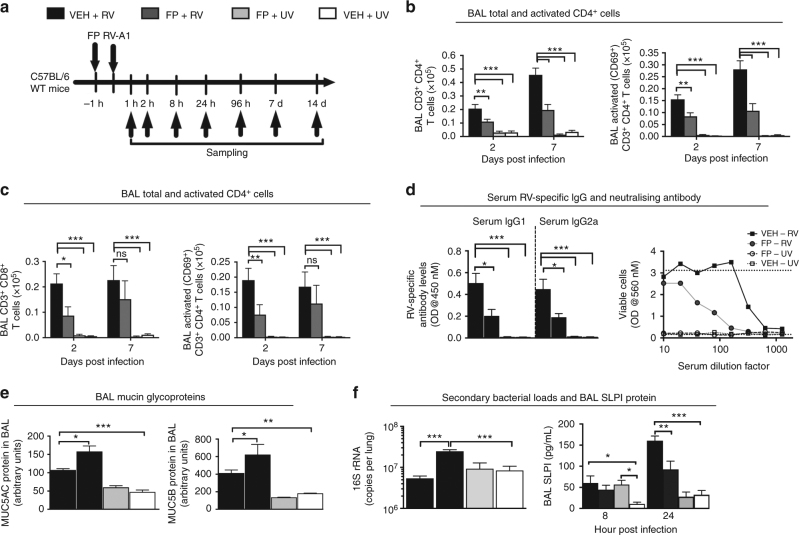
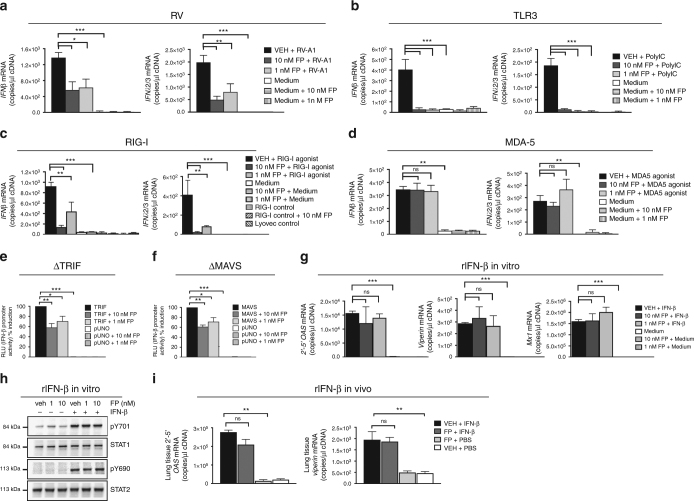
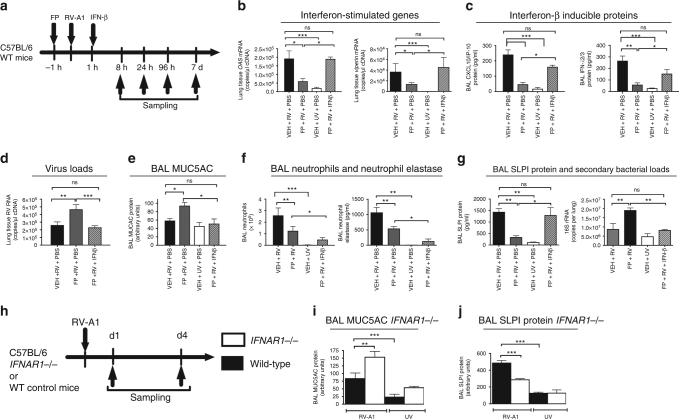
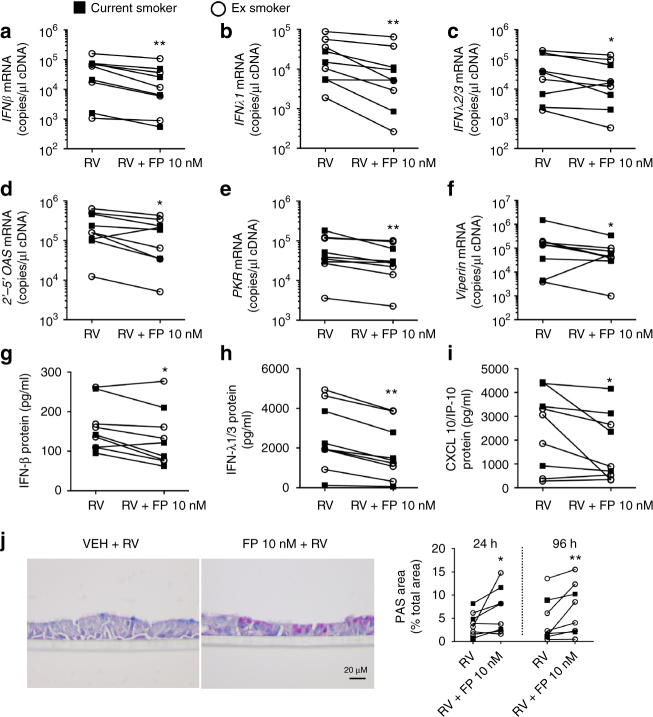
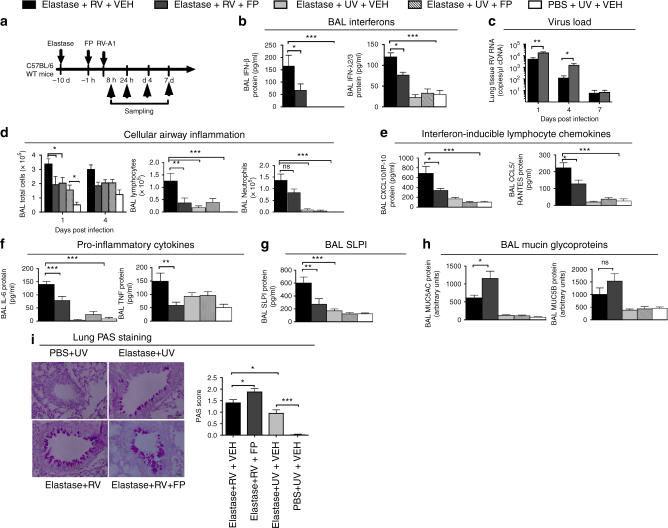
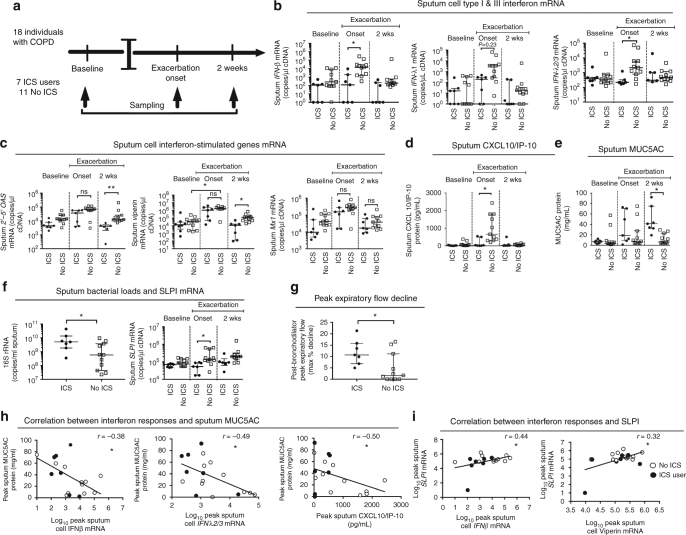
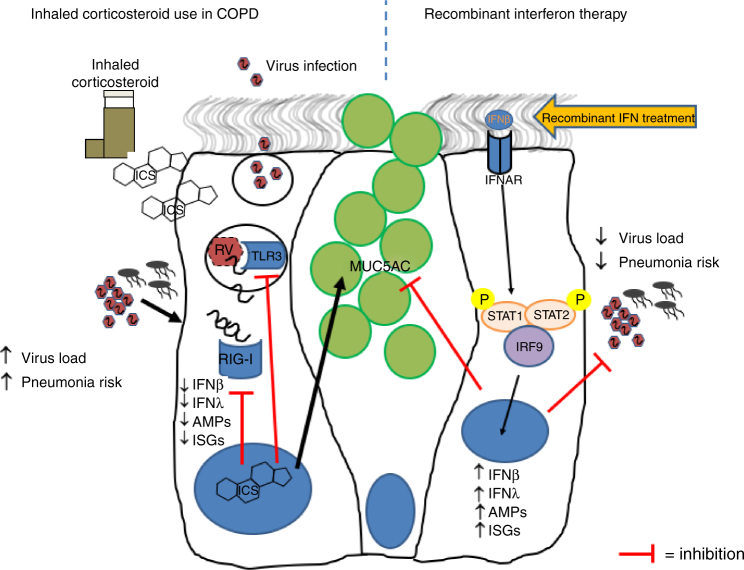
Inhaled corticosteroids (ICS) have limited efficacy in reducing chronic obstructive pulmonary disease (COPD) exacerbations and increase pneumonia risk, through unknown mechanisms. Rhinoviruses precipitate most exacerbations and increase susceptibility to secondary bacterial infections. Here, we show that the ICS fluticasone propionate (FP) impairs innate and acquired antiviral immune responses leading to delayed virus clearance and previously unrecognised adverse effects of enhanced mucus, impaired antimicrobial peptide secretion and increased pulmonary bacterial load during virus-induced exacerbations. Exogenous interferon-β reverses these effects. FP suppression of interferon may occur through inhibition of TLR3- and RIG-I virus-sensing pathways. Mice deficient in the type I interferon-α/β receptor (IFNAR1-/-) have suppressed antimicrobial peptide and enhanced mucin responses to rhinovirus infection. This study identifies type I interferon as a central regulator of antibacterial immunity and mucus production. Suppression of interferon by ICS during virus-induced COPD exacerbations likely mediates pneumonia risk and raises suggestion that inhaled interferon-β therapy may protect.


Conflict of interest statement

S.L.J. has personally received consultancy fees from Myelo Therapeutics GmbH, Concert Pharmaceuticals, Bayer, and Sanofi Pasteura, and Aviragen; he and his institution received consultancy fees from Synairgen, Novarits, Boehringer Ingelheim, Chiesi, GlaxoSmithKline, and Centocor. S.L.J. is an inventor on patents on the use of inhaled interferons for treatment of exacerbations of airway diseases. M.A.C. was employed by Chiesi Pharmaceuticals from January 2015 to November 2017. The remaining authors declare no competing interests.

Figures

Fig. 1
Fig. 1
Fluticasone propionate suppresses innate antiviral immune responses and delays virus clearance in mice. a C57BL/6 mice were treated intranasally with fluticasone propionate (20 or 2 μg) or vehicle DMSO control. Glucocorticoid receptor activation in lung tissue was assessed by measuring nuclear DNA binding by ELISA. b C57BL/6 mice were treated intranasally with fluticasone propionate (20 μg) or vehicle DMSO control and challenged intranasally with rhinovirus (RV)-A1 or UV-inactivated RV-A1 (UV). c NFkB P65 subunit (8 h) and IRF-3 (2 h) activation in lung tissue was assessed by measuring nuclear DNA binding by ELISA. d IFNβ and IFNλ2/3 mRNAs in lung tissue at 8 h post infection were measured by quantitative PCR. e IFN-α, IFN-β and IFN-λ2/3 proteins in bronchoalveolar lavage (BAL) at 24 h post infection were measured by ELISA. f Interferon-stimulated genes 2′–5′ OAS, PKR and Viperin mRNAs in lung tissue at 8 h post infection were measured by quantitative PCR. g BAL cells were stained for CD3 and the NK cell marker NK1.1 and additionally for the early activation marker CD69 and analysed by flow cytometry. BAL CD3 NK1.1+ cell numbers and BAL CD3 NK1.1+ CD69+ cell numbers were enumerated at day 2 post infection. h Rhinovirus RNA copies in lung tissue were measured by Taqman quantitative PCR and infectious virus in lung tissue was measured by titration in HeLa cells. Data represents mean (±SEM) of five–eight mice per treatment group, representative of at least two independent experiments. Data were analysed by one- or two-way ANOVA with Bonferroni post test. ns non-significant. *p < 0.05, **p < 0.01, ***p < 0.001
Fig. 2
Fig. 2
Fluticasone propionate suppresses acquired responses and augments mucin production and bacterial loads in mice. a C57BL/6 mice were treated intranasally with fluticasone propionate (20 μg) or vehicle DMSO control and challenged intranasally with rhinovirus (RV)-A1 or UV-inactivated RV-A1. b, c BAL cells were stained with antibodies specific for CD3, CD4, CD8 and CD69 and analysed by flow cytometry. b BAL CD3+ CD4+ T cell numbers and BAL CD3+ CD4+ CD69+ T cell numbers at day 7 post infection. c BAL CD3+ CD8+ T cell numbers and BAL CD3+ CD8+ CD69+ T cell numbers at day 2 post infection were evaluated. d Peripheral blood was harvested at day 14 post infection. RV-specific IgG1 and RV-specific IgG2A were quantified in serum by ELISA. Sera were assayed for their ability to prevent cytopathic effect caused by the same RV serotype used for in vivo challenge. Cytopathic effect was quantified by crystal violet staining. Top dotted line: serum only, (uninfected) controls. Bottom dotted line: virus infected (no serum) control. e MUC5AC and MUC5B proteins in BAL at day 7 post infection were measured by ELISA. f Bacterial copy number of 16S rRNA in lung tissue at 96 h was measured by quantitative PCR. Secretory leucocyte protease inhibitor (SLPI) protein in BAL was measured by ELISA. In all figures except d (right), data represents mean (±SEM) of five–eight mice per treatment group, representative of at least two independent experiments. Data were analysed by one- or two-way ANOVA with Bonferroni post test. ns non-significant; *p < 0.05, **p < 0.01, ***p < 0.001. In d (right), data points represent sera pooled from five mice per group, representative of two independent experiments
Fig. 3
Fig. 3
Fluticasone propionate suppresses TLR3 and RIG-I-induced interferon responses but does not block type I IFN signalling. ad BEAS-2B cells were treated with fluticasone propionate at 1 and 10 nM concentrations and stimulated with rhinovirus-A1 or receptor-specific agonists. Cell lysates were collected at 24 h post stimulation. a IFNβ and IFNλ2/3 mRNA expression following RV-A1 stimulation was measured by quantitative PCR. b IFNβ and IFNλ2/3 mRNA expression following poly(I:C) stimulation was measured by quantitative PCR. c IFNβ and IFNλ2/3 mRNA expression following RIG-I agonist (transfected 5′ppp-dsRNA) stimulation was measured by quantitative PCR. Transfected dsRNA lacking the 5′ triphosphate was used as a ‘RIG-I control’. d IFNβ and IFNλ2/3 mRNA expression following MDA-5 agonist (transfected HMW Poly(I:C) directly pre-coupled to the transfection reagent LyoVec) stimulation was measured by quantitative PCR. LyoVec without Poly(I:C) (LyoVec control) was used as a control for transfection. e, f BEAS-2B cells were transfected with interferon-β promoter–reporter constructs together with ΔTRIF, ΔMAVS or vector control (pUNO1) and then treated with fluticasone propionate (FP) 1 or 10 nM or medium control 3 h later. Cells were collected 24 h later and relative light units (RLU) were determined. e IFNβ promoter activity following transfection with ΔTRIF. f IFNβ promoter activity following transfection with ΔMAVS. g, h BEAS-2B cells were treated with fluticasone propionate at 1 and 10 nM concentrations and stimulated with recombinant IFN-β. g 2′–5OAS, viperin and MX1 mRNA expression at 24 h post stimulation was measured by quantitative PCR. h Cell extracts were collected at 1 h post stimulation and analysed by western blotting with antibodies to pSTAT1 Y701, STAT1, pSTAT2 Y690 and STAT2. In ag, data represent mean (±SEM) comprising three independent experiments, analysed by one-way ANOVA with Bonferroni post test. ns non-significant. *p < 0.05, **p < 0.01, ***p < 0.001. In h, data shown are representative of results from three independent experiments. i C57BL/6 mice were treated intranasally with fluticasone propionate (20 μg) or vehicle DMSO control and additionally with recombinant 104 units IFN-β. Interferon-stimulated genes 2′-5OAS, and Viperin mRNAs in lung tissue at 8 h post infection were measured by quantitative PCR. Data represents mean (±SEM) of five mice per treatment group, representative of at least two independent experiments. Data were analysed by one-way ANOVA with Bonferroni post test. ns non-significant. *p < 0.05, **p < 0.01, ***p < 0.001
Fig. 4
Fig. 4
Type I IFN augments antimicrobial responses and suppresses MUC5AC and bacterial loads. a C57BL/6 mice were treated intranasally with fluticasone propionate (20 μg) or vehicle DMSO control and challenged intranasally with rhinovirus (RV)-A1 or UV-inactivated RV-A1 (UV). One hour after RV challenge, mice were additionally treated intranasally with 104 units recombinant IFN-β or PBS control. b 2′–5′ OAS and viperin mRNAs in lung tissue were measured by quantitative PCR at 8 h post infection. c CXCL10/IP-10 and IFN-λ2/3 proteins were measured in bronchoalveolar lavage (BAL) by ELISA at 24 h post infection. d RV RNA copies in lung tissue were measured by quantitative PCR at 24 h post infection. e MUC5AC protein in BAL was measured by ELISA at day 7 post infection. f BAL neutrophils were enumerated by cytospin assay and neutrophil elastase protein was measured in BAL by ELISA at 8 h post infection. g Secretory leucocyte protease inhibitor (SLPI) protein in bronchoalveolar lavage (BAL) at 24 h post infection was measured by ELISA. 16S rRNA copies in lung tissue were measured by quantitative PCR at 96 h post infection. h Wild-type or IFNAR1−/− C57BL/6 mice were challenged intranasally with rhinovirus (RV)-A1 or UV-inactivated RV-A1 (UV). i MUC5AC protein at day 4 and j secretory leucocyte protease inhibitor (SLPI) protein at day 1 post infection was measured in BAL by ELISA. Data represents mean (±SEM) of five–eight mice per treatment group, representative of at least two independent experiments. Data were analysed by one-way ANOVA with Bonferroni post test. ns non-significant. *p < 0.05, **p < 0.01, ***p < 0.001
Fig. 5
Fig. 5
Fluticasone propionate impairs ex vivo antiviral immune responses and enhances mucus secretion in COPD cells. Primary airway epithelial cells (AECs) from nine patients with GOLD stage III COPD were cultured at the air–liquid interface and then treated in vitro with fluticasone propionate at 1 and 10 nM concentrations or vehicle control and infected with rhinovirus (RV)-A1. Cell lysates and supernatants were collected post infection. a IFNβ, b IFNλ1, c IFNλ2/3, d 2–5′ OAS, e PKR and f viperin mRNA expression in cell lysates at 48 h was measured by quantitative PCR. g IFN-β, h IFN-λ1/3 proteins at 96 h and i CXCL10/IP-10 protein at 72 h in cell supernatants were measured by ELISA. j AECs for eight patients were paraffin-embedded and stained with periodic acid-Schiff (PAS). Left: Representative images of cells treated with vehicle + RV and FP10 nM + RV are shown. Scale bars: 20 μm, Magnification, x400. Right: Scoring for PAS-positive mucus-producing cells at 24 and 96 h post infection. Data represents individual patients and analysed by Mann–Whitney U-test. *p < 0.05, **p < 0.01, ***p < 0.001
Fig. 6
Fig. 6
Fluticasone propionate impairs antiviral immunity and enhances mucus secretion in a mouse model of COPD exacerbation. a C57BL/6 mice were treated intranasally with a single dose of elastase or PBS as control. Ten days later, mice were treated intranasally with fluticasone propionate (20 μg) and challenged with rhinovirus (RV)-A1 or UV-inactivated RV-A1 (UV). b IFN-β and IFN-λ2/3 proteins were measured in bronchoalveolar lavage (BAL) by ELISA at 24 h post infection. c Rhinovirus RNA copies in lung tissue were measured by quantitative PCR. d Total cell numbers at days 1 and 4, lymphocyte numbers at day 4 and neutrophil numbers at day 1 post infection in BAL were enumerated by cytospin assay. e CXCL10/IP-10 and CCL5/RANTES proteins at 24 h and f IL-6 and TNF proteins at 8 h post infection were measured in BAL by ELISA. g Secretory leucocyte protease inhibitor (SLPI) protein at 24 h and h MUC5AC and MUC5B proteins at day 7 post infection were measured in BAL by ELISA. i At day 4 after RV challenge, lungs were formalin-fixed, paraffin-embedded and stained with periodic acid-Schiff (PAS). Left: Representative images of mice treated with PBS + UV, elastase + UV, elastase + RV and elastase + RV + FP are shown. Scale bars: 50 μm, Magnification, ×400. Right: Scoring for PAS-positive mucus-producing cells. Data represent mean (±SEM) of five–eight mice per treatment group, representative of at least two independent experiments. Data were analysed by one- or two-way ANOVA with Bonferroni post test. ns non-significant. *p < 0.05, **p < 0.01, ***p < 0.001
Fig. 7
Fig. 7
Inhaled corticosteroid use is associated with adverse effects during virus-induced COPD exacerbations. a Patients with COPD were monitored prospectively. Sputum samples were taken during stable state (baseline), at presentation with exacerbation associated with positive virus detection and 2 weeks during exacerbation. b IFNβ, IFNλ1 and IFNλ2/3 and c 2–5OAS, viperin and Mx1 mRNA expression in sputum cells was measured by quantitative PCR. d CXCL10/IP-10 protein, e MUC5AC protein was measured in sputum supernatants by ELISA. f Bacterial copy number of 16S rRNA in sputum at 2 weeks was measured by quantitative PCR. SLPI mRNA expression in sputum cells was measured by quantitative PCR. g Maximum post-bronchodilator peak expiratory flow rate % decline from baseline during exacerbation. h Correlation between peak sputum cell IFNβ IFNλ2/3 mRNA expression and sputum CXCL10/IP-10 protein concentrations with peak sputum MUC5AC protein. i Correlation between peak sputum cell IFNβ and Viperin mRNAs expression with sputum cell SLPI mRNA expression. In bg, data represent median (±IQR) per group. In be and f (right panel), data were analysed by Kruskal–Wallis test with Dunn’s post test. In f (left panel) and g, data were analysed by Mann–Whitney U-test. In h, i, correlation analysis used was non-parametric (Spearman’s correlation) performed on ICS users and ICS non-users pooled into a single group. ns non-significant; *p < 0.05; **p < 0.01, ***p < 0.001
Fig. 8
Fig. 8
Schematic representation showing proposed adverse consequences of inhaled corticosteroid use during exacerbations. ICS use impairs type I interferon (IFN) production through effects on TLR3 and RIG-I virus-sensing pathways. Suppressed IFN leads to delayed virus clearance, mucus hypersecretion, deficient antimicrobial peptide responses and increased bacterial loads thereby increasing risk of secondary bacterial pneumonia. Use of recombinant IFN-β therapy bypasses this blockade and restores interferon responses, antimicrobial immunity and reduces mucus secretion, potentially leading to reduced exacerbation severity and lessened risk of pneumonia in COPD

References

    1. Mallia P, et al. Experimental rhinovirus infection as a human model of chronic obstructive pulmonary disease exacerbation. Am. J. Respir. Crit. Care Med. 2011;183:734–742. doi: 10.1164/rccm.201006-0833OC. - DOI - PMC - PubMed
    1. Message SD, et al. Rhinovirus-induced lower respiratory illness is increased in asthma and related to virus load and Th1/2 cytokine and IL-10 production. Proc. Natl Acad. Sci. USA. 2008;105:13562–13567. doi: 10.1073/pnas.0804181105. - DOI - PMC - PubMed
    1. Jackson DJ, et al. IL-33-dependent type 2 inflammation during rhinovirus-induced asthma exacerbations in vivo. Am. J. Respir. Crit. Care Med. 2014;190:1373–1382. doi: 10.1164/rccm.201406-1039OC. - DOI - PMC - PubMed
    1. Sykes A, et al. Rhinovirus 16-induced IFN-alpha and IFN-beta are deficient in bronchoalveolar lavage cells in asthmatic patients. J. Allergy Clin. Immunol. 2012;129:1506–1514 e1506. doi: 10.1016/j.jaci.2012.03.044. - DOI - PubMed
    1. Wark PA, et al. Asthmatic bronchial epithelial cells have a deficient innate immune response to infection with rhinovirus. J. Exp. Med. 2005;201:937–947. doi: 10.1084/jem.20041901. - DOI - PMC - PubMed

Publication types

MeSH terms