. 2018 Jun 8;9(1):2222.
doi: 10.1038/s41467-018-03763-2.

Phylodynamic assessment of intervention strategies for the West African Ebola virus outbreak

Affiliations

Phylodynamic assessment of intervention strategies for the West African Ebola virus outbreak

Simon Dellicour et al. Nat Commun. .

Abstract

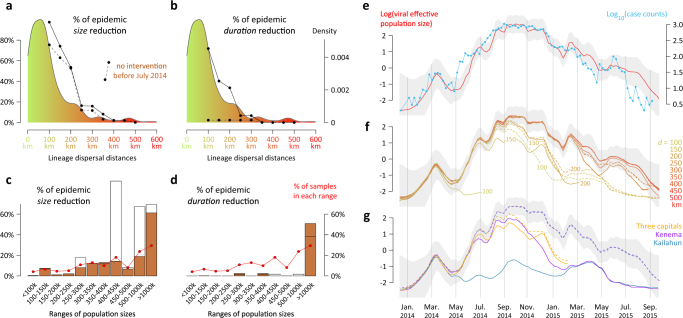
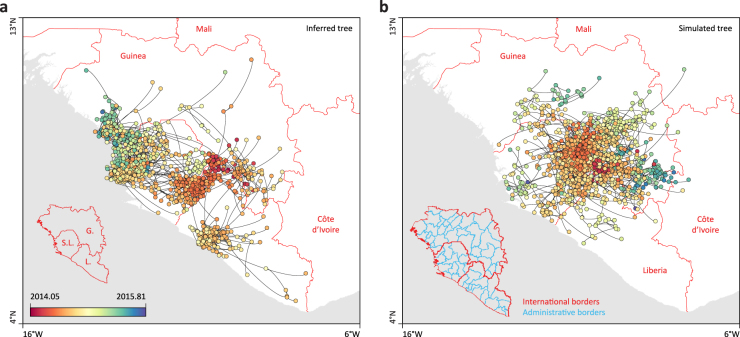
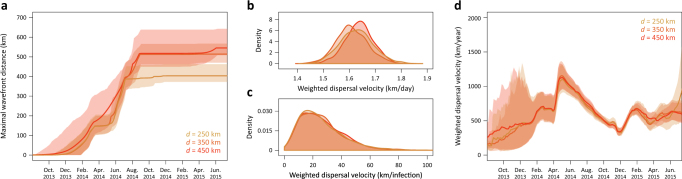
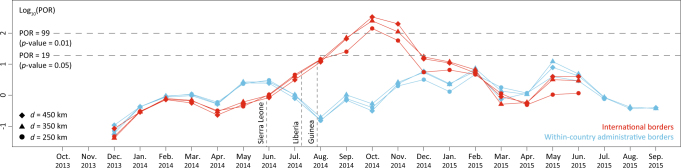
Genetic analyses have provided important insights into Ebola virus spread during the recent West African outbreak, but their implications for specific intervention scenarios remain unclear. Here, we address this issue using a collection of phylodynamic approaches. We show that long-distance dispersal events were not crucial for epidemic expansion and that preventing viral lineage movement to any given administrative area would, in most cases, have had little impact. However, major urban areas were critical in attracting and disseminating the virus: preventing viral lineage movement to all three capitals simultaneously would have contained epidemic size to one-third. We also show that announcements of border closures were followed by a significant but transient effect on international virus dispersal. By quantifying the hypothetical impact of different intervention strategies, as well as the impact of barriers on dispersal frequency, our study illustrates how phylodynamic analyses can help to address specific epidemiological and outbreak control questions.


Conflict of interest statement

The authors declare no competing interests.

Figures

Fig. 1
Fig. 1
Hypothetical impact of intervention strategies. a, b Reductions in epidemic size and duration following the prevention of dispersal over a range of distances between administrative areas. These quantities are summarised as the percentages by which phylogenetic tree length and height are reduced when the phylogeny is pruned at all the branches that accommodate such dispersal events (full lines). The dashed lines represent the corresponding reductions when the dispersal events are prevented only after June 2014. These curves are superimposed on the distribution of lineage dispersal distances summarised from the posterior Markov jump history (coloured from green to red). c, d Reductions in epidemic size and duration following the prevention of dispersal to administrative areas belonging to a specific population sizes range. These percentage reductions are also obtained by pruning the phylogeny, but now at all branches that accommodate dispersal events to the relevant administrative areas (white histogram bars). The brown histogram bars represent the corresponding reductions when the dispersal events are prevented only after June 2014. We refer to Supplementary Fig. 1 for credible intervals associated with percentages of epidemic size/duration reductions reported in Fig. 1a–d. All the reductions in tree length and height were computed by conditioning the pruning on movement events recorded in the MCC (maximum clade credibility) tree summary of the discrete phylogeographic reconstruction. Supplementary Fig. 2 summarises the equivalent results for pruning trees using the Markov jump histories associated with each posterior tree. e Estimates of viral population size (in red; 95% HPD in grey) and the time series of case counts (in blue). f Impact of preventing long-distance dispersal events on viral effective population size through time. As in Fig. 1e, the 95% HPD of viral population size based on the entire dataset (no intervention strategy) is displayed in grey. On this graph, dashed lines correspond to viral population size evolution when transmission is prevented only after June 2014. g This plot corresponds to Fig. 1f but focuses on the impact of preventing dispersal events to specific locations on viral effective population size through time
Fig. 2
Fig. 2
Example of a continuous phylogeographic estimate and corresponding simulation. Example of a phylogeographic estimate in continuous space (a) and the corresponding posterior predictive simulation unaware of international borders (b). In both cases, phylogenetic branches are represented by black curves connecting phylogenetic nodes displayed as dots coloured according to their time of occurrence. In a, these nodes are positioned according to the mean latitude and longitude estimates obtained by phylogeographic inference, while in b they are positioned according to simulations based on the estimated parameters of the phylogeographic process. Map background was made in R and based on international borders obtained from the Global Administrative Areas database (GADM, www.gadm.org)
Fig. 3
Fig. 3
Dispersal statistics summarised from continuous phylogeographic inference. Evolution of maximal wavefront distance (a), mean dispersal velocity (b, c) and dispersal velocity through time (d) for each data set (d = 250, 350 and 450 km). These statistics were summarised from 1000 trees sampled from the posterior distribution of trees. Weighted dispersal velocities are reported in both km per day (b) and in km per infection (c). Weighted dispersal velocities in km per infection are obtained by multiplying mean branch velocities (in km/day) by serial interval values (in days between successive infections) randomly drawn from the generation time distribution estimated by the WHO Ebola Response Team (2014)
Fig. 4
Fig. 4
Analysis of the monthly impact of inter- and intra-national borders on the EBOV dispersal frequency. The plot depicts the predictive odds ratio (POR) estimates per month and per data set (d = 250, 350 and 450 km). POR estimates for within-country administrative borders are also included as a negative control as we do not expect any significant impact of within-country administrative borders on dispersal frequency. PORs >3 and >20 can be considered as ‘positive’ and ‘strong’ evidence for the impact of borders on the dispersal frequency, and PORs >19 and >99 correspond to posterior predictive p-values <0.05 and <0.01, respectively. Vertical-dashed lines indicate the time at which Sierra Leone, Liberia and Guinea announced their border closures. See Supplementary Fig. 4 for a more detailed representation of the monthly differences in crossing border events between inferred and simulated diffusion processes

References

    1. Baize S, et al. Emergence of Zaire Ebola virus disease in Guinea. N. Engl. J. Med. 2014;371:1418–1425. doi: 10.1056/NEJMoa1404505. - DOI - PubMed
    1. World Health Organization. Ebola Situation Report (WHO, http://apps.who.int/iris/bitstream/10665/208883/1/ebolasitrep_10Jun2016_... 2016).
    1. Woolhouse, M. E. J., Rambaut, A. & Kellam, P. Lessons from Ebola: improving infectious disease surveillance to inform outbreak management. Sci. Transl. Med. 7, 307rv5 (2015). - PMC - PubMed
    1. Blackwood JC, Childs LM. The role of interconnectivity in control of an Ebola epidemic. Sci. Rep. 2016;6:29262. doi: 10.1038/srep29262. - DOI - PMC - PubMed
    1. Lau MSY, et al. Spatial and temporal dynamics of superspreading events in the 2014–2015 West Africa Ebola epidemic. Proc. Natl Acad. Sci. USA. 2017;114:2337–2342. doi: 10.1073/pnas.1614595114. - DOI - PMC - PubMed

Publication types