. 2018 Jun 8;9(1):2237.
doi: 10.1038/s41467-018-04605-x.

Synergistic and low adverse effect cancer immunotherapy by immunogenic chemotherapy and locally expressed PD-L1 trap

Affiliations

Synergistic and low adverse effect cancer immunotherapy by immunogenic chemotherapy and locally expressed PD-L1 trap

Wantong Song et al. Nat Commun. .

Abstract

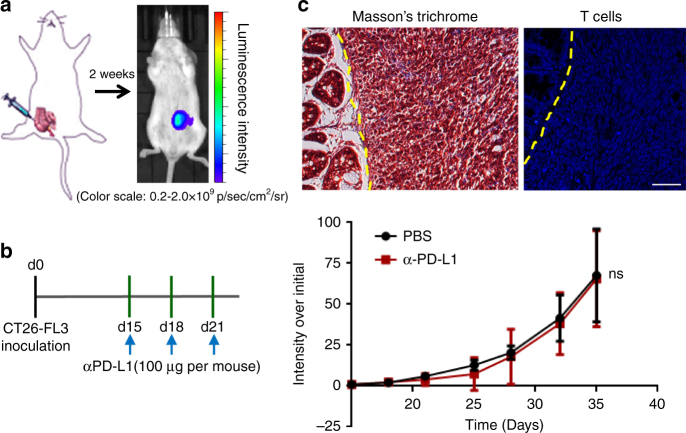
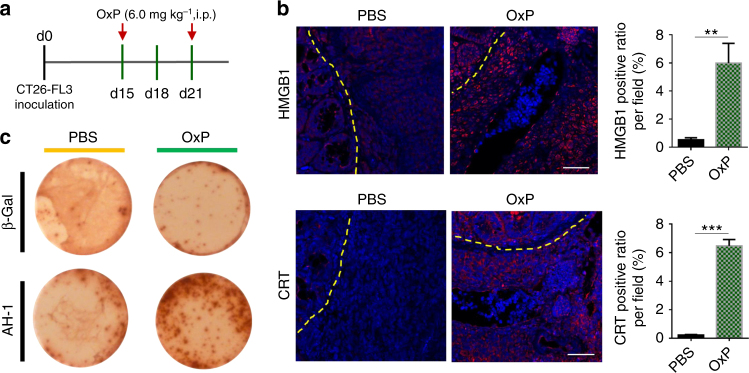
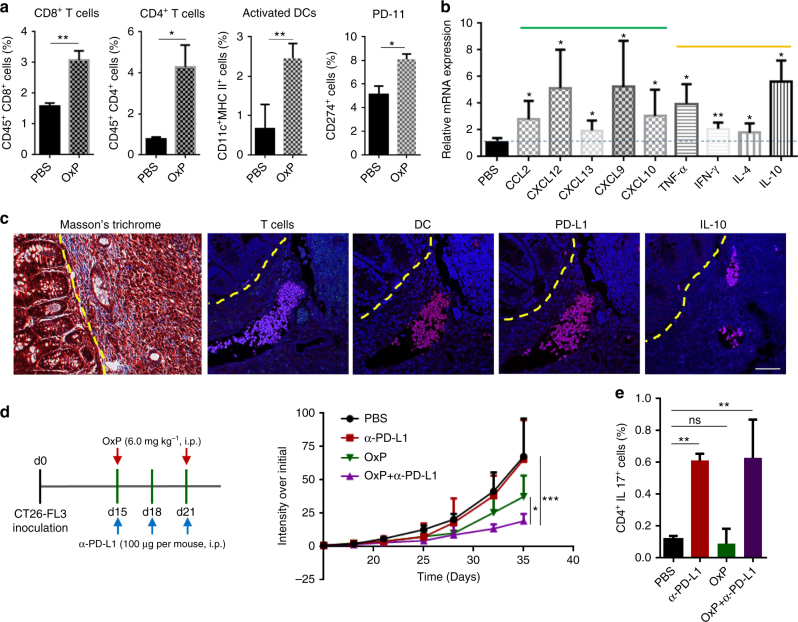
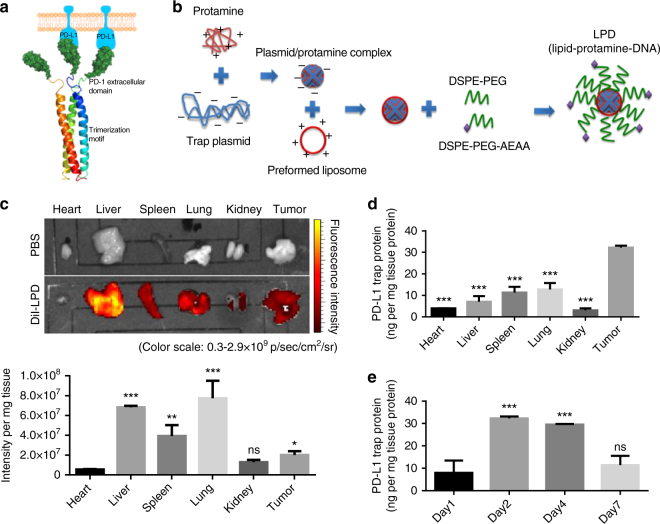
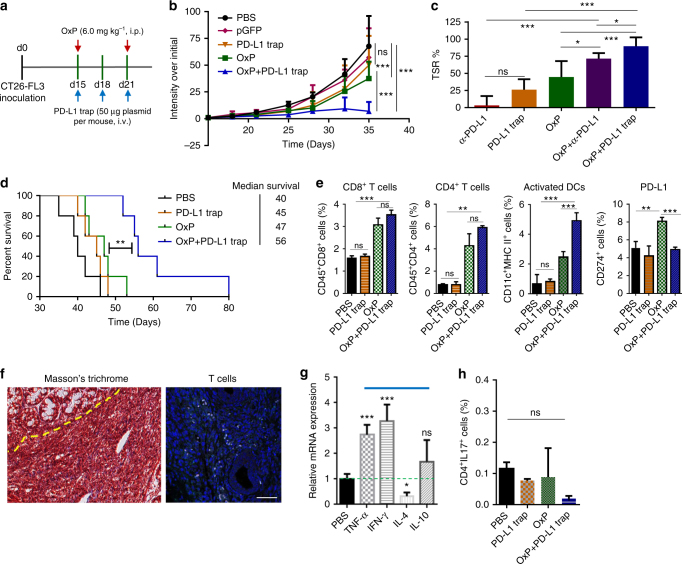
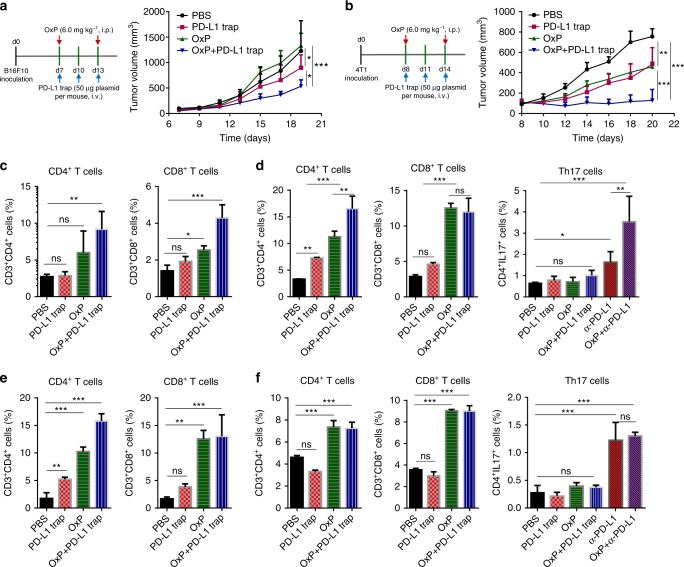
Although great success has been obtained in the clinic, the current immune checkpoint inhibitors still face two challenging problems: low response rate and immune-related adverse effects (irAEs). Here we report the combination of immunogenic chemotherapy and locally expressed PD-L1 trap fusion protein for efficacious and safe cancer immunotherapy. We demonstrate that oxaliplatin (OxP) boosts anti-PD-L1 mAb therapy against murine colorectal cancer. By design of a PD-L1 trap and loading its coding plasmid DNA into a lipid-protamine-DNA nanoparticle, PD-L1 trap is produced transiently and locally in the tumor microenvironment, and synergizes with OxP for tumor inhibition. Significantly, unlike the combination of OxP and anti-PD-L1 mAb, the combination of OxP and PD-L1 trap does not induce obvious Th17 cells accumulation in the spleen, indicating better tolerance and lower tendency to irAEs. The reports here may highlight the potential of applying PD-L1 inhibitor, especially locally expressed PD-L1 trap, in cancer therapy following OxP-based chemotherapy.


Conflict of interest statement

The trap technology has been licensed to OncoTrap Inc., L.H. and R.L. are co-founders. The remaining authors declare no competing interests.

Figures

Fig. 1
Fig. 1
Orthotopic CT26-FL3 tumor is resistant to anti-PD-L1 mAb therapy. a Establishment of orthotopic colorectal tumor models. CT26-FL3 (RFP/Luc) cells were inoculated into the mouse cecum wall, and the tumor burden was monitored by bioluminescent analysis. b Treatment scheme and tumor growth curves of orthotopic CT26-FL3 tumors in PBS and α-PD-L1 treated groups (n = 5 mice per group). c Masson’s trichrome and immunofluorescence staining of orthotopic CT26-FL3 tumor tissues in PBS group using 4′,6-diamidino-2-phenylindole (DAPI, blue) and anti-CD3 antibody (red). Yellow dotted line indicates the border between intestinal mucosa and the orthotopic tumor. Scale bar represents 50 μm. Significant differences were assessed in b using two-way ANOVA. Results are presented as mean (SD). ns, not significant
Fig. 2
Fig. 2
OxP induces ICD in the CT26-FL3 tumor. a OxP treatment scheme. b Immunofluorescence staining of orthotopic CT26-FL3 tumors after PBS and OxP treatment using DAPI (blue), anti-HMGB1 antibody (red), and anti-CRT antibody (red). Positive ratios were quantified in 5 randomly selected fields per mouse (n = 4 mice per group). Yellow dotted line indicates the border between intestinal mucosa and the orthotopic tumor. Scale bar represents 50 μm. c ELISpot test of the splenocytes of CT26-FL3 tumor-bearing mice after PBS and OxP treatment. Significant differences were assessed in b using t test. Results are presented as mean (SD). **P < 0.01, ***P < 0.001
Fig. 3
Fig. 3
OxP induces immune microenvironment changes and synergizes with α-PD-L1 in CT26-FL3 tumor therapy. a CD8+ T cells, CD4+ T cells, activated DCs and PD-L1 levels in tumors of the PBS and OxP-treated groups on day 28, analyzed by flow cytometry (n = 4). b Relative mRNA expressions of various cytokines in tumors of the OxP-treated group compared to PBS group on day 28, detected by quantitative RT-PCR (n = 4). c Masson’s trichrome and immunofluorescence staining of the orthotopic tumors after OxP treatment using DAPI (blue), anti-CD3 (red), anti-CD11c (red), anti-CD274 (red), and anti-IL-10 (red). Yellow dotted line indicates the border between intestinal mucosa and the orthotopic tumor. Scale bar represents 50 μm. d Treatment scheme and tumor growth curves of orthotopic CT26-FL3 tumors in PBS, α-PD-L1, OxP, and OxP + α-PD-L1 treated groups (n = 5 mice per group). e Th17 cell ratios in the splenocytes of the mice after various treatments on day 28 (n = 4). Significant differences were assessed in d using two-way ANOVA with multiple comparisons and in a, b, and e using t test. Results are presented as mean (SD). ns not significant. *P < 0.05, **P < 0.01, ***P < 0.001
Fig. 4
Fig. 4
Design of locally and transiently expressed PD-L1 trap. a Scheme showing the tribody interaction of PD-L1 trap protein. b Preparation scheme of PD-L1 trap plasmid loaded LPD. c Images and quantitative results of the DiI-loaded LPD in major organs and the CT26-FL3 tumor at 24 h after injection (n = 3). d PD-L1 trap protein expression in major organs and the CT26-FL3 tumor at 48 h after injection. The PD-L1 trap expression was measured using ELISA by targeting the His (6×)-tag engineered at the C-terminus of the PD-L1 trap (n = 3). e PD-L1 trap protein expression in tumors on days 1, 2, 4 and 7 after injection. Significant differences in c, d, and e were assessed using t test. Results are presented as mean (SD). ns, not significant. *P < 0.05, **P < 0.01, ***P < 0.001
Fig. 5
Fig. 5
Combination of OxP and LPD-PD-L1 trap gene therapy on orthotopic CT26-FL3 tumor model. a OxP and PD-L1 trap combination treatment scheme. b Tumor growth curves of orthotopic CT26-FL3 tumors in PBS, LPD-pGFP, PD-L1 trap, OxP and OxP+PD-L1 trap gene treated groups (n = 5 mice per group). c TSR% results on day 35. d Mice survival curves. e CD8+ T cells, CD4+ T cells, activated DCs and PD-L1 levels in tumors of mice after various treatments, analyzed by flow cytometry (n = 4). f Masson’s trichrome and immunofluorescence staining of the orthotopic tumors after OxP+PD-L1 trap treatment using DAPI (blue) and anti-CD3 (red). Yellow dotted line indicates the border between intestinal mucosa and the orthotopic tumor. Scale bar represents 50 μm. g Relative mRNA expressions of cytokines in tumors of the OxP+PD-L1 trap treated group compared to PBS group on day 28, detected by quantitative RT-PCR (n = 4). h Th17 cell ratios in the splenocytes of mice after various treatments on day 28 (n = 4). Significant differences were assessed in b using two-way ANOVA with multiple comparisons, in d using log rank test and in c, e, g, and h using t test. Results are presented as mean (SD). ns, not significant. *P < 0.05, **P < 0.01, ***P < 0.001
Fig. 6
Fig. 6
OxP and LPD-PD-L1 trap gene therapy on B16F10 and 4T1 tumor models. a Treatment scheme and tumor growth curves of B16F10 tumors in PBS, PD-L1 trap, OxP and OxP + PD-L1 trap treated groups (n = 5 mice per group). b Treatment scheme and tumor growth curves of 4T1 tumors in PBS, PD-L1 trap, OxP and OxP + PD-L1 trap treated groups (n = 5 mice per group). c CD4+ and CD8+ T cell ratios in the B16F10 tumors after various treatments, analyzed by flow cytometry (n = 4). d CD4+ T cell, CD8+ T cell and Th17 cell ratios in splenocytes of the B16F10 tumor-bearing mice after various treatments, analyzed by flow cytometry (n = 4). e CD4+ and CD8+ T cell ratios in the 4T1 tumors after various treatments, analyzed by flow cytometry (n = 4). f CD4+ T cell, CD8+ T cell and Th17 cell ratios in splenocytes of the 4T1 tumor-bearing mice after various treatments, analyzed by flow cytometry (n = 4). Significant differences were assessed in a and b using two-way ANOVA with multiple comparisons and in c, d, e, and f using t test. Results are presented as mean (SD). ns, not significant. *P < 0.05, **P < 0.01, ***P < 0.001
Fig. 7
Fig. 7
MSS colorectal cancer patient sample analysis. a Representative immunohistochemistry images of tumor tissues from MSS colorectal cancer patients. Untreated represents samples from patients without any therapy. XELOX represents samples from patients after XELOX neoadjuvant chemotherapy. Images are taken at ×40 magnification. Dark red circles indicate the hot spots in each visual field. b Statistics of hot spots in each visual field (n = 4 samples per group). c Representative immunofluorescence images of tumor tissues using DAPI (blue) and anti-CD3 (red). Yellow dotted line indicates the border between intestinal mucosa and the tumor. Scale bar represents 50 μm. d Statistics of CD3+ T cell ratios in each slice (n = 5 samples per group). Significant differences were assessed in b and d using t test. Results are presented as mean (SD). **P < 0.01, ***P < 0.001

References

    1. Le DT, et al. PD-1 blockade in tumors with mismatch-repair deficiency. N. Engl. J. Med. 2015;372:2509–2520. doi: 10.1056/NEJMoa1500596. - DOI - PMC - PubMed
    1. Yarchoan M, Johnson BA, 3rd, Lutz ER, Laheru DA, Jaffee EM. Targeting neoantigens to augment antitumour immunity. Nat. Rev. Cancer. 2017;17:209–222. doi: 10.1038/nrc.2016.154. - DOI - PMC - PubMed
    1. Kroemer G, Galluzzi L, Kepp O, Zitvogel L. Immunogenic cell death in cancer therapy. Annu. Rev. Immunol. 2013;31:51–72. doi: 10.1146/annurev-immunol-032712-100008. - DOI - PubMed
    1. Galluzzi L, Buque A, Kepp O, Zitvogel L, Kroemer G. Immunogenic cell death in cancer and infectious disease. Nat. Rev. Immunol. 2017;17:97–111. doi: 10.1038/nri.2016.107. - DOI - PubMed
    1. Griswold DP, Corbett TH. A colon tumor model for anticancer agent evaluation. Cancer. 1975;36:2441–2444. doi: 10.1002/1097-0142(197512)36:6<2441::AID-CNCR2820360627>3.0.CO;2-P. - DOI - PubMed

Publication types

MeSH terms