. 2018 Jun 8;8(1):8749.
doi: 10.1038/s41598-018-27059-z.

Optimized protocol for combined PALM-dSTORM imaging

Affiliations

Optimized protocol for combined PALM-dSTORM imaging

O Glushonkov et al. Sci Rep. .

Abstract

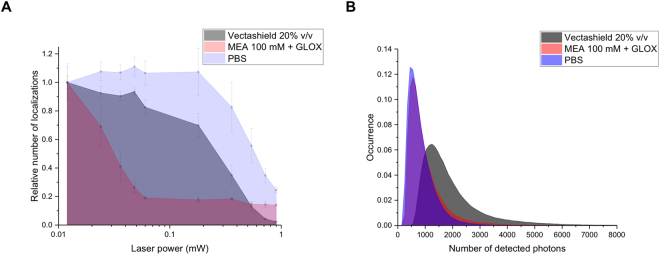
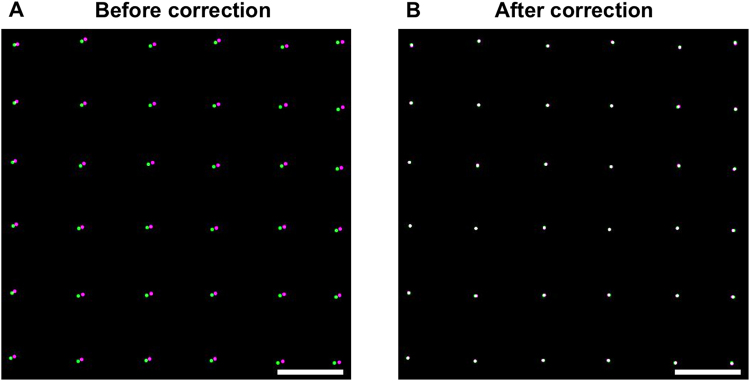
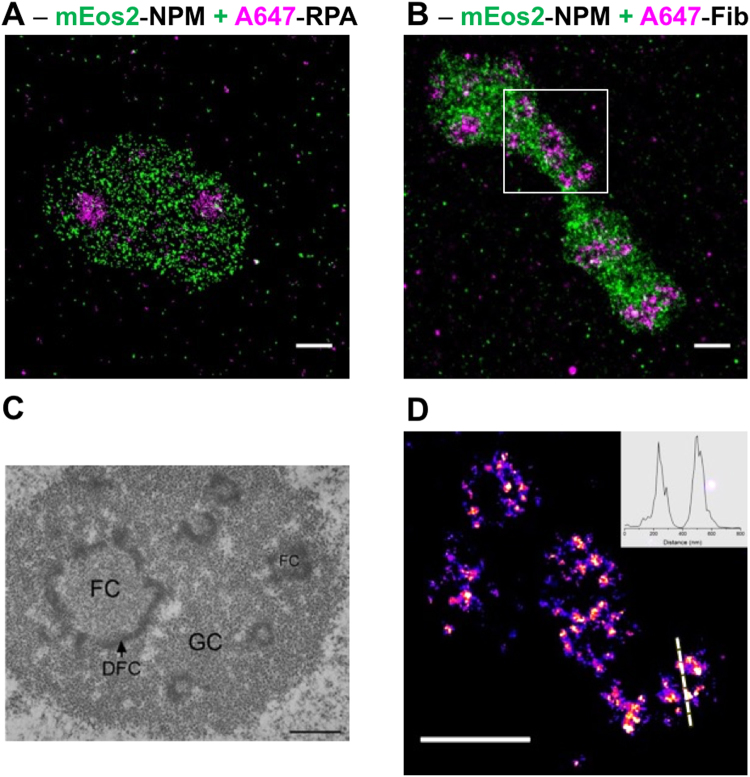
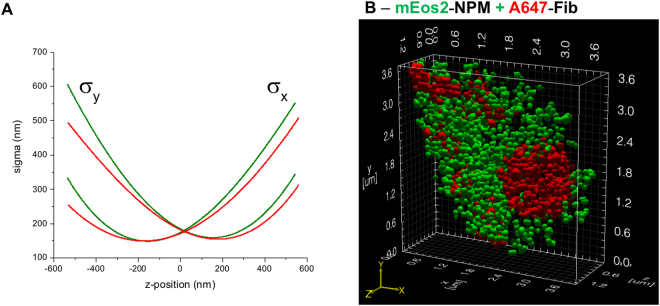
Multi-colour super-resolution localization microscopy is an efficient technique to study a variety of intracellular processes, including protein-protein interactions. This technique requires specific labels that display transition between fluorescent and non-fluorescent states under given conditions. For the most commonly used label types, photoactivatable fluorescent proteins and organic fluorophores, these conditions are different, making experiments that combine both labels difficult. Here, we demonstrate that changing the standard imaging buffer of thiols/oxygen scavenging system, used for organic fluorophores, to the commercial mounting medium Vectashield increased the number of photons emitted by the fluorescent protein mEos2 and enhanced the photoconversion rate between its green and red forms. In addition, the photophysical properties of organic fluorophores remained unaltered with respect to the standard imaging buffer. The use of Vectashield together with our optimized protocol for correction of sample drift and chromatic aberrations enabled us to perform two-colour 3D super-resolution imaging of the nucleolus and resolve its three compartments.


Conflict of interest statement

The authors declare no competing interests.

Figures

Figure 1
Figure 1
Confocal microscopy imaging of nucleolar sub-domains in HeLa cells. Column 1: NPM protein fused to the fluorescent protein eGFP was overexpressed after cell transient transfection in order to image the nucleoli granular component (A1). Endogenous RPA was immunolabelled with A647-Ab (B1). The merged images evidenced the specificity of the labelling strategy (C1). Column 2: eGFP-NPM localization is displayed in panel A2. Endogenous Fib was immunolabelled with A647-Ab (B2). The merged images evidenced the spatial overlap between the two domains (C2). Column 3: Endogenous Fib was immunolabelled with A555-Ab (A3). Endogenous RPA was immunolabelled with A647-Ab (B3). The merged images evidenced the spatial overlap between the two domains (C3). Scale bar: 5 µm.
Figure 2
Figure 2
Comparison of the photophysical properties of overexpressed mEos2 in aqueous buffer (PBS), in the standard imaging buffer of thiols with oxygen scavenging system (MEA 100 mM + GLOX) and in the Vectashield mounting medium. (A) Relative number of localizations as a function of the UV laser power. A single cell was first imaged for 30 s with the 561 nm laser to bleach already activated mEos2. The same cell was then imaged using the 405 and 561 nm lasers for 30 s. Each point corresponds to number of detected localizations over 30 s for different UV laser power. All the points were normalized by the number of localizations measured during the first 30 s. (B) Number of detected photons per molecule per frame (integration time: 30 ms). The mode values are 500, 550 and 1250 photons for PBS, MEA + GLOX and Vectashield respectively. The median number of photons are 711, 793 and 1602 photons for PBS, MEA + GLOX and Vectashield respectively. These results (A and B) were obtained from the average of 5 different cells for each condition.
Figure 3
Figure 3
Correction of lateral chromatic aberrations. The images were obtained by performing a raster scan with a single TetraSpek bead (a detailed protocol is given in the SI). The final reconstructed image was obtained by localizing the bead on each individual frame with Thunder STORM ImageJ plugin for both channels (rendering with a PSF of 20 nm). The displayed images correspond to a zoom of one corner of the camera field of view (27.3 × 27.3 µm2). (A) The largest distance between green and magenta spots is about 100 nm before correction. (B) Two-colour image obtained after correction with the UnwarpJ plugin. Scale bar: 1 µm.
Figure 4
Figure 4
Two-colour super-resolution imaging of nucleolar sub-domains. (A) HeLa cells granular component (GC) was imaged with the help of NPM protein fused to mEos2 (green). The fibrillar centres (FCs) were imaged by immunostaining RPA proteins with A647-Ab (magenta). (B) HeLa cells GC was visualized together with the dense fibrillar component (DFC), by using mEos2-NPM in combination with Fib proteins immunostained by A647-Ab (magenta). (C) Nucleolar organization of human HeLa cell observed by electron microscopy. Reprinted with permission of the author and the editor (permission is granted to Macmillan Publishers Ltd, part of Springer Nature). (D) Ring-like structure of DFC revealed by super-resolution localization microscopy (zoom of the white ROI in B). The inner diameter (FWHM = 160 nm) and the thickness (FWHM = 75 nm) of the ring were measured from the cross section displayed in inset. All super-resolution images were obtained from a 20000 images stack as described in the main text. Scale bars: 1 µm.
Figure 5
Figure 5
Two-colours 3D imaging of nucleolar sub-compartments. (A) The calibration curves for the green and red channels were obtained by performing a z-scan on a single TetraSpek bead. The sigma values (x and y) correspond to the width of the 2D Gaussian fit used to localize the bead position. The difference between the two sets of curves are higher for |Δz| > 200nm. Therefore, the two channels must be treated individually. (B) Two-colour 3D image of the granular and dense fibrillar sub-domains visualized by using mEos2-NPM and A647-Ab directed against fibrillarin. Stacks (10000 images for each colour) were analysed with Thunder Storm to obtain the localization coordinates (x, y and z) from which it was possible to make a 3D surface rendering with the help of ViSP software.

References

    1. Dean KM, Palmer AE. Advances in fluorescence labeling strategies for dynamic cellular imaging. Nat. Chem. Biol. 2014;10:512–523. doi: 10.1038/nchembio.1556. - DOI - PMC - PubMed
    1. Rinaldi AS, et al. The use of fluorescent intrabodies to detect endogenous gankyrin in living cancer cells. Exp. Cell Res. 2013;319:838–849. doi: 10.1016/j.yexcr.2013.01.011. - DOI - PubMed
    1. Anton H, et al. Investigating the cellular distribution and interactions of HIV-1 nucleocapsid protein by quantitative fluorescence microscopy. Plos One. 2015;10:1–23. - PMC - PubMed
    1. Hell SW. Far-field optical nanoscopy. 2010 23rd Annu. Meet. IEEE Photonics Soc. Photinics 2010. 2010;316:3–4. doi: 10.1109/PHOTONICS.2010.5698725. - DOI
    1. Sahl SJ, Hell SW, Jakobs S. Fluorescence nanoscopy in cell biology. Nat. Rev. Mol. Cell Biol. 2017;18:685–701. doi: 10.1038/nrm.2017.71. - DOI - PubMed

Publication types