. 2018 Jun 8;8(1):8785.
doi: 10.1038/s41598-018-27060-6.

Impact of physical confinement on nuclei geometry and cell division dynamics in 3D spheroids

Affiliations

Impact of physical confinement on nuclei geometry and cell division dynamics in 3D spheroids

Annaïck Desmaison et al. Sci Rep. .

Abstract

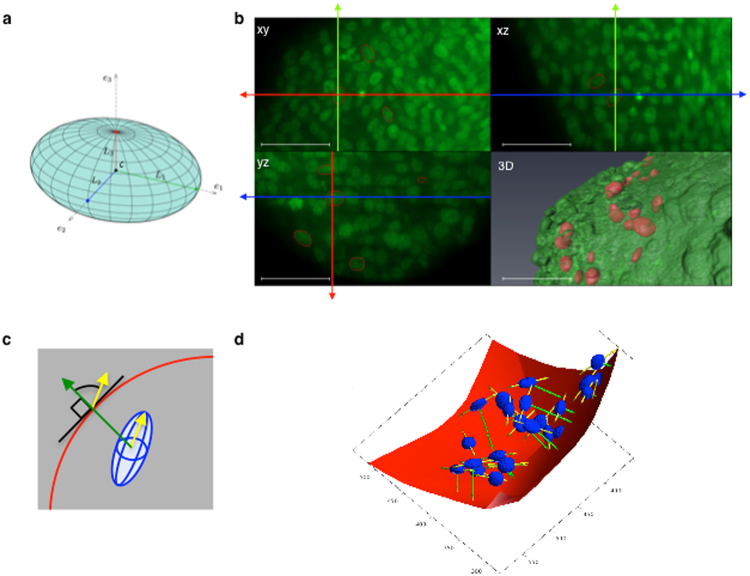
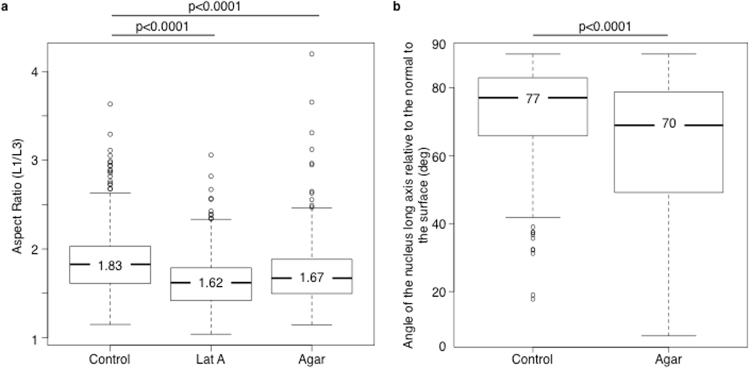
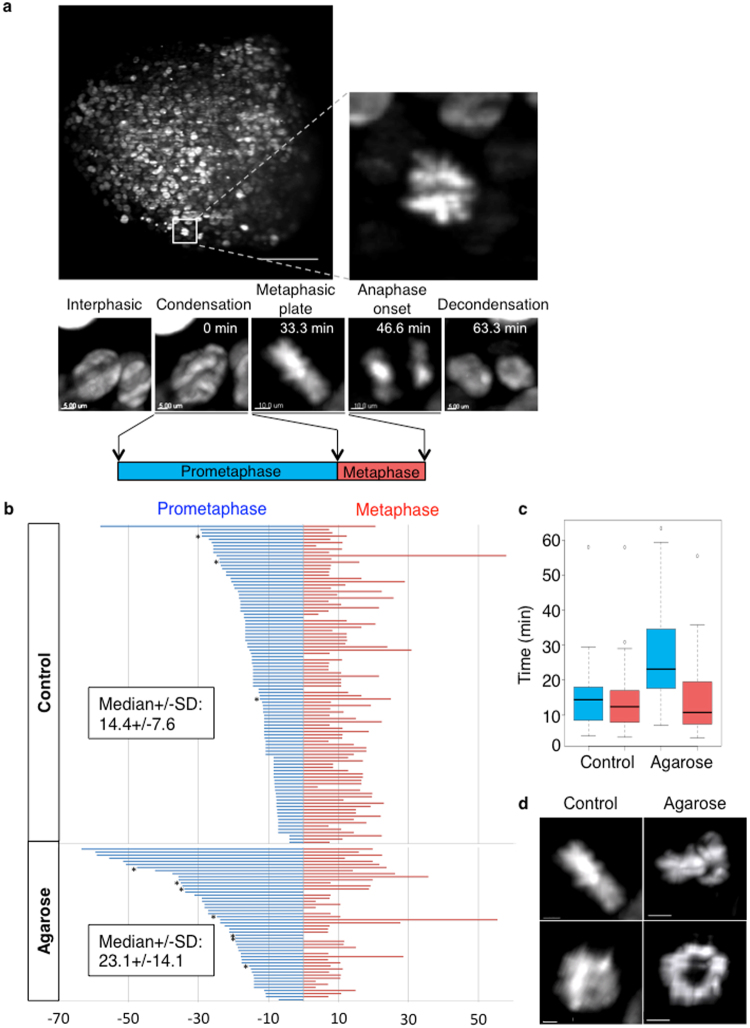
Multicellular tumour spheroids are used as a culture model to reproduce the 3D architecture, proliferation gradient and cell interactions of a tumour micro-domain. However, their 3D characterization at the cell scale remains challenging due to size and cell density issues. In this study, we developed a methodology based on 3D light sheet fluorescence microscopy (LSFM) image analysis and convex hull calculation that allows characterizing the 3D shape and orientation of cell nuclei relative to the spheroid surface. By using this technique and optically cleared spheroids, we found that in freely growing spheroids, nuclei display an elongated shape and are preferentially oriented parallel to the spheroid surface. This geometry is lost when spheroids are grown in conditions of physical confinement. Live 3D LSFM analysis of cell division revealed that confined growth also altered the preferential cell division axis orientation parallel to the spheroid surface and induced prometaphase delay. These results provide key information and parameters that help understanding the impact of physical confinement on cell proliferation within tumour micro-domains.


Conflict of interest statement

The authors declare no competing interests.

Figures

Figure 1
Figure 1
Principle of the determination of 3D nuclei geometry. Spheroids were fixed and stained with propidium iodide (a fluorescent nuclear marker). After optical clearing through ethanol dehydration and incubation in an organic solvent (BABB), nuclei in the whole spheroid volume were imaged by light-sheet fluorescence microscopy. (a) Geometrical parameters of an ellipsoid. (b) Images of the xy, xz and yz planes of a portion of a z-stack with propidium iodide fluorescence shown in green. The red ellipses show the result of the 3D segmentation of nuclei performed using the FitEllipsoid Icy 3D segmentation plugin in each plane. Green, red and blue axes indicate the position in x, y and z respectively. The 3D visualization (lower right panel) corresponds to the volume rendering of a LSFM spheroid z-stack (AMIRA software) in green with the 3D iso-surfaces of segmented nuclei in red. Scale bar: 50 µm. (c) The orientation of a nucleus (in blue) is defined as the angle of the long axis (yellow arrow) relative to the normal (in green) at the closest point on the spheroid surface (in red). (d) 3D visualization of the spheroid convex hull (red) and the ellipsoids corresponding to the nuclei (blue) from a z-stack. The direction of the long axis and the closest point on the spheroid convex hull are shown in yellow and green, respectively.
Figure 2
Figure 2
Analysis of nucleus geometry in spheroids. (a) Boxplots (R software) of the L1 to L3 ratio in control spheroids (control), spheroids incubated with latrunculin A (500 nM) for 8 hours (Lat A) or grown in 1% low-melting point agarose for 24 hours (Agar) before fixation. A high ratio value indicates that the nucleus is elongated; n = 272, 244 and 429 nuclei from control, latrunculin A-treated and agarose-embedded spheroids, respectively. 6 to 13 independent spheroids were analysed in each condition. (b) Boxplots showing the orientation of nuclei in control and agarose-embedded (Agar) spheroids. Only nuclei with an L1/L3 value higher than 1.5 (and thus considered to be elongated) were analysed. A 90° angle means that L1 is parallel to the spheroid convex hull. In control, the nucleus angle values are significantly different from those in agarose-embedded spheroids (p < 0.0001 in both case).
Figure 3
Figure 3
Analysis of the cell division axis orientation. Mitotic cells in the z-stack of a spheroid are detected based on the chromatin condensation visualized thanks to histone H2B-mCherry fluorescence (HCT116-H2B-mCherry cells). (a) 3D visualization of a portion of one HCT116-H2B-mCherry cell spheroid from a LSFM acquisition z-stack. The red surface delineates the metaphase plate. The green arrows indicate the 3D orientation of the division axis. The blue line shows the spheroid surface. The orientation of the division axis was determined by measuring the angle of the division axis relative to the normal to the spheroid surface (MCTS) at the nearest point (S, purple arrow). An angle of 90° corresponds to a division axis parallel to the spheroid surface and a metaphase plate perpendicular to the surface. (b) Boxplots of the angle of the division axis in control and in low-melting point agarose-embedded spheroids.
Figure 4
Figure 4
3D cell division dynamic monitoring reveals longer prometaphase duration in spheroids grown in agarose. (a) 3D time-lapse imaging of cell progression through mitosis using LSFM allows monitoring the cell division dynamics. Top panel: maximal projection of a z-stack (left) and zoom on a mitotic cell (right). Scale bar: 100 µm. Bottom panels: selected in depth images of cells at the indicated stages of mitosis. Time after nuclear condensation is indicated. Prometaphase duration: time between DNA condensation and metaphase initiation. Metaphase duration: time between the establishment of the metaphase plate and anaphase initiation. (b) Prometaphase (blue) and metaphase (red) duration (minutes) measured in mitotic cells within control (n = 98) and agarose-embedded spheroids (n = 50). Each bar represents the duration of these two phases in one mitotic cell in which prometaphase and metaphase were fully monitored (98 out of 104 cells in control, and 50 out of 78 cells in agarose-embedded spheroids). Stars indicate mitotic cells where condensation started before the beginning of the time-lapse video recording. Consequently, in these cells, prometaphase was longer than the duration indicated in the graph. All cells were aligned relative to the metaphase plate. The median (±SD) duration is indicated. (c) Boxplot of the prometaphase (blue) and metaphase (red) duration in control and agarose-embedded spheroids. (d) (Left panels): 3D images of a mitotic cell in a control spheroid with chromosomes organized in a metaphase plate. Scale bar: 5 µm. (Right panels): 3D images of a mitotic cell in a spheroid grown in agarose with chromosomes organized in a ring. Scale bar: 10 µm. Side view (upper panels) and front view (lower panels) are shown.

References

    1. Costa EC, et al. 3D tumor spheroids: an overview on the tools and techniques used for their analysis. Biotechnology advances. 2016;34:1427–1441. doi: 10.1016/j.biotechadv.2016.11.002. - DOI - PubMed
    1. Lobjois V, Frongia C, Jozan S, Truchet I, Valette A. Cell cycle and apoptotic effects of SAHA are regulated by the cellular microenvironment in HCT116 multicellular tumour spheroids. Eur J Cancer. 2009;45:2402–2411. doi: 10.1016/j.ejca.2009.05.026. - DOI - PubMed
    1. Alessandri K, et al. Cellular capsules as a tool for multicellular spheroid production and for investigating the mechanics of tumor progression in vitro. Proc Natl Acad Sci USA. 2013;110:14843–14848. doi: 10.1073/pnas.1309482110. - DOI - PMC - PubMed
    1. Aoun L, et al. Microdevice arrays of high aspect ratio poly(dimethylsiloxane) pillars for the investigation of multicellular tumour spheroid mechanical properties. Lab on a chip. 2014;14:2344–2353. doi: 10.1039/C4LC00197D. - DOI - PubMed
    1. Cheng G, Tse J, Jain RK, Munn LL. Micro-environmental mechanical stress controls tumor spheroid size and morphology by suppressing proliferation and inducing apoptosis in cancer cells. PLoS One. 2009;4:e4632. doi: 10.1371/journal.pone.0004632. - DOI - PMC - PubMed

Publication types

LinkOut - more resources