Review
. 2018 Oct 19;430(21):3954-3968.
doi: 10.1016/j.jmb.2018.06.009. Epub 2018 Jun 7.

From Atoms to Cells: Using Mesoscale Landscapes to Construct Visual Narratives

Affiliations
Review

From Atoms to Cells: Using Mesoscale Landscapes to Construct Visual Narratives

David S Goodsell et al. J Mol Biol. .

Abstract

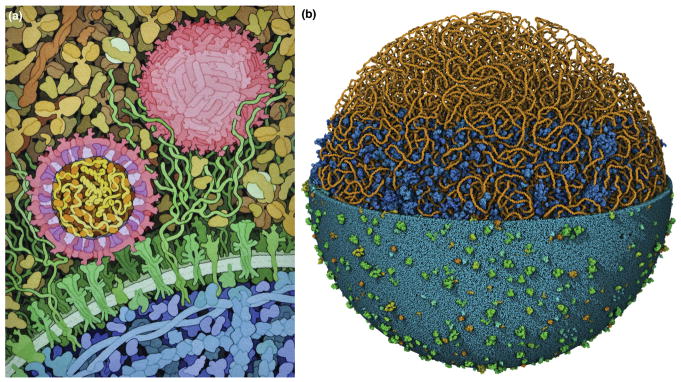
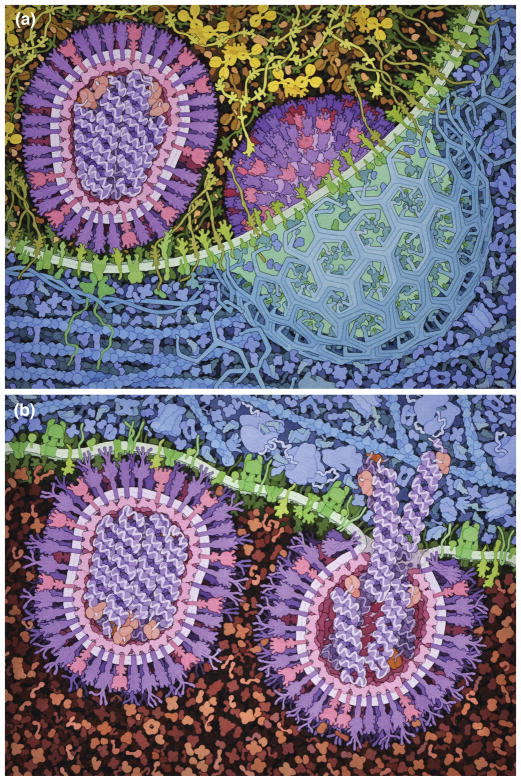
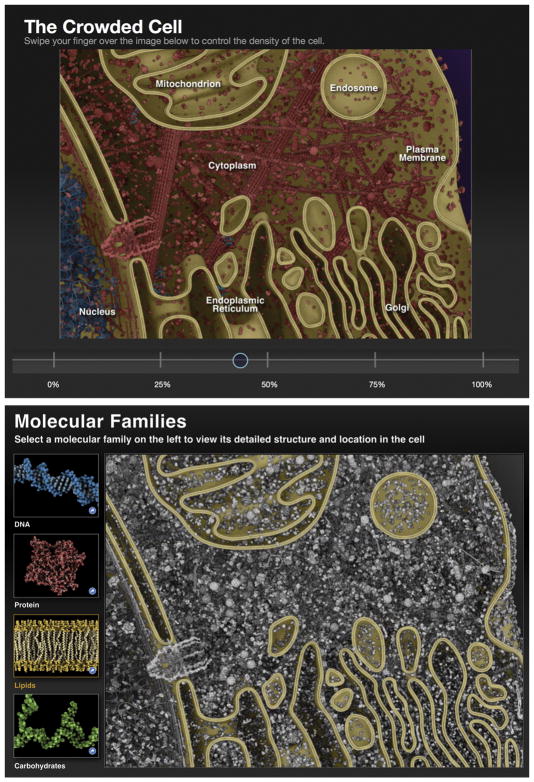
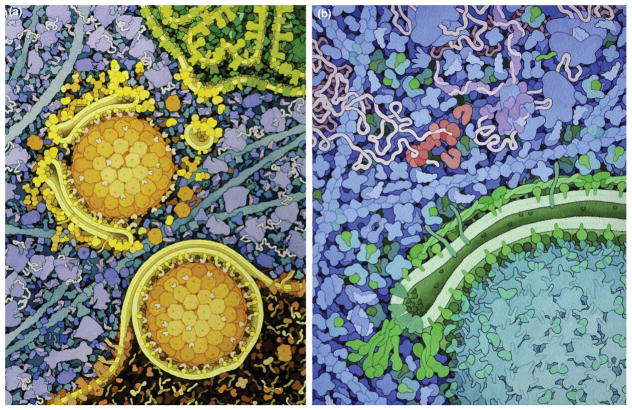
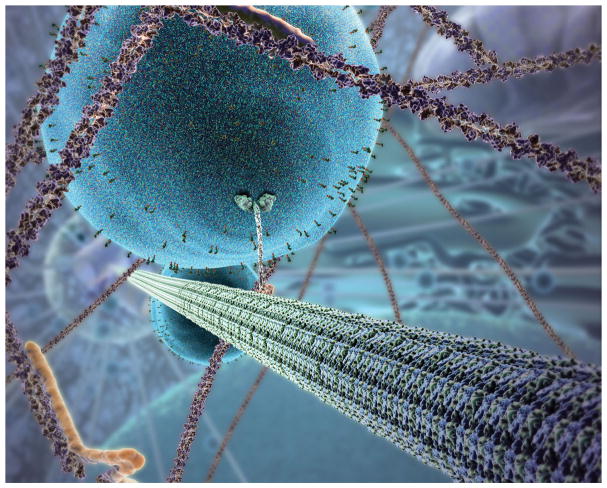
Modeling and visualization of the cellular mesoscale, bridging the nanometer scale of molecules to the micrometer scale of cells, is being studied by an integrative approach. Data from structural biology, proteomics, and microscopy are combined to simulate the molecular structure of living cells. These cellular landscapes are used as research tools for hypothesis generation and testing, and to present visual narratives of the cellular context of molecular biology for dissemination, education, and outreach.

Keywords: cellular mesoscale; integrative structural biology; mesoscale modeling; molecular graphics; science education.


Figures

Figure 1
Figure 1
Mesoscale illustrations. (a) Hand-drawn illustration of Zika virus recognizing a target cell, created for educational outreach at the RCSB Protein Data Bank (http://pdb101.rcsb.org). (b) Three-dimensional model of a full mycoplasma cell. The DNA is modeled using lattice-based methods , the membrane with LipidWrapper , and the remaining molecules with CellPACK . The model is visualized in CellView , using selective clipping to progressively reveal the interior molecules (center) and only the DNA (top). Mycoplasma illustration created by Ludovic Autin.
Figure 2
Figure 2
Illustration from the educational portal of the RCSB Protein Data Bank (http://pdb101.rcsb.org), showing six atomic structures of proteins from Ebola virus, along with an artistic conception of their place in the entire virion. Schematic circles show the approximate volume of portions that were not determined in the atomic structures.
Figure 3
Figure 3
Snapshots of the influenza life cycle, created as part of educational materials being developed at the Center for BioMolecular Modeling. Major steps occur at distant regions in the cell, so they are shown in separate panels: (a) entry at the cell membrane; (b) exit from the endosome. Within each panel, two viruses show separate substeps: (a) attachment at left and endocytosis at right; (b) on the left, hemagglutinin conformational change and insertion into the endosome membrane, and on the right, fusion with the membrane and release of viral RNA into the cytoplasm.
Figure 4
Figure 4
An animation by Drew Berry presents a continuous zoom from atoms to an entire plant. Four frames from the mesoscale portion of the film are shown here: nanoscale views of (a) cellulose and (b) cellulose synthase; (c,d) microscale views of the cell wall, with chloroplasts visible through a translucent cell membrane. Images kindly provided by Drew Berry.
Figure 5
Figure 5
Interactive figures from “EO Wilson’s Life on Earth.” In “The Crowded Cell,” viewers use a slider to add molecules to the scene, exploring the crowded nature of the cell. In “Molecular Families”, viewers selectively color molecules from the families shown at left. Here, “Lipids” have been chosen. Images kindly provided by Gael McGill, Digizyme Inc.
Figure 6
Figure 6
CellPAINT (http://cellpaint.scripps.edu) uses the approach of a digital painting program to create mesoscale illustrations. (a) The interface has a palette of molecules, and tools for painting them into the scene. In this screen capture, the user is drawing a membrane based on an electron micrograph. (b) A completed scene with HIV (green), blood serum (oranges and yellows), and the surface of a T-cell (blue and magenta).
Figure 7
Figure 7
Illustrations of the “cytoplasm to vacuole targeting” (Cvt) process of autophagy, created in a collaboration with Daniel Klionsky. (a) The first illustration was created in 2006 and includes simple representations of the many proteins orchestrating the formation of the phagophore. (b) In 2014, new data allowed more detailed representation of the proteins and complexes.
Figure 8
Figure 8
Frame from “Egress” by Janet Iwasa, created in collaboration with HIV researchers in the CHEETAH Center. The animation integrates data from the field of HIV structural biology to show the complex spatial interactions and ordering of molecules in the budding process. This frame is near the end of the process, when a helical complex of ESCRT-III (in turquoise near the bottom) is pinching off the new virus from the cell surface. Image kindly provided by Janet Iwasa.
Figure 9
Figure 9
A combination of grayscale and color is used to create molecular flashcards that can be used in a number of active learning activities. Here, eukaryotic RNA polymerase with its unstructured C-terminus is identified in the nucleus.
Figure 10
Figure 10
Frame from “Inner Life of the Cell,” showing the kinesin transporting a vesicle along a microtubule. Image kindly provided by Michael Astrachan. ‘Inner Life of the Cell,’ © 2006 President and Fellows of Harvard College. Created by Alain Viel, PhD and Robert Lue, PhD in collaboration with XVIVO, LLC.

References

    1. Alber F, Forster F, Korkin D, Topf M, Sali A. Integrating diverse data for structure determination of macromolecular assemblies. Annu Rev Biochem. 2008;77:443–477. - PubMed
    1. Ben-Harush K, Maimon T, Patla I, Villa E, Medalia O. Visualizing cellular processes at the molecular level by cryo-electron tomography. J Cell Sci. 2010;123:7–12. - PubMed
    1. Beck M, Baumeister W. Cryo-electron tomography: Can it reveal the molecular sociology of cells in atomic detail? Trends Cell Biol. 2016;26:825–837. - PubMed
    1. Im W, Liang J, Olson A, Zhou HX, Vajda S, Vakser IA. Challenges in structural approaches to cell modeling. J Mol Biol. 2016;428:2943–2964. - PMC - PubMed
    1. Porter KR, Tucker JB. The ground substance of the living cell. Sci Am. 1981;244:56–67. - PubMed

Publication types