. 2018 Jun 9;15(1):177.
doi: 10.1186/s12974-018-1214-5.

HSP60 critically regulates endogenous IL-1β production in activated microglia by stimulating NLRP3 inflammasome pathway

Affiliations

HSP60 critically regulates endogenous IL-1β production in activated microglia by stimulating NLRP3 inflammasome pathway

Shalini Swaroop et al. J Neuroinflammation. .

Erratum in

Abstract

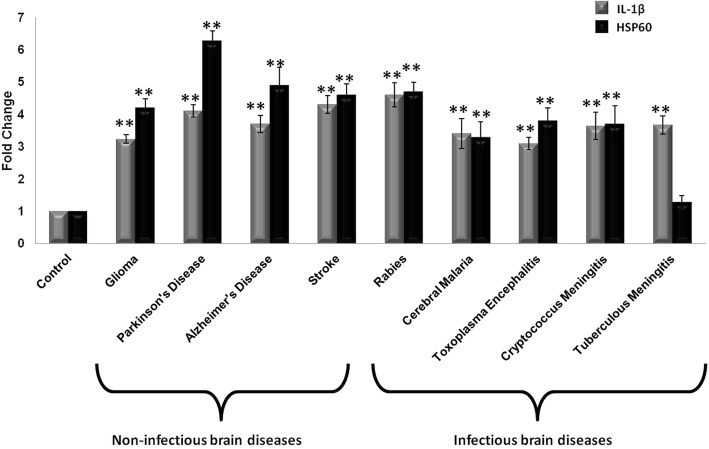
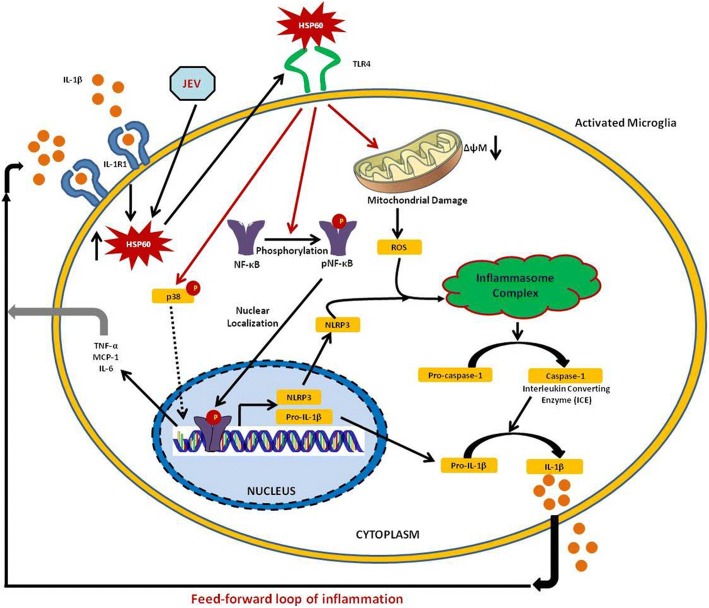
Background: Interleukin-1β (IL-1β) is one of the most important cytokine secreted by activated microglia as it orchestrates the vicious cycle of inflammation by inducing the expression of various other pro-inflammatory cytokines along with its own production. Microglia-mediated IL-1β production is a tightly regulated mechanism which involves the activation of nucleotide-binding oligomerization domain leucine-rich repeat and pyrin domain-containing 3 (NLRP3) inflammasome pathway. Our previous study suggests the critical role of heat shock protein 60 (HSP60) in IL-1β-induced inflammation in microglia through TLR4-p38 MAPK axis. However, whether HSP60 regulates endogenous IL-1β production is not known. Therefore, to probe the underlying mechanism, we elucidate the role of HSP60 in endogenous IL-1β production.

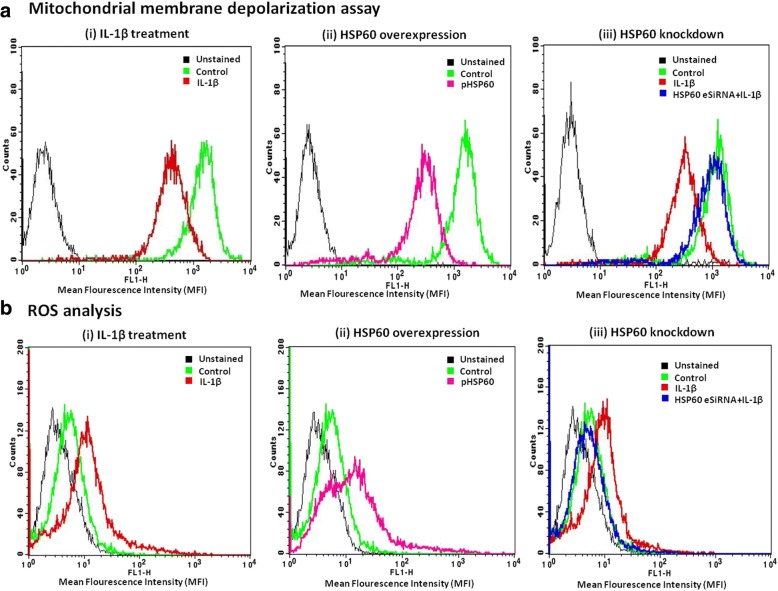
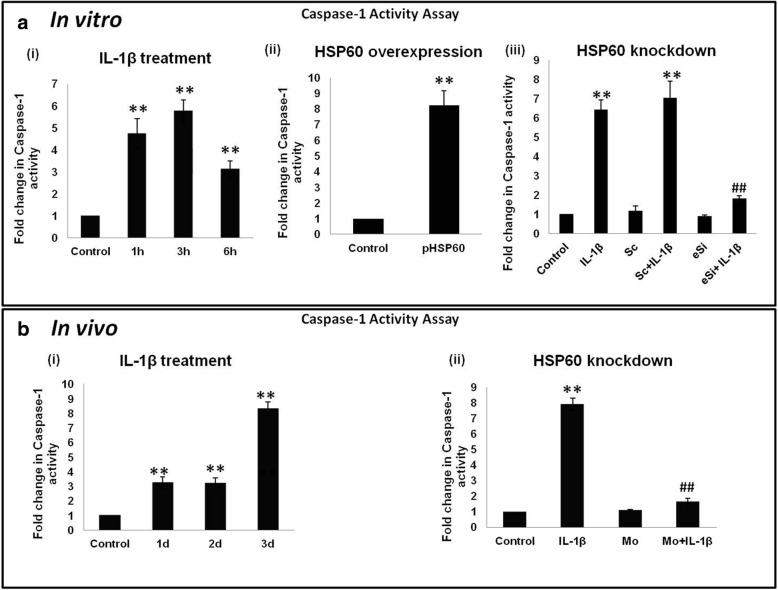
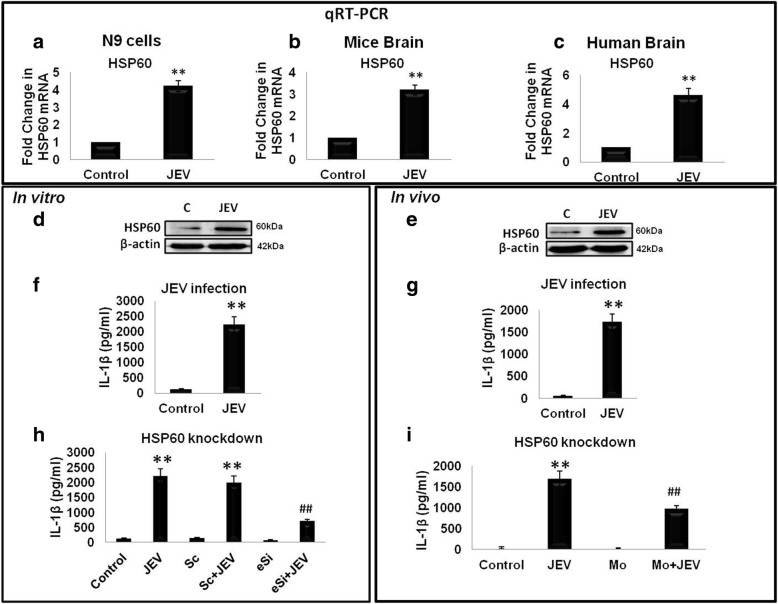
Methods: We used in vitro (N9 murine microglial cells) and in vivo (BALB/c mouse) models for our study. HSP60 overexpression and knockdown experiment was done to elucidate the role of HSP60 in endogenous IL-1β production by microglia. Western blotting and quantitative real-time PCR was performed using N9 cells and BALB/c mice brain, to analyze various proteins and transcript levels. Reactive oxygen species levels and mitochondrial membrane depolarization in N9 cells were analyzed by flow cytometry. We also performed caspase-1 activity assay and enzyme-linked immunosorbent assay to assess caspase-1 activity and IL-1β production, respectively.

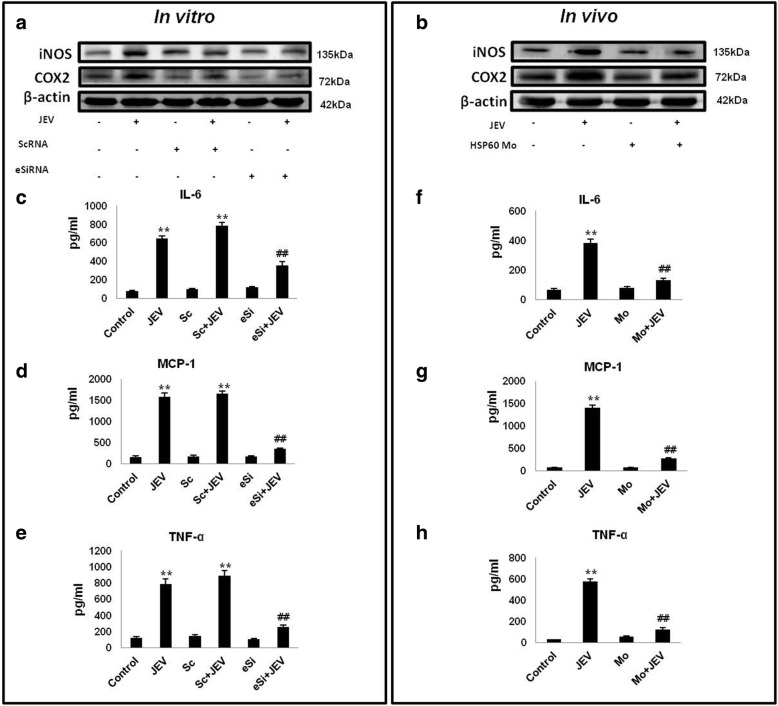
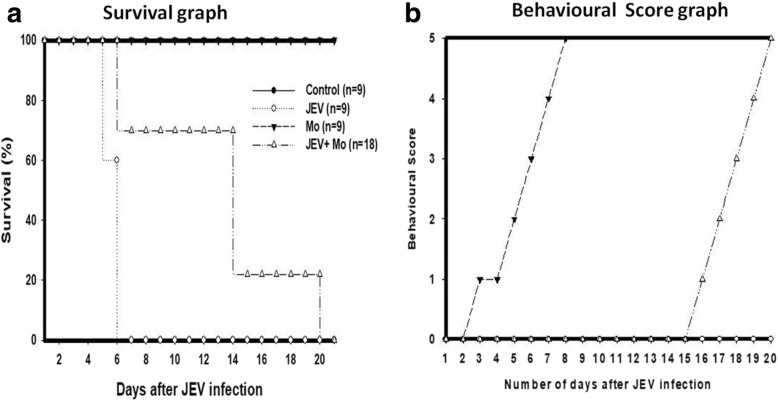
Results: HSP60 induces the phosphorylation and nuclear localization of NF-κB both in vitro and in vivo. It also induces perturbation in mitochondrial membrane potential and enhances reactive oxygen species (ROS) generation in microglia. HSP60 further activates NLRP3 inflammasome by elevating NLRP3 expression both at RNA and protein levels. Furthermore, HSP60 enhances caspase-1 activity and increases IL-1β secretion by microglia. Knockdown of HSP60 reduces the IL-1β-induced production of IL-1β both in vitro and in vivo. Also, we have shown for the first time that knockdown of HSP60 leads to decreased IL-1β production during Japanese encephalitis virus (JEV) infection, which eventually leads to decreased inflammation and increased survival of JEV-infected mice.

Conclusion: HSP60 mediates microglial IL-1β production by regulating NLRP3 inflammasome pathway and reduction of HSP60 leads to reduction of inflammation in JEV infection.

Keywords: Caspase-1; HSP60; Heat shock protein; IL-1β; Inflammasome; Inflammation; Japanese encephalitis virus (JEV); Microglia; Mitochondrial stress; NLRP3; ROS.


Conflict of interest statement

Ethics approval

Institutional Animal Ethics Committee of the National Brain Research Centre (NBRC) approved the protocol of the study (NBRC/IAEC/2016/115 and NBRC/IAEC/2017/028).

Competing interests

The authors declare that they have no competing interests.

Publisher’s Note

Springer Nature remains neutral with regard to jurisdictional claims in published maps and institutional affiliations.

Figures

Fig. 1
Fig. 1
Expression of IL-1β and HSP60 increase in various human brain diseases. The levels of IL-1β and HSP60 gene expression were checked by qRT-PCR in frontal cortex of different neurological conditions and were compared with age-matched controls. For glioma, qRT-PCR was done with tissue sample and the expression of IL-1β and HSP60 were compared with that of control tissue. The transcript levels of the genes were normalized with the levels of GAPDH. The graph depicts pooled analysis of fold change in the levels of IL-1β and HSP60 in different brain diseases as compared with control brain. Data represented as mean ± SD from two different sets of experiments. The graph represents the pooled analysis of qRT-PCR data. **p < 0.01 in comparison to control condition
Fig. 2
Fig. 2
HSP60 is indispensable for IL-1β-mediated NF-κB phosphorylation. a, b Effect of IL-1β was checked on phosphorylation of p65-NF-κB in the cytoplasmic extracts of N9 cells (a) and mice brain (b). c, d Role of HSP60 in the induction of phosphorylation of p65 was checked in N9 cells by overexpression of HSP60 (c) and knockdown of HSP60 (d). e Effect of HSP60 knockdown with vivo-morpholino was checked in mice brain after IL-1β treatment for 3 days. Representative blots of three independent experiments are shown here. Bar diagrams below the blots represent quantification of the relative fold changes in phosphorylation of p65-NF-κB in comparison to control. The levels of p-p65-NF-κB were normalized with total p65-NF-κB. *p < 0.05, **p < 0.01 in comparison to control values. ##p < 0.01 in comparison to IL-1β treatment. Data represented as means ±SD of three independent experiments
Fig. 3
Fig. 3
HSP60 plays a critical role in IL-1β-induced nuclear localization of pNF-κB. a, d Effect of IL-1β was checked on the nuclear localization of phospho-p65-NF-κB in the N9 cells (a) and mice brain (d). b, c Role of HSP60 in the induction of phosphorylation of p65-NF-κB was checked in N9 cells by overexpression of HSP60 (b) and knockdown of HSP60 (c). e Effect of HSP60 knockdown using vivo-morpholino was checked on nuclear localization of p65-NF-κB in mice brain after IL-1β treatment for different time periods. The levels of p65-NF-κB were normalized with the nuclear loading control PCNA protein levels. Representative blots of three independent experiments are shown here. Bar diagrams below the blots represent quantification of the relative fold changes in phosphorylated levels of NF-κB in comparison to control. *p < 0.05, **p < 0.01 in comparison to control values. ##p < 0.01 in comparison to IL-1β treatment. Data represented as means ±SD of three independent experiments
Fig. 4
Fig. 4
HSP60 regulates the expression of NLRP3 after IL-1β treatment. The left panel depicts the qRT-PCR analysis of NLRP3 gene (ae) whereas the right panel shows the Western blot analysis (f–j). IL-1β treatment increased NLRP3 expression in vitro on both transcript level (a) and protein level (f). Similarly, NLRP3 expression was checked in vivo also through qRT-PCR (d) and Western blotting (i). HSP60 overexpression in microglial cells leads to increase in NLRP3 transcript level (b) and protein level (g). Effect of HSP60 knockdown on transcript levels (c, e) as well as protein levels (h, j) were observed in vitro and in vivo, respectively. Normalization of the transcript level was done with GAPDH while β-actin was used for the normalization of Western blots. For quantitative real-time PCR, each experiment was performed in triplicates. Representative blots of three independent experiments are shown here. Bar graphs below the blots represent the quantification of protein levels. *p < 0.05, **p < 0.01 in comparison to control values. ##p < 0.01 in comparison to IL-1β treatment. Data represented as mean ± SD of three independent experiments
Fig. 5
Fig. 5
HSP60 induces mitochondrial damage and oxidative stress. a Mitochondrial damage was assessed in N9 cells using FACS by the quantification of mitochondrial membrane potential using Rhodamine 123 dye (upper panel). Histograms show the effect of IL-1β (i), effect of HSP60 overexpression (ii), and HSP60 knockdown (iii) on mitochondrial membrane potential. b ROS generation in N9 microglial cells was assessed by FACS using DCFDA (lower panel). Histograms in the lower panel show the effect of IL-1β (i), effect of HSP60 overexpression (ii), and HSP60 knockdown (iii) on ROS generation by microglia. Data show that HSP60 knockdown lead to significant reduction in mitochondrial depolarization and ROS generation by microglia (p < 0.01). For FACS analysis, each experiment was performed in triplicates. Results are representative of three independent experiments
Fig. 6
Fig. 6
Role of HSP60 in IL-1β-induced caspase-1 activation. Caspase-1 activity in the N9 cells (upper panel) and mice brain (lower panel) was assessed by caspase-1 activity kit. a Bar graphs in the upper panel show the effect of IL-1β (i), effect of HSP60 overexpression (ii), and HSP60 knockdown (iii) on caspase-1 activity in N9 cells. b Bar graphs in the lower panel show the effect of IL-1β (i) and HSP60 knockdown (ii) on caspase-1 activity in mice brain. Each experiment was performed in triplicates. Data represented as mean ± SD of three independent experiments (n = 3). *p < 0.05; **p < 0.01 in comparison to control values and ##p < 0.01 in comparison to IL-1β treatment
Fig. 7
Fig. 7
HSP60 critically regulates microglial IL-1β production both in vitro and in vivo. Expression of IL-1β gene and its secretion by activated microglia was checked by qRT-PCR and ELISA respectively. Left panel depicts the qRT-PCR analysis of IL-1β gene (a–e) while right panel shows the IL-1β ELISA (f–j). IL-1β treatment increases its own expression in vitro (a) and induces its own secretion also (f). Similarly, IL-1β expression was checked through qRT-PCR (d) and ELISA (i) in vivo. b, g HSP60 overexpression in microglia leads to increase in transcript level of IL-1β (b) and its secretion from microglia (g). Effect of HSP60 knockdown on transcript levels (c, e) as well as secreted levels of IL-1β (h, j) was also observed in vitro and in vivo, respectively. Normalization of the transcript level was done with GAPDH. Both qRT-PCR analysis and ELISA were performed in triplicates for each experiment. Data shown is representative of three independent experiments (n = 3). *p < 0.05, **p < 0.01 in comparison to control values. ##p < 0.01 in comparison to IL-1β treatment. Data represented as mean ± SD of three independent experiments
Fig. 8
Fig. 8
Japanese encephalitis virus (JEV)-induced IL-1β production by activated microglia is regulated by HSP60. Upper panel depicts the qRT-PCR data. a–c JEV infection increases HSP60 both at RNA level (a, b) and protein level (d, e) in N9 cells and mice brains respectively. Protein levels of HSP60 in the Western blot were normalized with β-actin levels while transcript expression of HSP60 was normalized with GAPDH expression. c Effect of JEV infection on the transcript level of HSP60 was also assessed in FFPE human brain sections infected with JEV and were compared with the control brains. f, g JEV infection increases IL-1β secretion both in vitro (f) and in vivo (g) which were analyzed using ELISA. h, i HSP60 knockdown leads to decrease in the IL-1β secretion as assessed by ELISA in N9 cells (h) and mice brain lysate (i). Both qRT-PCR and ELISA were performed in triplicates for each experiment. Data represented as mean ± SD of three independent experiments (n = 3). *p < 0.05, **p < 0.01 in comparison to control values and ##p < 0.01 with respect to JEV-infected values
Fig. 9
Fig. 9
Downregulation of HSP60 reduces JEV-induced microglial inflammation. The left panel shows the effect of HSP60 knockdown with specific eSiRNA on JEV-induced microglial inflammation in N9 cells, while the right panel shows the effect of HSP60 knockdown using HSP60 vivo-morpholino in JEV-infected mice brains. a, b Western blots of iNOS and COX2 after HSP60 knockdown during JEV infection in N9 cells and mice brain respectively. Protein levels of iNOS and COX2 were normalized with the β-actin levels. The blots are representative of three independent experiments. c–h CBA of pro-inflammatory markers was performed to assess the role of HSP60 in JEV-induced microglial inflammation. Bar graphs show quantification of the cytokines levels in N9 cells (c–e) and in mice brains (f–h). Cytokine bead array was performed in triplicates for each experiment. For animal experiments, at least three mice were used in each group. Data represented as mean ± SD of three independent experiments (n = 3). *p < 0.05, **p < 0.01 in comparison to control values. ##p < 0.01 with respect to JEV-infected values
Fig. 10
Fig. 10
Effect of HSP60 knockdown on the survival and behavior of the JEV-infected mice. a Survival plot showing increase in the survival of the mice after reduction in the inflammation by knockdown of HSP60. b Behavioral score plot shows delayed onset of the symptoms of JEV infection. Different scores were given for the behavior of the mice based on the symptoms. 0 = No pilorection; No body stiffening; No restriction of movement; No paralysis; No body tremor. 1 = Pilorection; No body stiffening; No restriction of movement; No paralysis; No body tremor. 2 = Pilorection; body stiffening; No restriction of movement; No paralysis; No body tremor. 3 = Pilorection; body stiffening; restriction of movement; No paralysis; No body tremor. 4 = Pilorection; body stiffening; restriction of movement; paralysis; No body tremor. 5 = Pilorection; body stiffening; restriction of movement; paralysis; body tremor. Data shown is representative of three different independent experiments and ‘n’ represents the number of animals in each group
Fig. 11
Fig. 11
Schema of signaling pathway involved in HSP60-mediated NLRP3 inflammasome activation and subsequent IL-1β production. IL-1β induces its own production by the activated microglia in a HSP60-dependent manner. HSP60, after being upregulated by IL-1β, gets secreted outside and binds with TLR4 of the microglia to activate p38 MAPK [10]. Binding of HSP60 with TLR4 facilitates NF-κB phosphorylation, mitochondrial damage, and ROS generation and finally activates NLRP3 inflammasome leading to IL-1β production. JEV also augments HSP60 production and thus influences inflammasome complex to induce a consecutive expression of IL-1β and, in turn, induces an exaggerated immune response

References

    1. Lehnardt S. Innate immunity and neuroinflammation in the CNS: the role of microglia in toll-like receptor-mediated neuronal injury. Glia. 2010;58:253–263. - PubMed
    1. Carson MJ. Microglia as liaisons between the immune and central nervous systems: functional implications for multiple sclerosis. Glia. 2002;40:218–231. doi: 10.1002/glia.10145. - DOI - PMC - PubMed
    1. Perry VH, Nicoll JA, Holmes C. Microglia in neurodegenerative disease. Nat Rev Neurol. 2010;6:193–201. doi: 10.1038/nrneurol.2010.17. - DOI - PubMed
    1. Purkayastha S, Cai D. Neuroinflammatory basis of metabolic syndrome. Mol Metab. 2013;2:356–363. doi: 10.1016/j.molmet.2013.09.005. - DOI - PMC - PubMed
    1. Graeber MB, Li W, Rodriguez ML. Role of microglia in CNS inflammation. FEBS Lett. 2010;585:3798–3805. doi: 10.1016/j.febslet.2011.08.033. - DOI - PubMed

MeSH terms