. 2018 Jun 27;98(6):1269-1281.e4.
doi: 10.1016/j.neuron.2018.05.019. Epub 2018 Jun 7.

Theta and Alpha Oscillations Are Traveling Waves in the Human Neocortex

Affiliations

Theta and Alpha Oscillations Are Traveling Waves in the Human Neocortex

Honghui Zhang et al. Neuron. .

Abstract

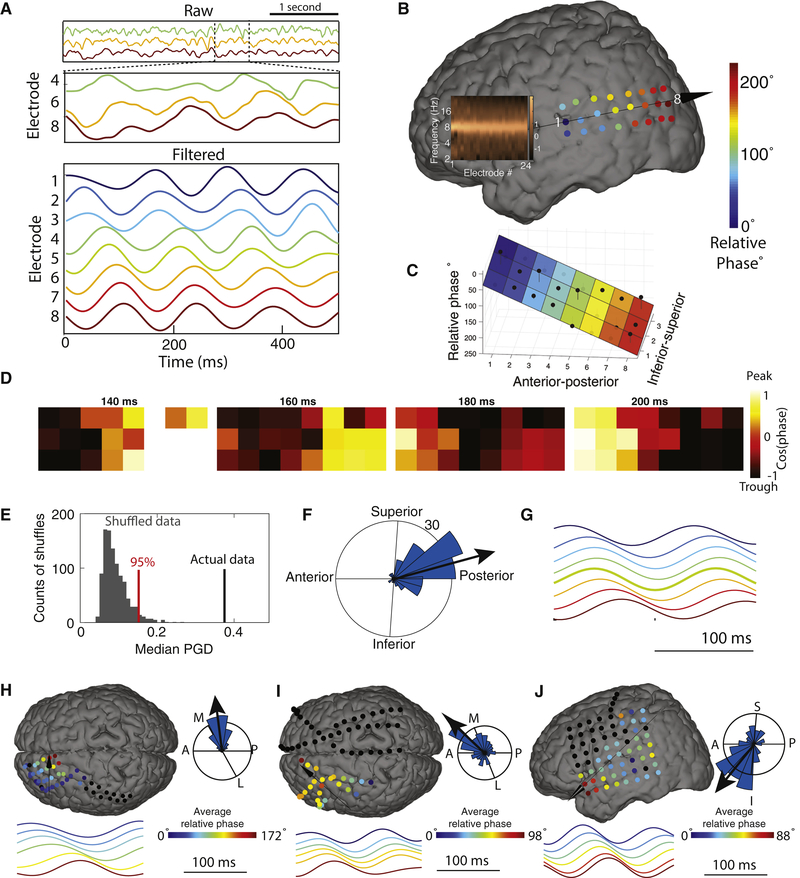
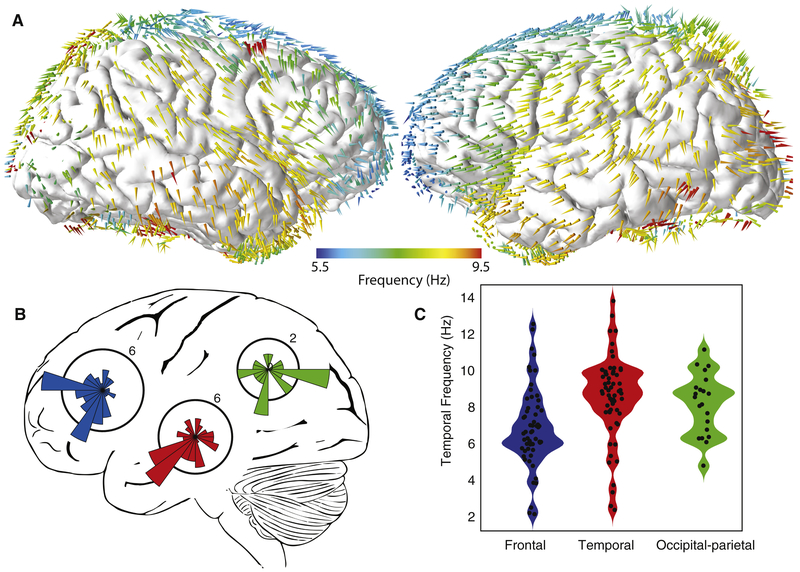
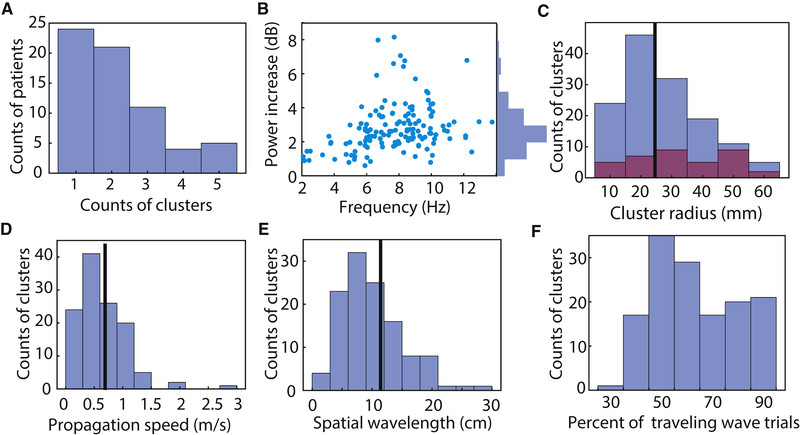
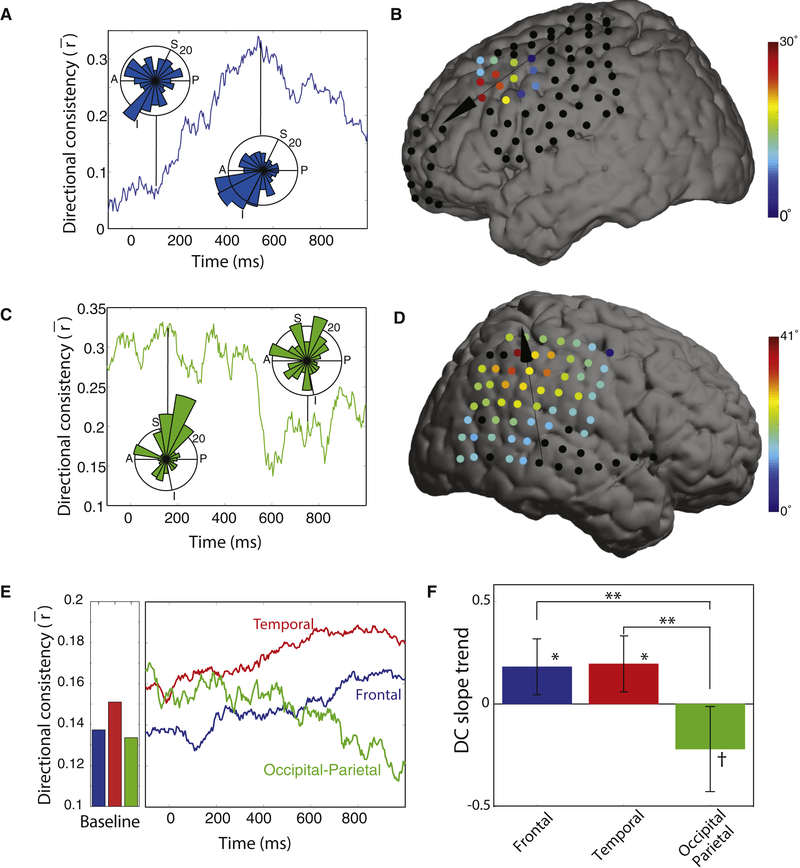
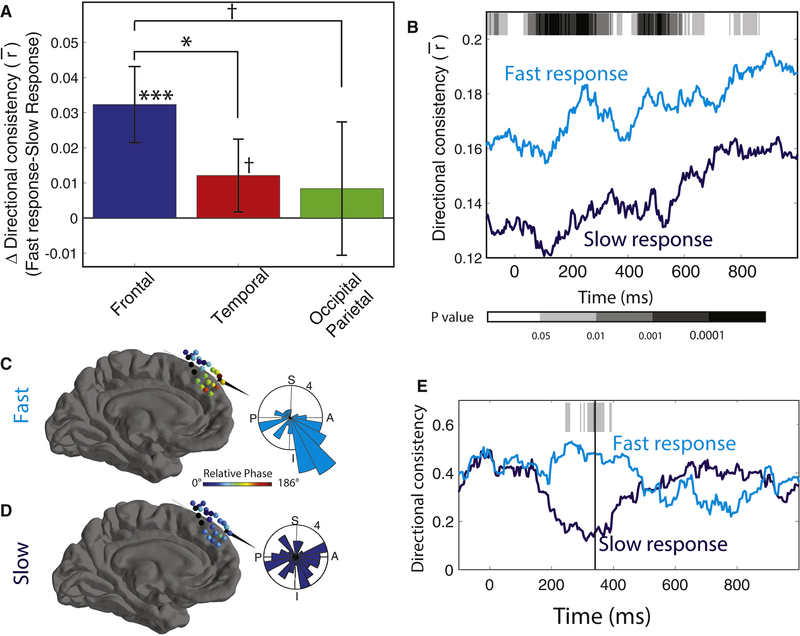
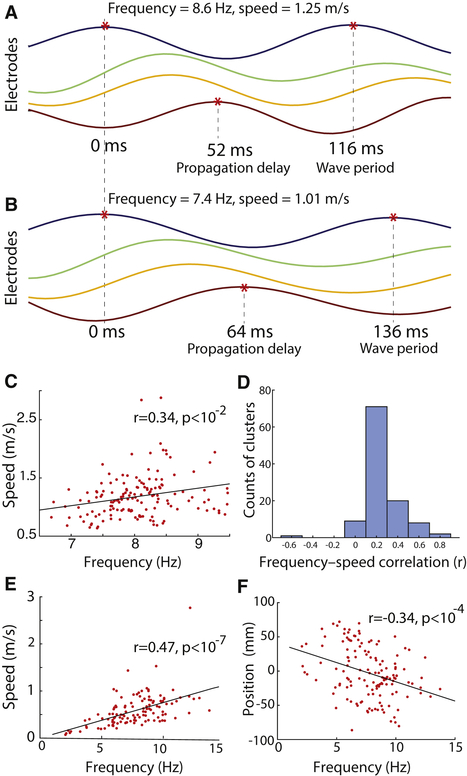
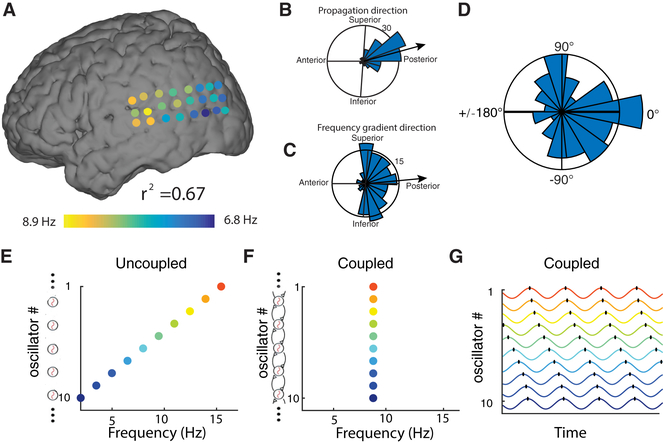
Human cognition requires the coordination of neural activity across widespread brain networks. Here, we describe a new mechanism for large-scale coordination in the human brain: traveling waves of theta and alpha oscillations. Examining direct brain recordings from neurosurgical patients performing a memory task, we found contiguous clusters of cortex in individual patients with oscillations at specific frequencies within 2 to 15 Hz. These oscillatory clusters displayed spatial phase gradients, indicating that they formed traveling waves that propagated at ∼0.25-0.75 m/s. Traveling waves were relevant behaviorally because their propagation correlated with task events and was more consistent when subjects performed the task well. Human traveling theta and alpha waves can be modeled by a network of coupled oscillators because the direction of wave propagation correlated with the spatial orientation of local frequency gradients. Our findings suggest that oscillations support brain connectivity by organizing neural processes across space and time.

Keywords: alpha; electrocorticography; electroencephalography; memory; oscillation; theta; traveling wave.


Conflict of interest statement

Declarations of Interests

The authors declare no competing interests.

Figures

Figure 1:
Figure 1:. Example traveling waves in the human neocortex.
Panels A–G show data from an 8.3-Hz traveling wave in Patient 1. (A) Top panel, raw signals for 4 s of one trial from three selected electrodes. The selected electrodes are ordered from anterior (top) to posterior (bottom). Middle panel, a 500-ms zoomed version of the signals from the top panel. Bottom panel, signals filtered at 6–10 Hz. (B) Relative phase of this traveling wave on this trial across the 3×8 electrode grid. Color indicates the relative phase on each electrode. Arrow indicates direction of wave propagation. Inset shows the normalized power spectrum for each electrode, demonstrating that all the electrodes exhibit narrowband 8.3-Hz oscillations. (C) Illustration of the circular–linear model for quantifying single-trial spatial phase gradients and traveling waves. Black dots indicate the relative phase for each electrode in this cluster on this trial; colored surface indicates the fitted phase plane from the circular–linear model; black lines indicate residuals. (D) The topography of this traveling wave’s phase at four timepoints during this trial. (E) Illustration of the average traveling wave on this cluster across trials. Each electrode’s time-averaged waveform is computed as the average signal relative to oscillation troughs triggered from electrode 5. (F) Analysis of phase-gradient directionality (PGD) for the traveling waves on this cluster. Black line indicates the median PGD for this cluster, computed across trials. Gray bars indicate the distribution of median PGD values expected by chance for this cluster, estimated from shuffled data. (G) Histogram indicating the distribution across trials of propagation directions for the traveling waves on this cluster. (H) Example 5.9-Hz traveling wave from Patient 3.(I) Example 7.9-Hz traveling wave from Patient 63. (J) Example 8.8-Hz traveling wave from Patient 77.
Figure 2:
Figure 2:. Population analysis of traveling wave direction and frequency.
(A) Spatial topography of mean traveling-wave direction and frequency. Colored arrows indicate the mean direction and frequency of traveling waves observed at an electrode within 1.5 cm. (B) Distribution of the mean direction of traveling waves from each lobe. The orientations of the polar histograms are projected to match the lateral brain view. (C) Distributions of temporal frequencies for traveling waves from different regions; shaded region indicates probability density. Black dots indicate the mean frequency from individual electrode clusters.
Figure 3:
Figure 3:. Population summary statistics on traveling waves.
(A) Histogram showing the counts of electrode clusters per patient that showed significant traveling waves. (B) Distribution of the narrowband power (relative to 1/ f) of traveling waves. (C) Distributions of estimated spatial radius across traveling-wave clusters. Purple bars indicates data from grid electrodes; other bars come from strips. Black line indicates median. (D) Distributions of propagation speed across clusters. (E) Distribution of wavelength. (F) Distribution of the mean percentage of time when individual clusters showed reliable traveling waves at the single-trial level.
Figure 4:
Figure 4:. Temporal dynamics of traveling waves.
(A) Timecourse of directional consistency (DC) for a traveling wave at 12.5 Hz from Patient 26’s frontal lobe. Inset circular histograms indicate the distributions of propagation directions across trials at the labeled timepoints. (B) Brain plot showing the mean relative phase shift at each electrode at the timepoint of peak consistency for the same subject as Panel A. (C & D) Traveling 6.2-Hz parietoccipital wave from Patient 13, which showed a decrease in DC after cue onset. (E) Timecourse of traveling-wave DC. Bars indicate the mean DC for each region when patient is out of task. (F) Analysis of DC slope. Positive values indicate that DC increases following cue onset. Error bars denote 95% confidence intervals. Post-hoc test: ** denotes p < 0.01; *, p < 0.05; , p < 0.1
Figure 5:
Figure 5:. Traveling waves and behavior.
(A) Mean difference in DC between fast and slow trials for 1 s after cue onset, separately calculated for each region. (B) Timecourse of mean DC in the frontal lobe between fast and slow trials. Gray shading indicates significance (paired t tests). (C) Brain plot showing the mean relative phase distribution across an oscillation cluster in Patient 3. Inset plot shows distribution of propagation directions across trials 220 ms after probe onset. (D) Same as C, for trials where the patient responded slowly. (E) Time course of DC for data from Patient 3 that demonstrated elevated DC during trials where the patient responded rapidly. Shading indicates p values from a non-parametric circular direction comparison test (Fisher, 1993) between fast and slow response trials. Post-hoc test: *** denotes p < 0.001; *, p < 0.05; , p < 0.1.
Figure 6:
Figure 6:. Characteristics of traveling-wave propagation.
(A) A traveling wave on one trial for four electrodes in an oscillation cluster (see Fig. 1B). (B) A traveling wave for these electrodes from a different trial when there was a slower temporal frequency. Same format as Panel A. (C) Across-trial analysis of the relation between traveling-wave propagation speed and frequency, for the electrode cluster whose signals are shown in Panel A & B. Each point indicates one trial. Black line is a least-squares fit. (D) Histogram of within-cluster correlations between propagation speed and frequency. Each correlation coefficent is computed separately for each cluster. (E) Across-cluster analysis of the relation between traveling-wave propagation speed and frequency. Each point indicates the mean frequency and mean propagation speed of the traveling waves from a given oscillation cluster. (F) Population analysis of the relation between traveling-wave frequency and cluster location along the anterior–posterior axis (Talairach coordinates [mm]).
Figure 7:
Figure 7:. Mechanisms of traveling waves.
(A) The instantaneous frequency distribution across an oscillation cluster from Patient 1 on one trial (same as Fig. 1B), demonstrating an anterior-to-posterior decreasing spatial-frequency gradient (r2 = 0.67). (B) Distribution of traveling-wave propagation directions on this electrode cluster across trials (reproduced from Fig. 1G). (C) Distribution of the directions of the spatial-frequency gradients across this cluster. In B & C, black lines indicate the mean directions, thus demonstrating a correspondence between the directions of phase and frequency gradients. (D) Distribution of angular differences, across oscillation clusters, between the mean direction of traveling-wave propagation and the mean direction of spatial frequency gradients. (E–G) Illustration of a model of weakly coupled oscillators (Ermentrout and Kopell, 1984) with parameters matched to our findings. Color warmth increases with intrinsic frequency. When there is no phase coupling (Panel E), individual oscillators demonstrate their intrinsic oscillation frequencies from 2 Hz (anterior) to 16 Hz (posterior). When phase coupling is present (Panels F–G), all oscillators have the same temporal frequency (F) and a traveling wave emerges (G).

Comment in

  • Oscillations Travel Around the Human Brain.
    Smith EH, Rolston JD. Smith EH, et al. Neurosurgery. 2018 Nov 1;83(5):E205-E206. doi: 10.1093/neuros/nyy402. Neurosurgery. 2018. PMID: 30321419 Free PMC article. No abstract available.

References

    1. Agarwal G, Stevenson IH, Berényi A, Mizuseki K, Buzsáki G, and Sommer FT (2014). Spatially distributed local fields in the hippocampus encode rat position. Science, 344(6184):626–630. - PMC - PubMed
    1. Alexander DM, Jurica P, Trengove C, Nikolaev AR, Gepshtein S, Zvyagintsev M, Mathiak K, Schulze-Bonhage A, Ruescher J, Ball T, et al. (2013). Traveling waves and trial averaging: The nature of single-trial and averaged brain responses in large-scale cortical signals. Neuroimage, 73:95–112. - PubMed
    1. Badre D and D’Esposito M (2009). Is the rostro-caudal axis of the frontal lobe hierarchical? Nature Reviews Neuroscience, 10(9):659. - PMC - PubMed
    1. Bahramisharif A, van Gerven MA, Aarnoutse EJ, Mercier MR, Schwartz TH, Foxe JJ, Ramsey NF, and Jensen O (2013). Propagating neocortical gamma bursts are coordinated by traveling alpha waves. The Journal of Neuroscience, 33(48):18849–18854. - PMC - PubMed
    1. Bastos AM, Vezoli J, Bosman CA, Schoffelen J-M, Oostenveld R, Dowdall JR, De Weerd P, Kennedy H, and Fries P (2015). Visual areas exert feedforward and feedback influences through distinct frequency channels. Neuron, 85(2):390–401. - PubMed

Publication types