. 2018 Jul 26;174(3):744-757.e24.
doi: 10.1016/j.cell.2018.05.024. Epub 2018 Jun 7.

Higher-Order Inter-chromosomal Hubs Shape 3D Genome Organization in the Nucleus

Affiliations

Higher-Order Inter-chromosomal Hubs Shape 3D Genome Organization in the Nucleus

Sofia A Quinodoz et al. Cell. .

Abstract

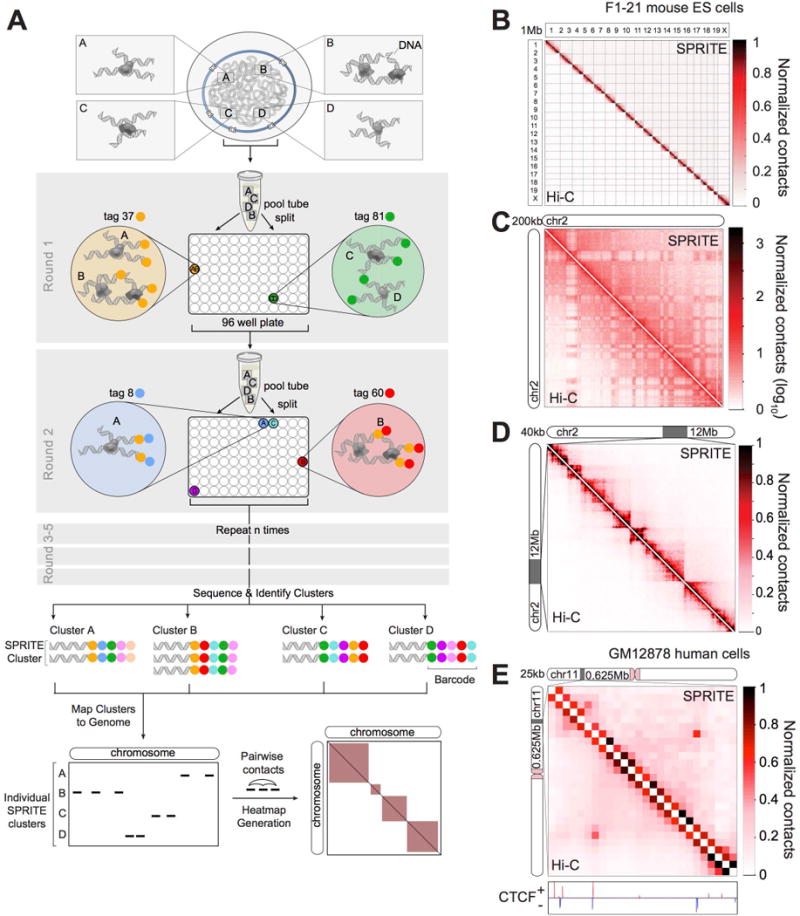
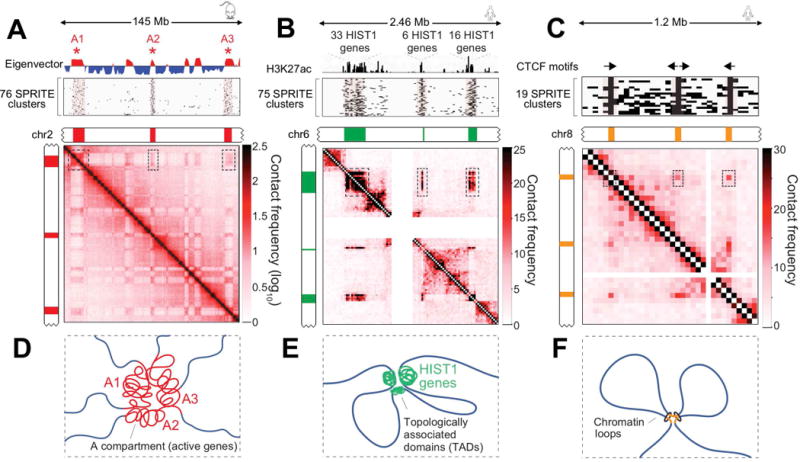
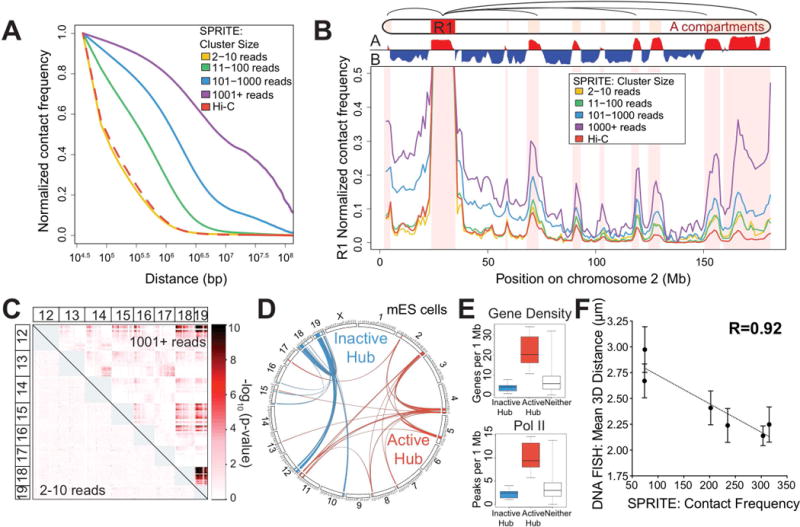
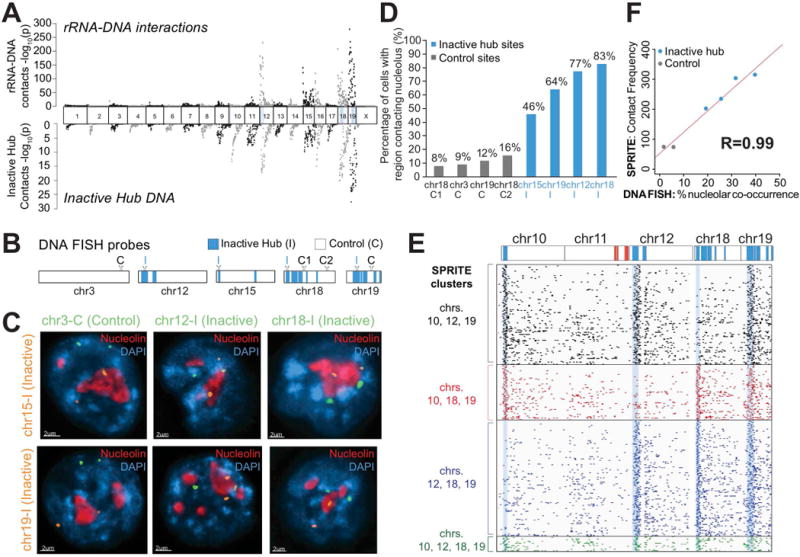
Eukaryotic genomes are packaged into a 3-dimensional structure in the nucleus. Current methods for studying genome-wide structure are based on proximity ligation. However, this approach can fail to detect known structures, such as interactions with nuclear bodies, because these DNA regions can be too far apart to directly ligate. Accordingly, our overall understanding of genome organization remains incomplete. Here, we develop split-pool recognition of interactions by tag extension (SPRITE), a method that enables genome-wide detection of higher-order interactions within the nucleus. Using SPRITE, we recapitulate known structures identified by proximity ligation and identify additional interactions occurring across larger distances, including two hubs of inter-chromosomal interactions that are arranged around the nucleolus and nuclear speckles. We show that a substantial fraction of the genome exhibits preferential organization relative to these nuclear bodies. Our results generate a global model whereby nuclear bodies act as inter-chromosomal hubs that shape the overall packaging of DNA in the nucleus.

Keywords: Nuclear structure; RNA DNA interactions; SPRITE; genome structure; higher-order nuclear structure; multi-way interactions; nuclear organization; nuclear speckle; nucleolus.


Conflict of interest statement

DECLARATION OF INTERESTS

S.Q. and M.G. are inventors on a provisional patent on the SPRITE method.

Figures

Figure 1
Figure 1. SPRITE accurately maps known genome structures across various resolutions
(A) Schematic of the SPRITE protocol. Crosslinked DNA is split into a 96-well plate and tagged with a unique sequence (colored circle) and then pooled into one tube. This split-and-pool process is repeated with tags sequentially added. DNA is sequenced, and tags are matched to generate SPRITE clusters. (B-D) Comparison of SPRITE (upper diagonal) and Hi-C (Dixon et al., 2012) (lower diagonal) in mouse embryonic stem cells (mESCs) (B) across all chromosomes at 1 Mb resolution, (C) on chromosome 2 at 200kb resolution (shown in log scale), and (D) within a 12 Mb region at 40 kb resolution. (E) Comparison of SPRITE and Hi-C (Rao et al., 2014) in human GM12878 cells within a 625 kb region at 25 kb resolution. CTCF binding (ENCODE) is colored based on motif orientation.
Figure 2
Figure 2. SPRITE identifies higher-order interactions that occur simultaneously
(A) Compartment eigenvector showing A (red) and B (blue) compartments on mouse chromosome 2 (Top). Individual SPRITE clusters (rows) containing reads mapping to at least 3 distinct regions (*) (Middle). Pairwise contact map at 200kb resolution (Bottom). (B) Schematic of multiple A compartment interactions. (C) H3K27ac ChIP-seq signal across a 2.46 Mb region on human chromosome 6 corresponding to 3 TADs containing 55 histone genes (Top). SPRITE clusters containing reads in all 3 TADs (Middle). Pairwise contact map at 25kb resolution (Bottom). (D) Schematic of higher-order interactions of HIST1 genes (green). (E) CTCF motif orientations at 3 loop anchors on human chromosome 8 (Top). SPRITE clusters overlapping all 3 loop anchors (Middle). Pairwise contact map at 25kb resolution (Bottom). (F) Schematic of higher-order interactions between consecutive loop anchors.
Figure 3
Figure 3. SPRITE identifies interactions across large genomic distances and across chromosomes
(A) Proximity ligation methods identify interactions that are close enough to directly ligate (green check), but miss those that are too far apart to ligate (red x). SPRITE identifies all crosslinked interactions within a complex and measures different DNA cluster sizes generated by fragmentation of the nucleus. (B) Relationship between contact frequency observed by Hi-C and different SPRITE cluster sizes relative to linear genomic distance in mESCs. (C) Contact frequency between a specific region (R1: 25-34 Mb) and other regions on mouse chromosome 2 for different SPRITE cluster sizes and Hi-C. Red shaded areas represent A compartment. (D) Interaction p-values are shown for SPRITE clusters of size 2-10 reads (lower diagonal) and 1001+ reads (upper diagonal) between mouse chromosomes 12 through 19. (E) Circos diagram of two sets of significant inter-chromosomal interactions are shown in blue (inactive hub) and red (active hub). (F) Box plots of gene density (left) and RNA polymerase II occupancy (right) for regions in the inactive hub (blue), active hub (red), or neither hub (grey).
Figure 4
Figure 4. Genomic DNA in the inactive hub is organized around the nucleolus
(A) Ribosomal RNA (rRNA) localization across the mouse genome identified using RNA-DNA SPRITE (top) compared to the DNA SPRITE contact frequency with regions in the inactive hub (bottom). (B) Locations of probe regions used for DNA FISH experiments. (C) Example images from immunofluorescence for nucleolin (red) combined with DNA FISH for six different pairs of DNA FISH probes (orange and green) and DAPI (blue). (D) Percent of cells that overlap nucleolin (distance = 0 μm) for 8 different probe regions, 4 control regions (grey) and 4 inactive hub regions (blue) measured in 50-155 cells/region. (E) Example of individual SPRITE clusters (rows) containing reads from different combinations of inactive hub regions (blue) on chromosomes 10, 12, 18 and 19 binned at 1Mb resolution. (F) Comparison of co-association of two DNA sites on different chromosomes around the same nucleolus measured by microscopy (x-axis) and SPRITE co-association frequency (y-axis) for six pairs of regions (see details in Figure S4F, n = 50-64 cells).
Figure 5
Figure 5. Genomic DNA in the active hub is organized around nuclear speckles
(A) Malat1 lncRNA localization (black) (Engreitz et al., 2014) compared to SPRITE contact frequency with regions in the active hub (red). (B) Locations of probe regions used for DNA FISH experiments. (C) Example images from immunofluorescence for SC35 (red) combined with DNA FISH for six DNA regions (green) and DAPI (blue) performed in formaldehyde fixed cells. Arrowhead: 3D distance to SC35 is noted. (D) Percentage of cells with at least 1 allele within 0.25 μm of SC35 (n = 41-90 cells). See Figure S5E for further quantitation. (E) Cumulative frequency of minimum 3D distance to SC35 for active hub (red) and control (grey) regions. (F) Example individual SPRITE clusters (rows) containing reads from different combinations of 3 active hub regions on chromosomes 2, 4, 5 and 11. (G) Images of 2 active hub regions on different chromosomes that are close to the same nuclear speckle.
Figure 6
Figure 6. Preferential DNA distance to the nucleolus and nuclear speckles constrain overall genome organization
(A) SPRITE contact frequency to the nucleolar hub (y-axis) or speckle hub (x-axis) for each 1Mb genomic bin in mES cells. (B) SPRITE contact frequency to the nucleolar hub (blue) or speckle hub (red) across mouse chromosome 11. Red boxes represent active hub regions. (C) SPRITE contact frequency to the nucleolar hub (x-axis) compared to DNA FISH contact frequency to the nucleolus as measured by microscopy across 50-155 cells/region (y-axis). (D) SPRITE contact frequency to the speckle hub (x-axis) compared to DNA FISH contact frequency to nuclear speckles as measured by microscopy (y-axis) across 50-51 cells/region. See Figure S6B-D for further details. (E) SPRITE contact frequencies with the nucleolar hub (y-axis) and centromere distance (x-axis) (top) and SPRITE contacts with the speckle hub (y-axis) and PolII density (x-axis, ENCODE) (bottom). (F) SPRITE contact frequency with the speckle hub compared to RNA PolII and H3K27ac signal (ENCODE) across a region on chromosome 2. Highly expressed (red, FPKM>10), moderately expressed (grey FPKM=2-10), or inactive (blue, FPKM=0-2) genes are indicated. Zoom-in: chr2:31.4-30.0 Mb (left) and chr2:51.7-52.3 Mb (right).
Figure 7
Figure 7. A global model for how nuclear bodies shape overall three-dimensional genome organization in the nucleus
Left Panel: DNA regions containing a high-density of PolII associate with the nuclear speckle, while genomic regions linearly close to ribosomal DNA or centromeric regions associate with the nucleolus. This leads to co-association of multiple DNA regions around the same nuclear body to create spatial hubs of inter-chromosomal contacts. In addition to the genomic regions directly associating around these nuclear bodies, other DNA regions exhibit preferential organization, such that regions with higher levels of PolII density are closer to the nuclear speckle (red gradient) and regions with lower levels of PolII density are closer to the nucleolus (blue gradient). Right panel: These overall constraints act to shape the global layout of genomic DNA in the nucleus. DNA regions on the same chromosome tend to be closer to each other (colored lines). Yet, regions on different chromosomes containing similar properties organize around a nuclear body and can be closer to each other than to other regions contained on the same chromosome.

Comment in

  • Chromosome interaction hubs around nuclear bodies.
    Koch L. Koch L. Nat Rev Genet. 2018 Aug;19(8):470-471. doi: 10.1038/s41576-018-0026-x. Nat Rev Genet. 2018. PMID: 29884879 No abstract available.
  • 3D interaction hubs.
    Song Y. Song Y. Nat Chem Biol. 2018 Aug;14(8):745. doi: 10.1038/s41589-018-0112-6. Nat Chem Biol. 2018. PMID: 30018419 No abstract available.
  • SPRITE maps the 3D genome.
    Rusk N. Rusk N. Nat Methods. 2018 Aug;15(8):572. doi: 10.1038/s41592-018-0092-1. Nat Methods. 2018. PMID: 30065384 No abstract available.

References

    1. Beagrie RA, Scialdone A, Schueler M, Kraemer DCA, Chotalia M, Xie SQ, Barbieri M, de Santiago I, Lavitas LM, Branco MR, et al. Complex multi-enhancer contacts captured by genome architecture mapping. Nature. 2017;543:519–524. - PMC - PubMed
    1. Branco MR, Pombo A. Intermingling of chromosome territories in interphase suggests role in translocations and transcription-dependent associations. PLoS Biol. 2006;4:780–788. - PMC - PubMed
    1. Brown JM, Green J, Das Neves RP, Wallace HAC, Smith AJH, Hughes J, Gray N, Taylor S, Wood WG, Higgs DR, et al. Association between active genes occurs at nuclear speckles and is modulated by chromatin environment. J Cell Biol. 2008;182:1083–1097. - PMC - PubMed
    1. Darrow EM, Huntley MH, Dudchenko O, Stamenova EK, Durand NC, Sun Z, Huang SC, Sanborn AL, Machol I, Shamim M, et al. Deletion of DXZ4 on the human inactive X chromosome alters higher-order genome architecture. Proc Natl Acad Sci U S A. 2016;113:E4504–12. - PMC - PubMed
    1. Decker CJ, Parker R. P-bodies and stress granules: possible roles in the control of translation and mRNA degradation. Cold Spring Harb Perspect Biol. 2012;4 - PMC - PubMed

Publication types