. 2018 Jul 12;174(2):350-362.e17.
doi: 10.1016/j.cell.2018.05.022. Epub 2018 Jun 7.

A Network of Noncoding Regulatory RNAs Acts in the Mammalian Brain

Affiliations

A Network of Noncoding Regulatory RNAs Acts in the Mammalian Brain

Benjamin Kleaveland et al. Cell. .

Abstract

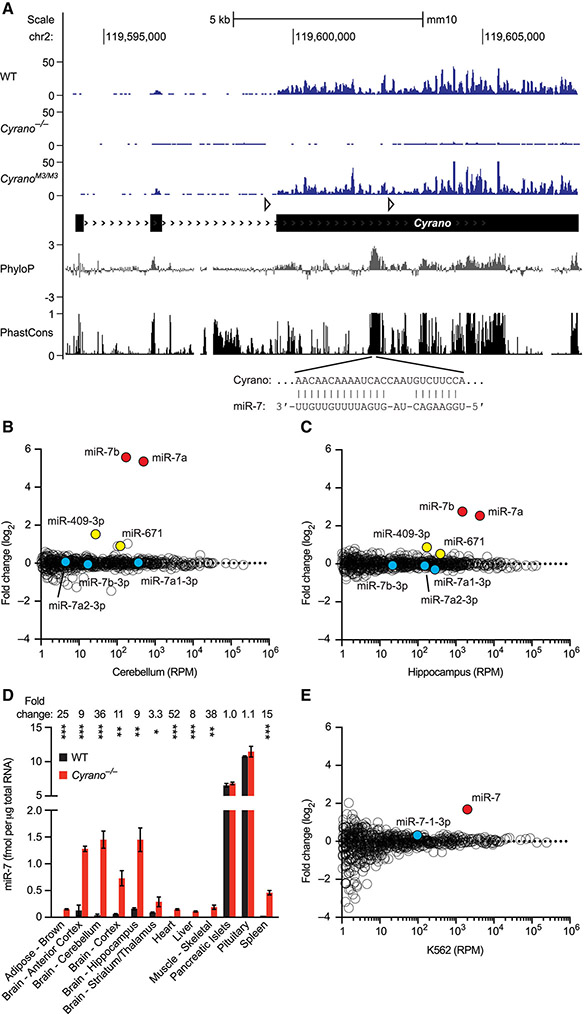
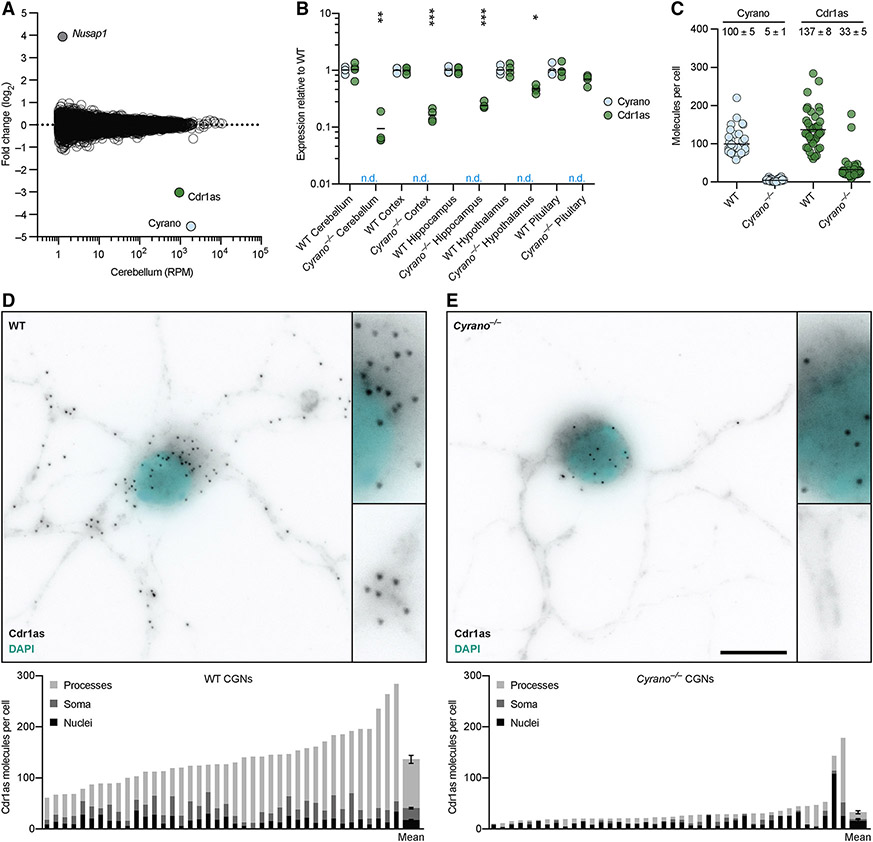
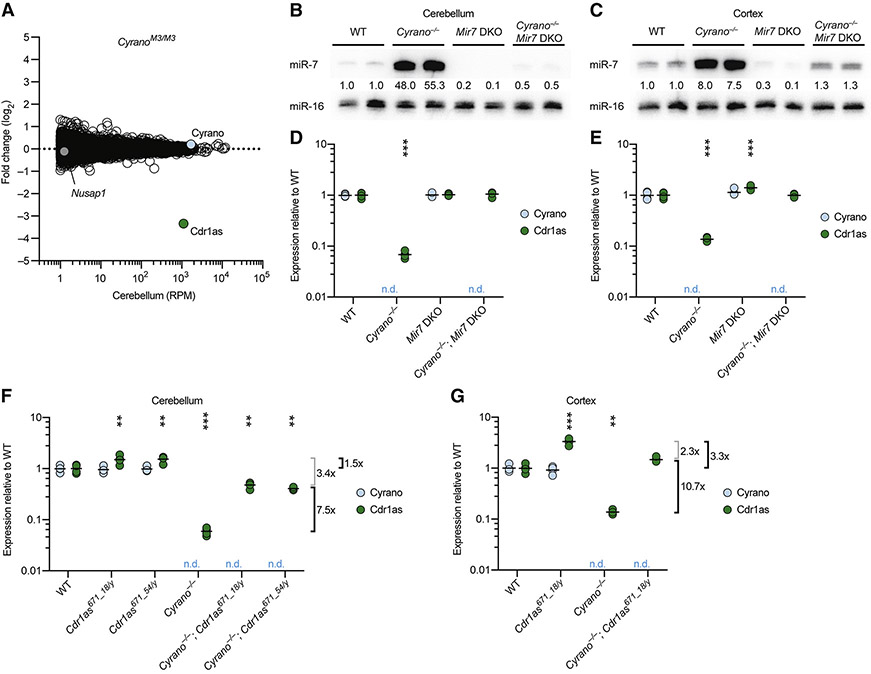
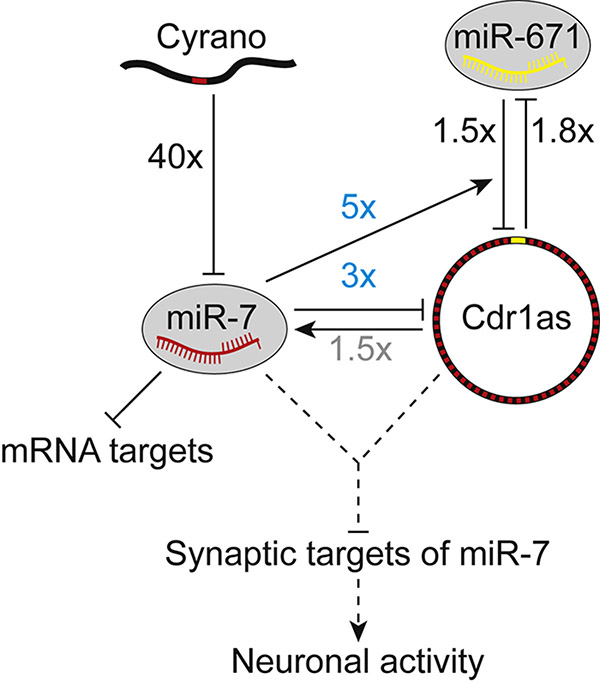
Noncoding RNAs (ncRNAs) play increasingly appreciated gene-regulatory roles. Here, we describe a regulatory network centered on four ncRNAs-a long ncRNA, a circular RNA, and two microRNAs-using gene editing in mice to probe the molecular consequences of disrupting key components of this network. The long ncRNA Cyrano uses an extensively paired site to miR-7 to trigger destruction of this microRNA. Cyrano-directed miR-7 degradation is much more effective than previously described examples of target-directed microRNA degradation, which come primarily from studies of artificial and viral RNAs. By reducing miR-7 levels, Cyrano prevents repression of miR-7-targeted mRNAs and enables accumulation of Cdr1as, a circular RNA known to regulate neuronal activity. Without Cyrano, excess miR-7 causes cytoplasmic destruction of Cdr1as in neurons, in part through enhanced slicing of Cdr1as by a second miRNA, miR-671. Thus, several types of ncRNAs can collaborate to establish a sophisticated regulatory network.

Keywords: TDMD; circRNA; lncRNA knockout; mammalian gene regulation; miRNA knockout; miRNA tailing; miRNA target-site disruption; miRNA trimming; noncoding RNA; regulatory network.


Figures

Figure 1.
Figure 1.. Cyrano Promotes miR-7 Destruction
(A) Organization, conservation and expression of the murine Cyrano locus. Shown below the gene model (black boxes, exons; > > >, introns; open triangles, loxP sites), are conservation plots (PhyloP and PhastCons), which are based on a 40-genome placental mammal alignment generated relative to the mouse locus (Pollard et al., 2010; Siepel et al., 2005). Diagramed below that is the pairing of miR-7 to its highly complementary site, located within the most conserved region of Cyrano. Shown above the gene model are RNA-seq tracks for wild-type, Cyrano−/− and CyranoM3/M3 cerebellum (y-axis, reads) derived from libraries with similar sequencing depths. (B) Influence of Cyrano on miRNA levels in cerebellum. Shown are log2-fold changes in mean miRNA levels observed between wild-type and Cyrano−/− cerebellum, as determined by small-RNA sequencing and plotted as a function of expression in wild-type cerebellum (n = 3 per genotype). Each circle represents one miRNA, showing results for all miRNAs expressed above 1 RPM (read per million miRNA reads) in wild-type cerebellum. Circles representing miR-7 paralogs, miR-7 passenger strands, and other indicated miRNAs are colored red, blue, and yellow respectively. (C) Influence of Cyrano on miRNA levels in hippocampus; otherwise, as in (B). (D) Influence of Cyrano on miR-7 levels in 12 mouse tissues. Plotted are mean levels of miR-7 per μg total RNA for wild-type (black) and Cyrano−/− (red) tissues, as determined by northern blots. For each tissue, 3–4 replicates of each genotype were analyzed alongside known quantities of miR-7 synthetic standards (error bars, s.d.). Statistically significant fold changes are indicated (*, p <0.05; **, p <0.01; ***, p <0.001, unpaired two-tailed t-test). (E) Influence of Cyrano on miRNA levels in K562 cells; otherwise, as in (B). See also Figures S1–S2 and Table S1.
Figure 2.
Figure 2.. The miR-7 Site in Cyrano Specifies miR-7 Degradation
(A) Schematic of wild-type and Cyrano mutant alleles that alter the extensively paired miR-7 site. Shown below the gene model and conservation tracks are the wild-type Cyrano miR-7 site and six mutant sites, M1–M6. The PAM motif used for mutagenesis is outlined (open gray box). Deleted nucleotides are indicated by dashes; an inserted nucleotide is colored red. The miR-7 extended seed is underlined. (B) Importance of the miR-7 site for Cyrano function in cerebellum. At the bottom is a representative northern blot measuring miR-7 levels in cerebellum of the lines described in (A). In each lane, the level of miR-7 was normalized to that of miR-16 and reported relative to wild-type. Plotted above are relative miR-7 levels determined from all replicates (black bars, mean; n = 4 per genotype). Statistically significant changes compared to wild type are indicated (***, p <0.001, ANOVA with Tukey’s test). The miR-7 level in M1 cerebellum also differed from that in Cyrano−/− (KO) and M2–M6 cerebellum (*, p <0.05, ANOVA with Tukey’s test). (C) Schematic of the wild-type CR1 (Cyrano conserved region) construct and constructs that changed its miR-7 site. The miR-7 site in the CR1 was mutated to either disrupt pairing to miR-7 or introduce an extensively complementary site to miR-16 or miR-17. (D) Importance of the complementary site for specifying CR1 function. At the left is a representative northern blot measuring miR-7, miR-16, and miR-17 levels in HEK293T cells transfected with the constructs described in (C). Below each panel, levels of miRNA are reported relative to levels in the control mCherry transfection after normalizing to the level of miR-103. Plotted at the right are relative levels of miR-7 (red), miR-16 (blue), and miR-17 (tan) (black bars, mean; n = 3). Statistically significant changes compared to the mCherry control are indicated (***, p <0.001, ANOVA with Dunnett’s test). See also Figure S3 and Table S2.
Figure 3.
Figure 3.. Cyrano Induces Tailing and Trimming of miR-7, but Tailing Appears Dispensable
(A) Influence of Cyrano on miR-7 tailing and trimming in hippocampus. Plotted are length distributions of miR-7 reads (left) and miR-92b reads (middle) from wild-type (black) and Cyrano−/− (red) tissue, indicating the mature species for each miRNA (M) (error bars, s.d.; n = 3 per genotype). Also plotted are the fractions of tailed miR-7 reads that were mono- or oligoadenylylated (right) in wild-type and Cyrano−/− tissue. (B) Influence of Gld2 on miR-7 tailing and trimming in hippocampus. Primary data from Mansur et al. (2016) were analyzed as in (A), with results for Gld2−/− tissue plotted in gray (n = 6 per genotype). See also Figure S4.
Figure 4.
Figure 4.. Loss of Cyrano Can Cause Increased miR-7 Target Repression
(A) Repression of predicted miR-7 targets by miR-7a-2 in pituitary. Plotted are cumulative distributions of mRNA fold changes observed after deleting Mir7a2 in pituitary (Ahmed et al., 2017), comparing the impact on all predicted miR-7 targets (light gray), conserved predicted miR-7 targets (dark gray), and top predicted miR-7 targets (black) to that of control mRNAs with no miR-7 site (blue). Median log2-fold changes for each set of mRNAs are indicated (colored dots below the x-axis). Statistical significance of differences between each set of predicted targets and control mRNAs was determined by the Mann–Whitney test. (B) Influence of Cyrano on predicted targets of miR-7 in skeletal muscle. Plotted are cumulative distributions of mRNA fold changes observed in skeletal muscle after disrupting Cyrano; otherwise, as in (A). (C) Influence of Cyrano on predicted targets of miR-7 in ten tissues. Plotted are median fold changes observed upon Cyrano disruption for the indicated sets of predicted miR-7 targets, normalized to the median fold change of control genes. For reference, effects of deleting Mir7a2 in pituitary, as evaluated in (A), are also shown (leftmost set of bars). For Cyrano-deficient tissues, the number of genes analyzed in each set ranged from 3008–4035 (all), 354–453 (conserved), 63–83 (top), and 1882–2531 (no site). Statistically significant changes from the control sets are indicated (*, p <0.05; **, p <0.01; ***, p <0.001, Mann–Whitney test).
Figure 5.
Figure 5.. Cyrano Enables Cdr1as to Accumulate in the Brain
(A) Influence of Cyrano on RNA levels in cerebellum. Shown are fold changes in mean RNA levels observed between wild-type and Cyrano−/− tissue (n = 4 per genotype), as determined by RNA-seq and plotted as a function of expression in wild-type tissue. Each circle represents a unique mRNA or noncoding RNA, showing results for all RNAs expressed above 1 RPM in wild-type tissue. Circles representing Cyrano, Cdr1as, and Nusap1 are colored and labeled. (B) Influence of Cyrano on Cdr1as expression in brain and pituitary. Levels of Cyrano (blue) and Cdr1as (green), as determined by RT-qPCR, were normalized to that of Actb and plotted relative to mean wild-type expression (black bars, mean; n = 4 per genotype; n.d., not detected). Statistically significant changes in Cdr1as levels in Cyrano−/− tissues compared to wild-type tissues are indicated (*, p <0.05; **, p <0.01; ***, p <0.001, unpaired two-tailed t-test). (C) Influence of Cyrano on Cdr1as expression in DIV11 CGNs, as determined by single-molecule FISH. Plotted are the number of Cyrano and Cdr1as molecules per cell for wild-type and Cyrano−/− CGNs. Each circle represents mean molecules per cell from a 100x microscopy field, each field containing 1–3 cells (n = 40 fields per genotype; black bars, mean). The mean of all fields for each genotype (± s.e.m.) is also reported. (D–E) Influence of Cyrano on accumulation of Cdr1as in neuronal cell bodies and processes. Shown is a representative image from single-molecule FISH experiments probing for Cdr1as in either wild-type (D) or Cyrano−/− (E) CGNs, with insets showing increased magnification of a portion of soma and processes (Cdr1as, black; nuclei, cyan; scale bar, 10 μm). Below each image is quantification from the same 40 fields quantified in (C), with each bar reporting mean molecules per cell, differentiating molecules located in nuclei (black), soma (excluding nuclei, dark gray), and processes (light gray), plotting at the far right of each panel the means ± s.e.m. See also Figure S5.
Figure 6.
Figure 6.. Cdr1as is Regulated by miR-7 and miR-671
(A) Influence of the Cyrano miR-7 site on RNA levels in cerebellum. Shown are fold changes in mean RNA levels observed between wild-type and CyranoM3/M3 cerebellum (n = 3–4 per genotype); otherwise, as in Figure 5A. (B–C) Substantially reduced miR-7 levels in brains of Mir7 DKO mice. Shown are northern blots measuring miR-7 levels in cerebellum (B) and cortex (C) of mice with the indicated genotypes. Levels of miR-7 were normalized to those of miR-16 and are reported relative to the mean wild-type level. (D–E) A requirement of miR-7 for Cdr1as reductions observed in mice without functional Cyrano. Levels of Cyrano (blue) and Cdr1as circRNA (green) in cerebellum (D) and cortex (E) of mice with the indicated genotypes were determined by RT-qPCR, normalized to Actb, and plotted relative to mean wild-type expression (black bars, mean; n = 4 per genotype; n.d., not detected). Statistical significance of the differences in Cdr1as level in each mutant tissue compared to that in wild-type tissue is indicated (***, p <0.001, ANOVA with Tukey’s test). (F–G) Influence of the miR-671 site within Cdr1as on Cdr1as levels both with and without functional Cyrano. Cyrano and Cdr1as in cerebellum (F) and cortex (G) of mice with the indicated genotypes were measured and plotted as in (D). Mean fold changes in Cdr1as attributable to the miR-671 site, either with or without functional Cyrano (black brackets), and not attributable to the miR-671 site (gray brackets) are indicated to the right of each plot. See also Figure S6 and Table S1.
Figure 7.
Figure 7.. A Network of Noncoding Regulatory RNAs Acts in the Mammalian Brain
For each interaction, the effect was measured using a mouse-knockout model that disrupted either the relevant ncRNA (either Cyrano, miR-7, or Cdr1as) or miRNA-binding site (either the miR-7 site in Cyrano or the miR-671 site in Cdr1as). Fold changes are from the cerebellum, observed either in this study (black or blue) or previously (gray, Piwecka et al., 2017). The 1.8-fold increase in miR-671 observed in our mice with a disrupted Cdr1as miR-671 site resembled that observed in Cdr1as-knockout mice (Piwecka et al., 2017). Regulation that emerges with derepression of miR-7 in cerebellum (as opposed to deletion of miR-7) is indicated (blue fold changes). Repression of miR-7 targets is also depicted, but without a fold change because it was detected only in other tissues. Speculative interactions are shown as dashed lines.

References

    1. Agarwal V, Bell GW, Nam JW, and Bartel DP (2015). Predicting effective microRNA target sites in mammalian mRNAs. eLife 4, e05005. - PMC - PubMed
    1. Ahmed K, LaPierre MP, Gasser E, Denzler R, Yang Y, Rulicke T, Kero J, Latreille M, and Stoffel M (2017). Loss of microRNA-7a2 induces hypogonadotropic hypogonadism and infertility. J. Clin. Invest 127, 1061–1074. - PMC - PubMed
    1. Ameres SL, Horwich MD, Hung JH, Xu J, Ghildiyal M, Weng Z, and Zamore PD (2010). Target RNA-directed trimming and tailing of small silencing RNAs. Science 328, 1534–1539. - PMC - PubMed
    1. Ameres SL, Hung JH, Xu J, Weng Z, and Zamore PD (2011). Target RNA-directed tailing and trimming purifies the sorting of endo-siRNAs between the two Drosophila Argonaute proteins. RNA 17, 54–63. - PMC - PubMed
    1. Anders S, Pyl PT, and Huber W (2015). HTSeq--a Python framework to work with high-throughput sequencing data. Bioinformatics 31, 166–169. - PMC - PubMed

Publication types