. 2018 Jul 12;174(2):325-337.e14.
doi: 10.1016/j.cell.2018.05.020. Epub 2018 Jun 7.

A Flat BAR Protein Promotes Actin Polymerization at the Base of Clathrin-Coated Pits

Affiliations

A Flat BAR Protein Promotes Actin Polymerization at the Base of Clathrin-Coated Pits

Leonardo Almeida-Souza et al. Cell. .

Abstract

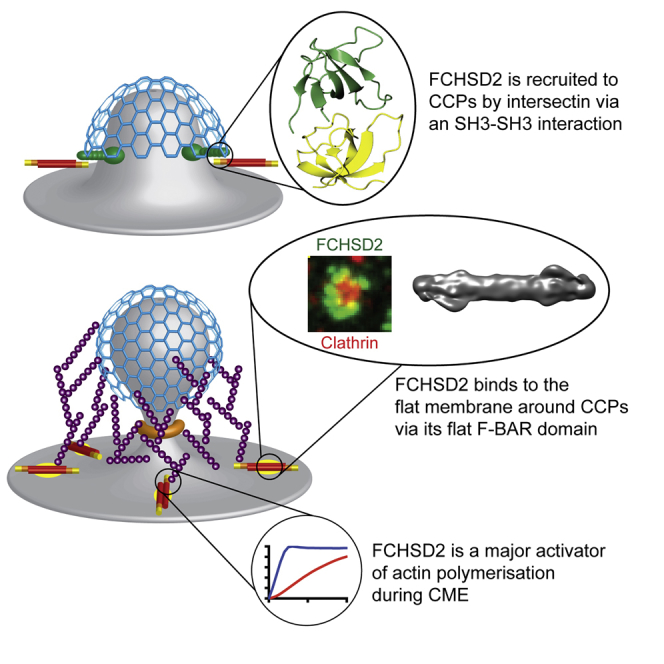
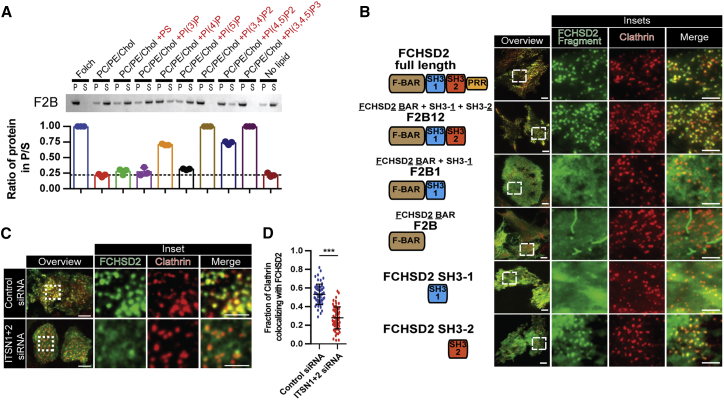
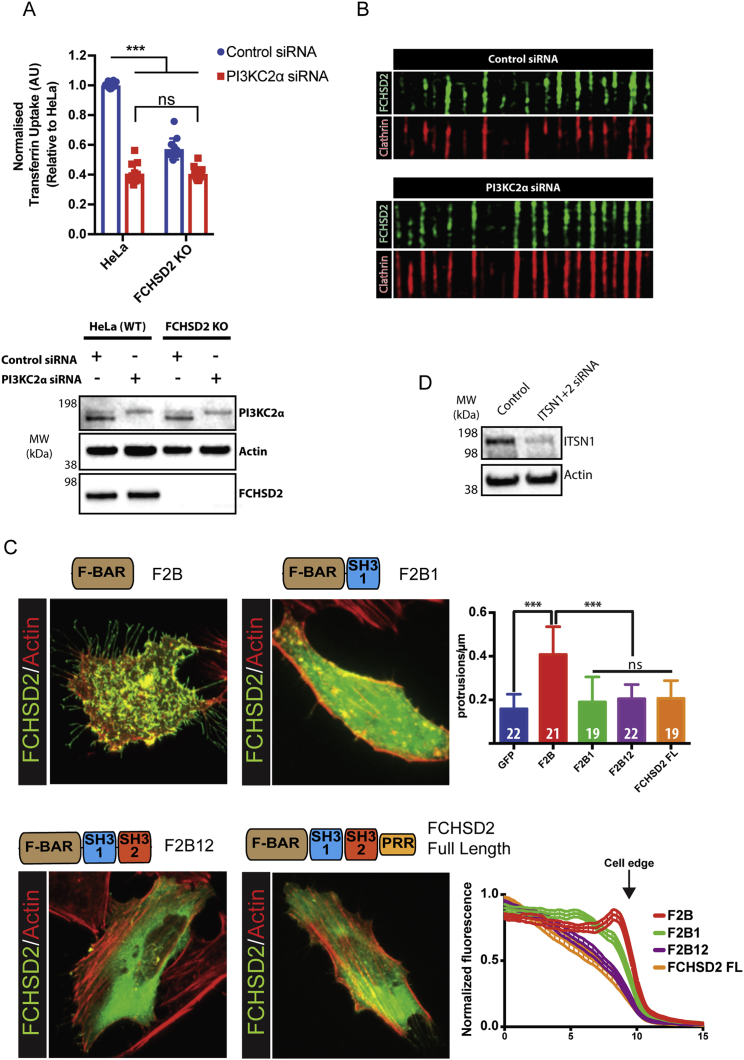
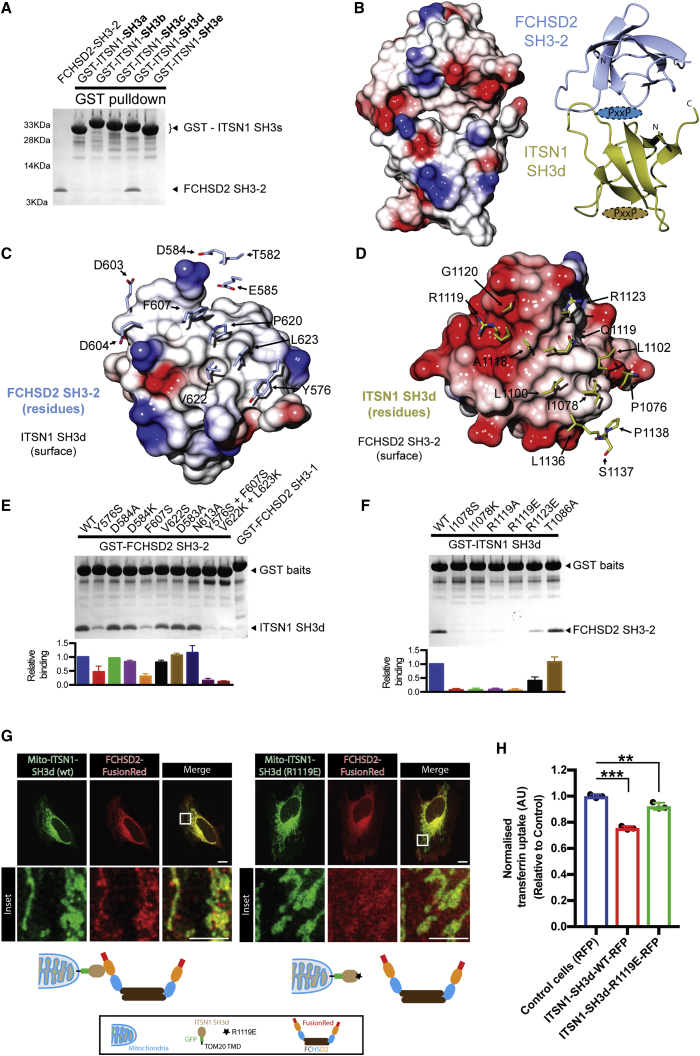
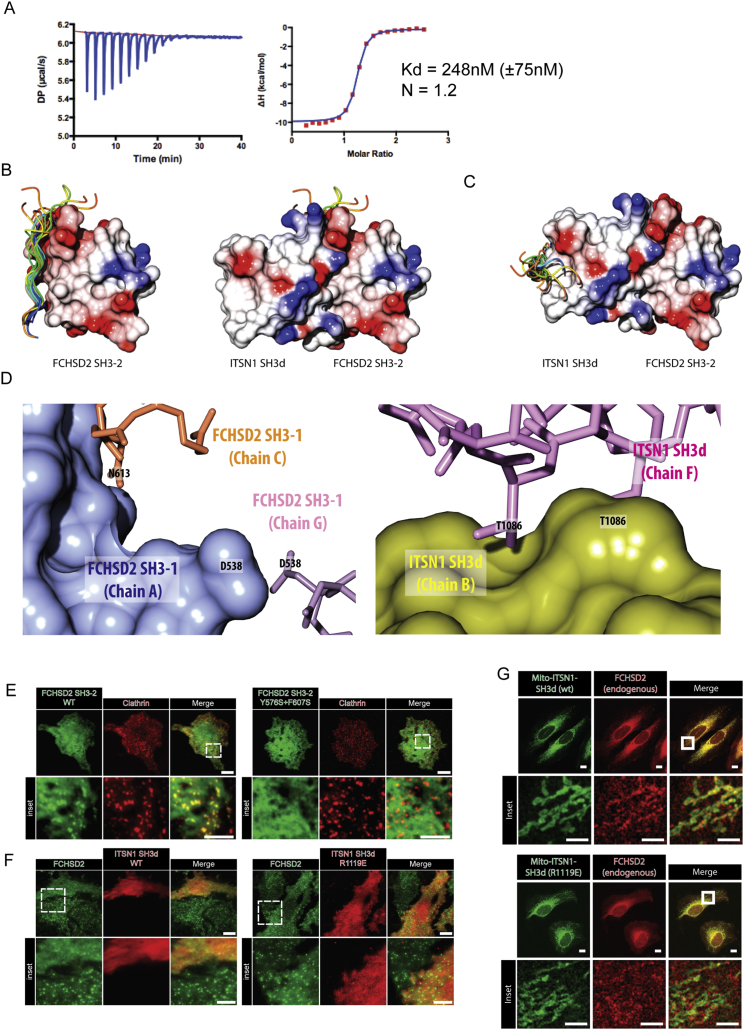
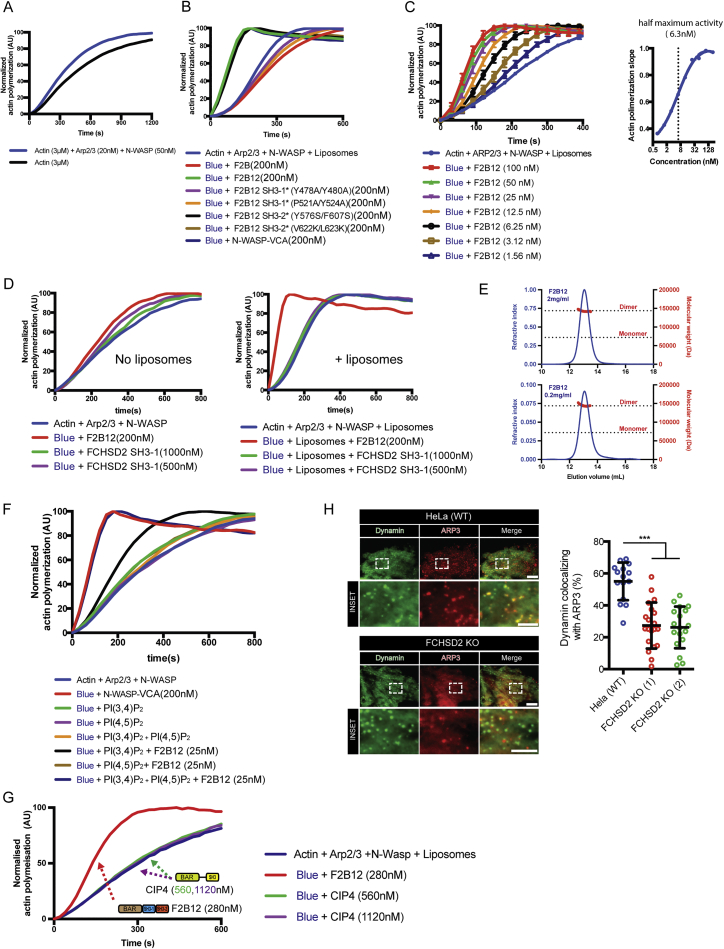
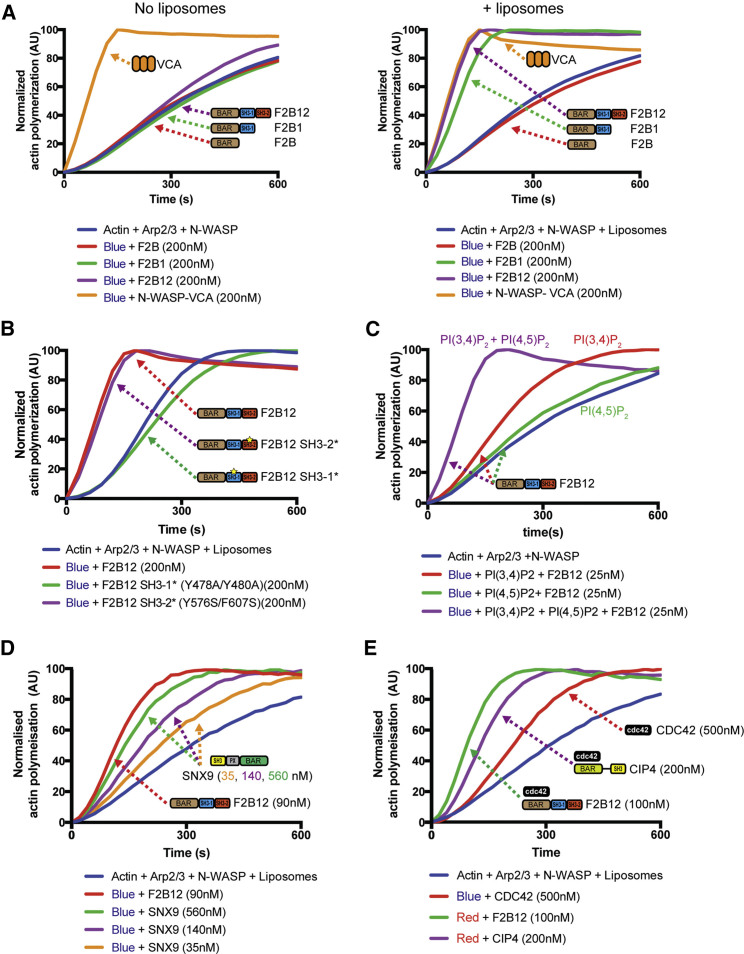
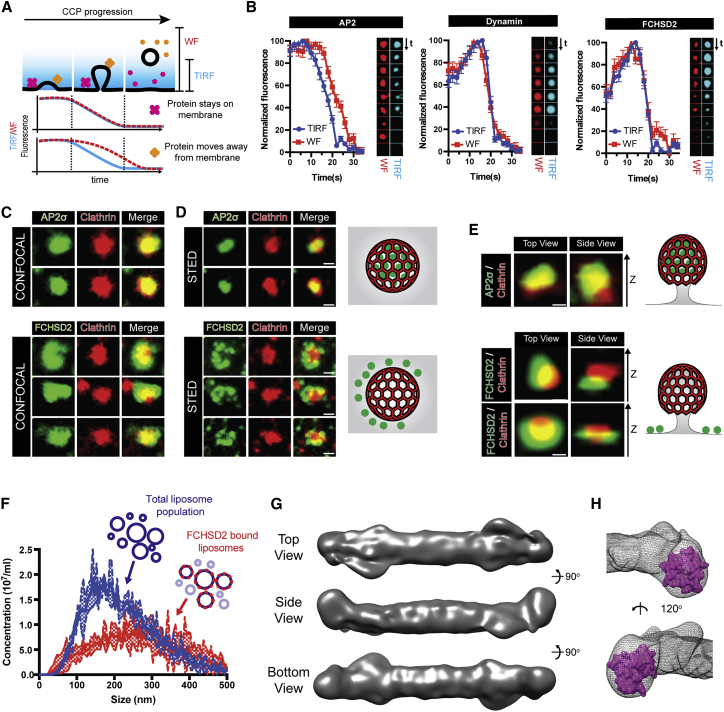
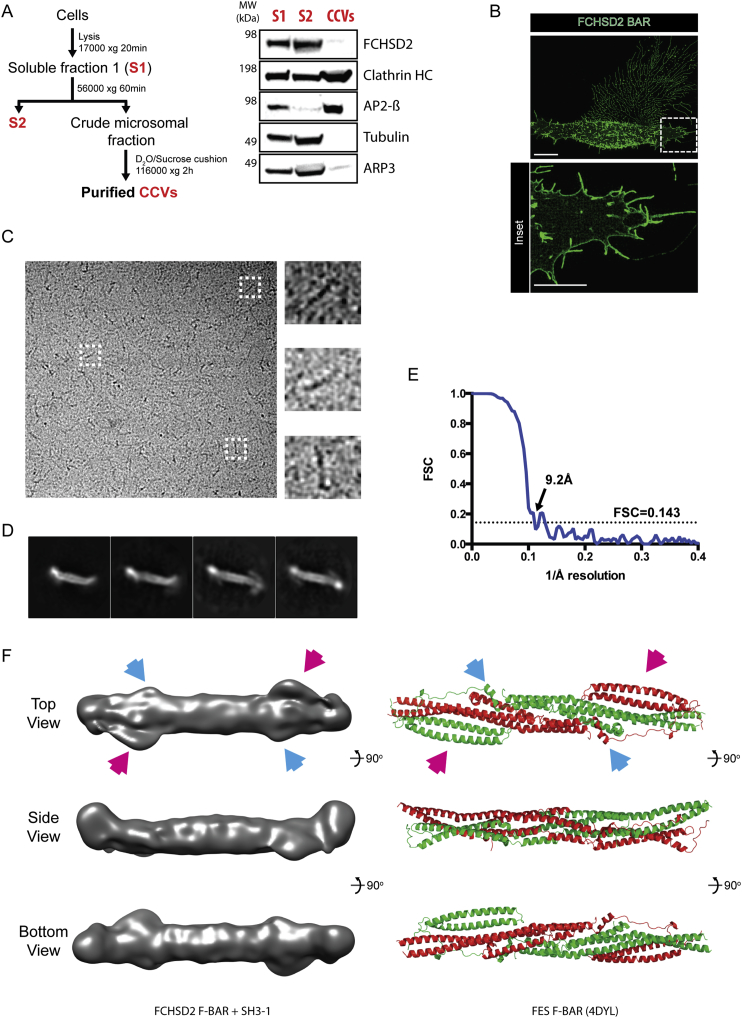
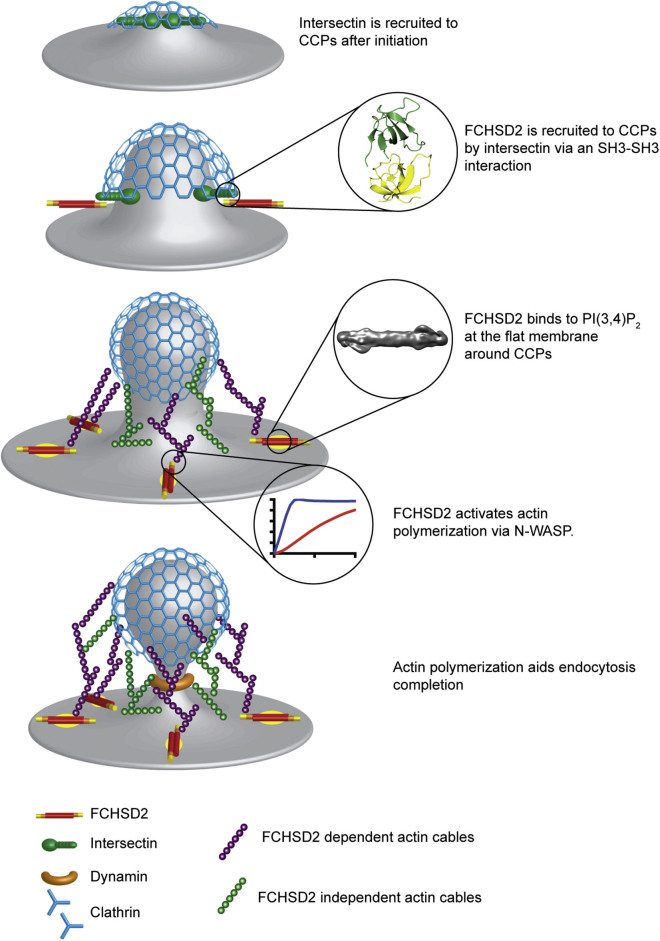
Multiple proteins act co-operatively in mammalian clathrin-mediated endocytosis (CME) to generate endocytic vesicles from the plasma membrane. The principles controlling the activation and organization of the actin cytoskeleton during mammalian CME are, however, not fully understood. Here, we show that the protein FCHSD2 is a major activator of actin polymerization during CME. FCHSD2 deletion leads to decreased ligand uptake caused by slowed pit maturation. FCHSD2 is recruited to endocytic pits by the scaffold protein intersectin via an unusual SH3-SH3 interaction. Here, its flat F-BAR domain binds to the planar region of the plasma membrane surrounding the developing pit forming an annulus. When bound to the membrane, FCHSD2 activates actin polymerization by a mechanism that combines oligomerization and recruitment of N-WASP to PI(4,5)P2, thus promoting pit maturation. Our data therefore describe a molecular mechanism for linking spatiotemporally the plasma membrane to a force-generating actin platform guiding endocytic vesicle maturation.

Keywords: ARP2/3; BAR domain; FCHSD2; N-WASP activation; Nervous Wreck; actin cytoskeleton; clathrin-mediated endocytosis; cytoskeletal forces; intersectin; membrane deformation.


Figures

None
Graphical abstract
Figure 1
Figure 1
FCHSD2 Is a Bona Fide CME Protein Responsible for a Major Fraction of the ARP2/3 Contribution to CME (A) Top: Scheme showing the domain organization of FCHSD proteins. Bottom: Immunoblots for N-WASP and Intersectin1 (ITSN1) from pull down experiments from brain extracts using GST-tagged FCHSD1 and FCHSD2 SH3 domains. Lower portion shows Coomassie staining of baits. (B) Immunofluorescence showing colocalization between endogenous FCHSD2 and clathrin heavy chain. (C) TIRF image showing colocalization of FCHSD2 and clathrin. HeLa cells stably expressing FCHSD2-Venus and transfected with mCherry-clathrin light chain. (D) Left: Examples of the dynamics of FCHSD2 with different CME proteins. HeLa cells stably expressing FCHSD2-Venus were transfected with mCherry-clathrinLC, FusionRed-ITSN1L, FusionRed-Dynamin1, or mCherry-ARP3 and imaged live by TIRF microscopy. Time zero was set as the peak of FCHSD2 recruitment. Events are pseudocolored to match graphs on the right. Right: Summary graphs for the timing of recruitment of FCHSD2 versus CME proteins (n = 90, 48, 120, and 144 events for FCHSD2/clathrin, FCHSD2/ITSN1L, FCHSD2/Dynamin, and FCHSD2/ARP3, respectively). Full data including error bars are shown in Figure S1A. (E) Transferrin uptake assay by flow cytometry. Uptake measurements were normalized as described in STAR Methods. Each value represents median fluorescence from at least 5,000 cells (n = 10, mean ± SD). (F) Left: Kymographs of BSC1 AP2σ2-GFP cells silenced for FCHSD2 or ARP3 and control cells. Kymographs generated from 120 s videos at 1 Hz (or 180 s at 1 Hz in the case of ARP3 small interfering RNA [siRNA] cells). Right: Quantification of AP2σ2 lifetime for each condition. Only events longer than 20 s were considered (n = 329, 870, and 227 events for control, FCHSD2 KD, and ARP3 KD, respectively, mean ± SD). (G) CCP morphological quantification for control HeLa and FCHSD2 KD and KO cells (n = 100, 71, 101, and 70 CCPs for control, shRNA, KO(1), and KO(2) cells, respectively). (H) Transferrin uptake assay by flow cytometry comparing wild-type and FCHSD2 KO (2) cells silenced for ARP3. Uptake measurements were normalized as described in the STAR Methods. Each value represents median fluorescence from at least 5,000 cells (n = 6, mean ± SD). ∗∗∗p > 0.001, ∗∗p > 0.01, p > 0.01, one-way ANOVA with Tukey’s post hoc analysis. Scale bars, 10 μm in overviews, 5 μm in insets. See also Figures S1 and S2 and Videos S1 and S2 and Videos S1 and S2.
Figure S1
Figure S1
FCHSD2 Is a Bona Fide CME Protein, Related to Figure 1 (A) Graphs for the recruitment dynamics of FCHSD2 versus ClathrinLC, Dynamin1, ITSN1L and ARP3. Number of events measured are shown at the top left of each graph. Data are presented as mean ± SD. (B) Immunoblots for FCHSD2 showing both FCHSD2 CRISPR/Cas9 knockout clones used and the rescue cell line (FCHSD2 KO-1 stably expressing untagged FCHSD2). (C) Increased surface and total transferrin receptor (TFR) in FCHSD2 knockout cells shown by immunofluorescence (left), immunoblots (center) and flow cytometry (right). Each value represents median fluorescence from at least 5000 cells (n = 3, mean ± SD). ∗∗p > 0.01, p > 0.05. One-way ANOVA with Tukey’s post hoc analysis. (D) Immunoblots showing FCHSD2 knockdown in BSC1 AP2σ2-GFP cells. (E) Immunoblots showing ARP3 knockdown in wild-type and FCHSD2 KO cells. (F) Immunoblots showing ARP3 knockdown in BSC1 AP2σ2-GFP cells.
Figure S2
Figure S2
FCHSD2 Depletion Reduces Integrin Uptake and Affects Cell Migration, Related to Figure 1 (A) FCHSD2 localizes to disassembling focal adhesions. Left: Overview of cell expressing FCHSD2-Venus, mCherry-ClathrinLC and Integrin β3-BFP. Center: Image series of region marked in (left). The accumulation of FCHSD2 and clathrin occurs only at disassembling focal adhesions. Right: Kymograph showing FCHSD2 and clathrin advancing in a disassembling focal adhesion. Image series generated at 0.5 frame/minute. (B) FCHSD2 depletion reduces integrin β1 uptake. Top left: pictorial explanation of the experimental design used for the antibody (Ab)-feeding assay. Bottom left: representative images of the antibody feeding assay results. Cell boundaries are shown in yellow and internalised antibody signal is shown in white. Right: quantification of the antibody feeding assay using an antibody recognizing an active form of Integrin β1 (12G10). n = 27, 56, 53 (control); 27, 59, 80 (shRNA); 16, 61, 60 (FCHSD2 KO-1); 43, 51, 71 (FCHSD2 KO-2), mean ± SD. ∗∗∗p > 0.001, ∗∗p > 0.01. One-way ANOVA with Tukey’s post hoc analysis. (C) Integrin β1 uptake experiment performed by flow cytometry. For this experiment we used labeled Integrin β1 (12G120) antibody (Alexa 488). Each value represents median fluorescence from at least 5000 cells (n = 4, mean ± SD). ∗∗∗p > 0.001, ∗∗p > 0.01, p > 0.05. One-way ANOVA with Tukey’s post hoc analysis. (D) Wound healing migration assay. Left: Representative images of control and knockout cells at time zero and at 24hs after wounding. Cell area is masked in yellow. Right: quantification of wound area closure over time (mean ± SD).
Figure 2
Figure 2
Intersectin Recruits FCHSD2 to CCPs (A) Lipid preference for FCHSD2 using liposome-pelleting assays. Liposome base mixture of PC, PE, and cholesterol was supplemented with PS or phosphoinositols (PIPs). After incubation with FCHSD2 BAR (F2B), the liposomes were pelleted by ultracentrifugation. P, pellet fraction; S, supernatant fraction. Dashed horizontal line represents the level of protein alone that pellets under the experimental conditions (n = 3 experiments, mean ± SD). (B) TIRF images of HeLa cells transfected with mCherry-clathrinLC and various GFP-tagged FCHSD2 truncation constructs. The domain arrangement for each construct with their respective nomenclature is shown on the left. (C) TIRF images of HeLa cells stably expressing FCHSD2-Venus and mCherry-clathrinLC transfected with a non-targeting control siRNA or siRNA for intersectins (ITSN1+ITSN2). (D) Quantification of the fraction of clathrin punctae colocalizing with FCHSD2 punctae on control and ITNS1+2 KD cells (n = 60, 75 cells for control siRNA and ITSN1+2 siRNA respectively; mean ± SD). ∗∗∗p > 0.001, t test. Scale bars, 10 μm in overviews, 5 μm in insets. See also Figure S3.
Figure S3
Figure S3
FCHSD2 Is Not Directly Recruited to CCPs by PI3KC2α or Its Kinase Activity, Related to Figure 2 (A) Top: Transferrin uptake assay by flow cytometry comparing wild-type and FCHSD2 KO cells silenced for PI3KC2α. Uptake of Alexa488 labeled transferrin normalized by the amount of surface transferrin receptor for each condition and against uptake for the wild-type cells in each experiment. Each value represents median fluorescence from at least 5000 cells (n = 12, mean ± SD). ∗∗∗p > 0.001, ns = non-significant. One-way ANOVA with Tukey’s post hoc analysis. Bottom: Immunoblots showing PI3KC2α knockdown in wild-type and FCHSD2 KO cells. (B) Kymographs of HeLa FCHSD2-Venus stables silenced for PI3KC2α and control cells. Cells were transfected with mCherry-ClathrinLC 24 hs before imaging. Kymographs generated from 120 s movies at 1Hz. Note the elongated CCP lifetimes in PI3KC2α knockdown cells as described in Posor et al. (2013). (C) Autoinhibition of FCHSD2. Representative images of a center slice from cells expressing different FCHSD2 truncation constructs and co-stained with phalloidin (Actin). The bar graph (upper right) shows the quantification of cellular protrusions/μm for each construct. The non-inhibited BAR domain produces many protrusions. Numbers inside bars represent number of cells measured. The line graph (bottom right) shows the fluorescence profile of sum intensity projections for cells expressing each construct. Due to the natural thinning of cells from their centers to the edge, a gradually decaying line indicates that the fluorescent protein is primarily cytosolic while a flat line with an abrupt fall on the cell edge indicates that the fluorescent protein is primarily bound to the membrane. While the presence of SH3-1 significantly reduces the generation of cellular protrusions generated by the FCHSD2 F-BAR, a significant fraction of the protein remains bound to the membrane (green line). Only the combined presence of SH3-1 and SH3-2 is capable to avoid promiscuous binding of the BAR domain to the membrane. Data is shown as mean ± SD in bar graph and as ± SEM in fluorescence profiles. ∗∗∗p > 0.001, ns = non-significant. One-way ANOVA with Tukey’s post hoc analysis. (D) Immunoblots for intersectin knockdown in FCHSD2-Venus HeLa cells.
Figure 3
Figure 3
FCHSD2 Binds to Intersectin via an SH3-SH3 Interaction (A) Coomassie stained gel of GST pull-down experiments using individual ITSN1 SH3 domains as baits to bind to FCHSD2 SH3-2. (B) Overview of the co-crystal structure of the complex FCHSD2 SH3-2 and ITSN1-SH3d. Electrostatic surface (left) and backbone trace (right) of the complex. FCHSD2 SH3-2 is on top (in blue) and ITSN1-SH3d is on the bottom (in gold). Ovals with PxxP represent canonical proline-rich peptide binding surfaces for FCHSD2 SH3-2 (in blue) and ITSN1 SH3d (in gold). (C and D) Interaction surface of the FCHSD2 SH3-2/ITSN1-SH3d complex. Only the residues within contact distance (<4 Å) are shown for FCHSD2 SH3-2 (C, in blue) or ITSN1 SH3d (D, in gold). (E and F) Top: Coomassie stained gels for pull-down experiments using individual FCHSD2 SH3-2 (E) or ITSN1 SH3d (F) mutants of the interaction surface (and controls). Bottom: Quantification of the interaction of FCHSD2 SH3-2 mutants with ITSN1 SH3d (E) and ITSN1 SH3d mutants with FCHSD2 SH3-2 (F) (n = 3 experiments, mean ± SD). (G) Top: Confocal slice of HeLa cells transfected with FCHSD2-FusionRed plus mitochondrially targeted wild-type or interface mutant of ITSN1 SH3d. Bottom: Schematic explanation of the experiment. TOM20 TMD, TOM20 transmembrane domain. Scale bars, 10 μm in overviews, 5 μm in insets. (H) Transferrin uptake assay by flow cytometry comparing cells expressing RFP or RFP-ITSN1 SH3d (wild-type [WT] or interface mutant). Measurements were made from cells with high RFP signal. Results were normalized by the amount of surface transferrin receptor for each condition and against uptake for the RFP transfected cells. (n = 3 experiments with >5,000 gated cells, mean ± SD). ∗∗∗p > 0.001, ∗∗p > 0.01, one-way ANOVA with Tukey’s post hoc analysis. See also Figure S4 and Table S1.
Figure S4
Figure S4
FCHSD2 Binds to Intersectin via an SH3-SH3 Interaction, Related to Figure 3 (A) Binding affinity for the FCHSD2 SH3-2 / ITSN1 SH3d interaction measured by isothermal titration calorimetry (ITC). (B) To highlight the canonical proline-binding interface of FCHSD2 SH3-2, it was aligned with 17 available structures of SH3 domains and their peptides (Structures used: 1N5z, 1sem, 1cka, 1abo, 1bbz, 1n5z, 1uj0, 1w70, 1ywo, 2df6, 2d1x, 2j71, 2o9v, 2vkn, 2v1r, 3u23, 4f14). Left: The structural alignment reveals the interface where proline-rich peptides (shown as ribbons) bind on FCHSD2 SH3-2 (shown as surface). Right: The ITSN1 SH3d (also shown as surface) binds to the canonical proline-binding interface of FCHSD2. (C) The ITSN1 SH3d was aligned to the same 17 structures as above. The structural alignment reveals that the interaction to FCHSD2 SH3-2 does not involve the proline-binding interface of ITSN1 SH3d. (D) Structural localization of residues used as negative control mutants. Localization of residues D538 and N613 in FCHSD2 SH3-1 (left) and T1086 in ITSN1 SH3d (right) forming homotypical crystal contacts. One of the chains is represented as surface to facilitate visualization. (E) TIRF images of HeLa cells transfected with mCherry-ClathrinLC plus wild-type or interface mutant of GFP-FCHSD2 SH3-2 (Y576S+F607S). The interface mutant does colocalize with clathrin punctae. (F) TIRF images of FCHSD2-Venus stable cells transfected with wild-type or interface mutant GFP-ITSN1 SH3d (R1119E). The wild-type construct act as dominant negative and displaces FCHSD2 from membrane punctae while the interface mutant does not. (G) Images of endogenous FCHSD2 staining in HeLa cells transfected with mitochondrially targeted wild-type or interface mutant of ITSN1 SH3d (R1119E). Scale bars = 10μm in overviews, 5μm in insets.
Figure S5
Figure S5
FCHSD2 Activates Actin Polymerization at CCPs, Related to Figure 4 (A) Comparison between polymerization reactions with actin alone and the minimal components Actin, ARP2/3 and N-WASP. (B) Full experiment as shown in Figure 4B including additional controls. (C) FCHSD2 strongly activates actin polymerization in the presence of liposomes. Left: Actin polymerization experiments using different FCHSD2 (F2B12 fragment) concentrations. Right: fitting of actin polymerization slopes versus F2B12 concentration. Vertical dashed line shows the half-maximum activity (6.3nM) (n = 3 experiments, mean ± SD). (D) The SH3-1 domain of FCHSD2 does not activate actin polymerization alone. Actin polymerization experiments using FCHSD2 SH3-1 at 500nM and 1μM in the absence (left) or presence of liposomes (right). The F2B12 fragment was used as a control. (E) SEC-MALS for FCHSD2 (F2B12 construct). Elution profiles and molecular weight determination for two concentrations of protein as indicated. Horizontal dotted lines indicate the predicted monomeric (71KDa) and dimeric (142KDa) masses of F2B12. Note that indicated protein concentrations refer to injected proteins. At elution volume, a 10-fold dilution is expected. (F) Full experiment as shown in Figure 4C including additional controls. (G) Actin polymerization experiment showing that CIP4 cannot activate actin polymerization without cdc42. (H) Effect of FCHSD2 knockout on ARP3 recruitment to CCPs. Images are time projections (20 s) of GFP-Dynamin and mCherry-ARP3. Right: Quantification of the percentage of Dynamin punctae colocalizing with ARP3 in control and FCHSD2 KO cells. (n = 15, 20, 18 cells for control, FCHSD2 KO(1) and FCHSD2 KO(2) respectively). Scale bars = 10μm in overviews, 5μm in insets. Data is displayed as mean ± SD. ∗∗∗p > 0.001, One-way ANOVA with Tukey’s post hoc analysis.
Figure 4
Figure 4
FCHSD2 Activates Actin Polymerization at CCPs All actin polymerization reactions were performed using 3 μM actin, 25 nM ARP2/3, and 50 nM N-WASP. Liposomes were used at 12.5 μM. The nomenclature for the fragments used is the same as in Figure 2B. (A) Actin polymerization experiments using different FCHSD2 truncations in the absence (left) and presence (right) of liposomes (Folch lipids, extruded with 800 nm filters). (B) Actin polymerization experiments using mutants disrupting the proline-binding pocket of SH3-1 and SH3-2. Full experiment including additional controls and one extra set of mutants is shown in Figure S5B. (C) Actin polymerization experiments using liposomes with different phosphatidylinositol composition. The full experiment including additional controls is shown in Figure S5F. (D and E) Actin polymerization experiments comparing the activity of FCHSD2 with SNX9 (D) and CIP4 in the presence of cdc42 (E). See also Figure S5.
Figure 5
Figure 5
FCHSD2 Localizes to the Plasma Membrane Side of CCPs (A) Sequential widefield (WF) and TIRF imaging of endocytic proteins allows the distinction between proteins that stay on the membrane and proteins that move away from the membrane. (B) Results for AP2, dynamin, and FCHSD2 using the experimental paradigm explained in (A). Image series of representative events generated from videos at 0.5 Hz. (n = 54, 51, and 53 events for AP2, dynamin, and FCHSD2 respectively, mean ± SEM). (C–E) Comparative localization of AP2 and FCHSD2 with CCPs by confocal (C), STED (D), and 3D STED (E) microscopy. Stable HeLa cells for AP2σ2-GFP and FCHSD2-Venus cells were stained with anti-GFP and anti-Clathrin antibodies. Cartoon representations of the views are shown on the right hand side of super resolution images. Scale bars, 0.25 μm. (F) Curvature preference of FCHSD2 BAR by nanoparticle tracking analysis (NTA). Graph showing the size distribution of the total liposome population and the FCHSD2 BAR-sfGFP bound subpopulation. Total population distribution is measured by tracking particles diffracting light while FCHSD2 bound population is measured by tracking particles emitting light from GFP excitation. FCHSD2 BAR-sfGFP added at 1 nM (n = 3 experiments, mean ± SD). (G and H) Single particle cryoEM of F2B1 (FCHSD2 F-BAR+SH3-1). (G) 3D reconstruction from 30,207 particles. (H) The densities at the tip of the 3D map are compatible with an SH3 domain. In magenta is a surface representation of the FCHSD2 SH3-1 NMR structure (PDB: 2DL5). See also Figure S6.
Figure S6
Figure S6
The FCHSD2 F-BAR Is Flat, Related to Figure 5 (A) Left: Simplified CCV purification protocol. Fractions in red were used for western blot. Right: western blot from CCV purification. 20μg of each fraction per lane. Note the enrichment of typical CCV markers (Clathrin and AP2 beta) in purified vesicles and the deenrichment for FCHSD2, tubulin and ARP3. (B) Super resolution Structured Illumination Microscopy (SIM) of overexpressed GFP tagged FCHSD2 F-BAR showing plasma membrane coating and the formation of cellular protrusions. Scale bars = 10μm in overview, 5μm in inset. (C) Representative electron micrograph and three examples of F2B1 particles on the right. (D) Selected 2D averages used for 3D reconstruction. (E) Estimation of the average resolution of the cryo-EM 3D reconstruction on the basis of the gold standard FSC criteria of 0.143. (F) Comparison between our F2B1 3D model (left) and the Fes F-BAR structure (PDB: 4DYL). Arrows point to similar features between the FCHSD2 F-BAR and the FES F-BAR.
Figure 6
Figure 6
Model for FCHSD2 Function in CME See text for details.

References

    1. Battye T.G.G., Kontogiannis L., Johnson O., Powell H.R., Leslie A.G.W. iMOSFLM: a new graphical interface for diffraction-image processing with MOSFLM. Acta Crystallogr. D Biol. Crystallogr. 2011;67:271–281. - PMC - PubMed
    1. Boucrot E., Pick A., Çamdere G., Liska N., Evergren E., McMahon H.T., Kozlov M.M. Membrane fission is promoted by insertion of amphipathic helices and is restricted by crescent BAR domains. Cell. 2012;149:124–136. - PMC - PubMed
    1. Boulant S., Kural C., Zeeh J.-C., Ubelmann F., Kirchhausen T. Actin dynamics counteract membrane tension during clathrin-mediated endocytosis. Nat. Cell Biol. 2011;13:1124–1131. - PMC - PubMed
    1. Collins A., Warrington A., Taylor K.A., Svitkina T. Structural organization of the actin cytoskeleton at sites of clathrin-mediated endocytosis. Curr. Biol. 2011;21:1167–1175. - PMC - PubMed
    1. Coutinho-Budd J., Ghukasyan V., Zylka M.J., Polleux F. The F-BAR domains from srGAP1, srGAP2 and srGAP3 regulate membrane deformation differently. J. Cell Sci. 2012;125:3390–3401. - PMC - PubMed

Publication types

MeSH terms