

Identification of a biliverdin geometric isomer by means of HPLC/ESI-MS and NMR spectroscopy. Differentiation of the isomers by using fragmentation "in-source"
- PMID: 29887645
- PMCID: PMC5972171
- DOI: 10.1007/s00706-018-2161-7
Identification of a biliverdin geometric isomer by means of HPLC/ESI-MS and NMR spectroscopy. Differentiation of the isomers by using fragmentation "in-source"
Abstract
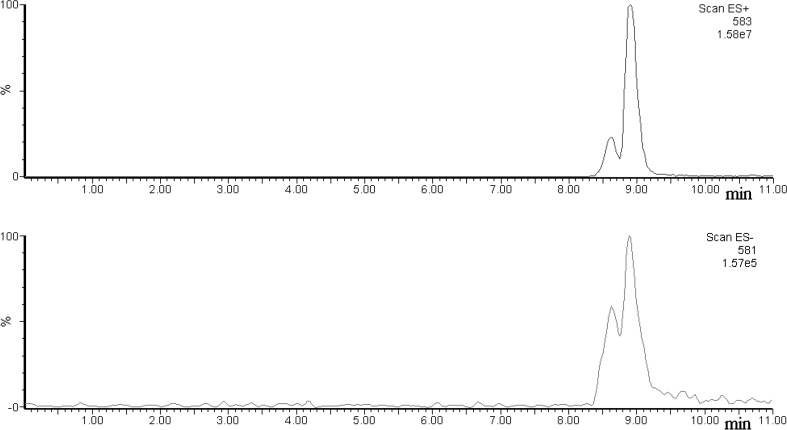
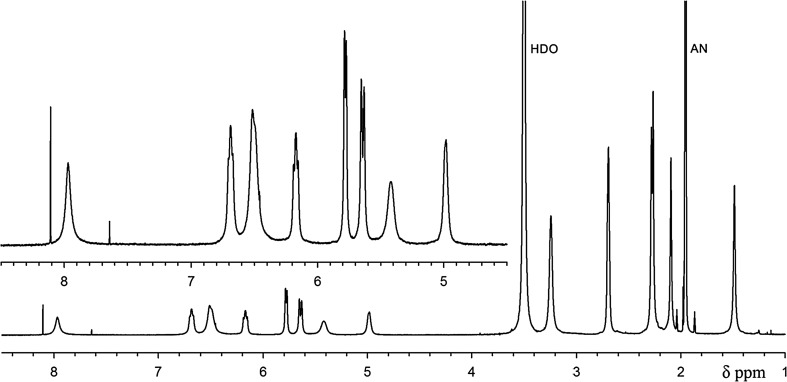
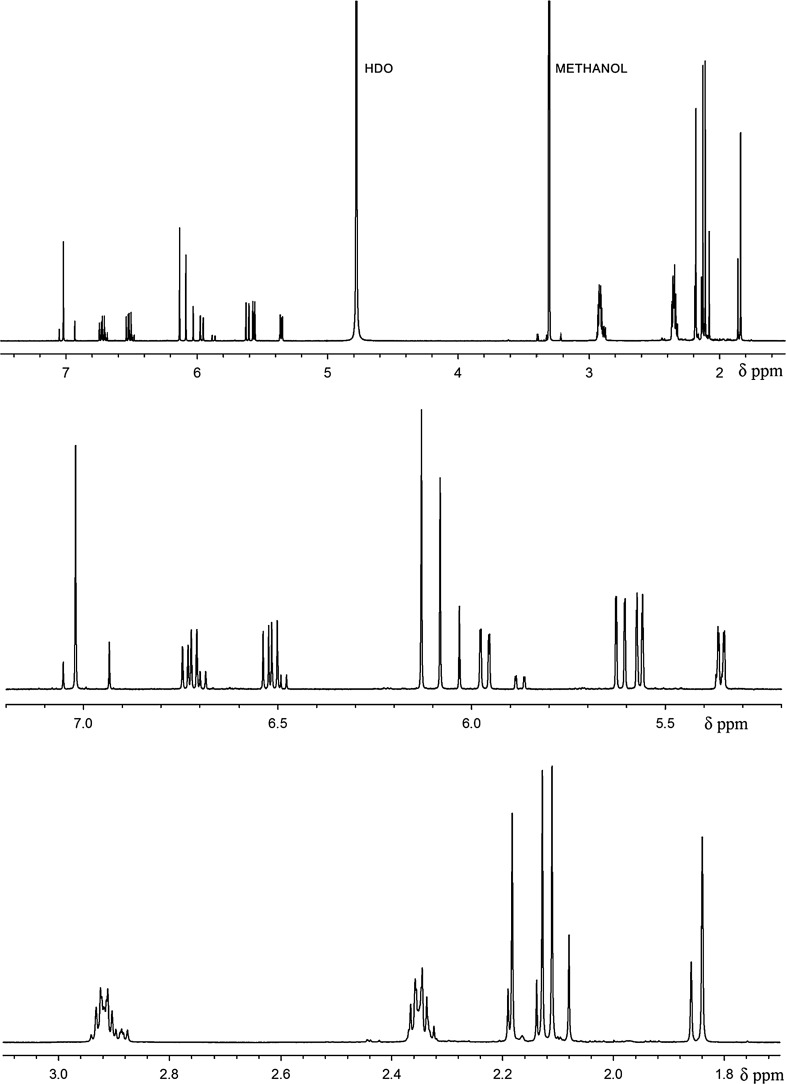
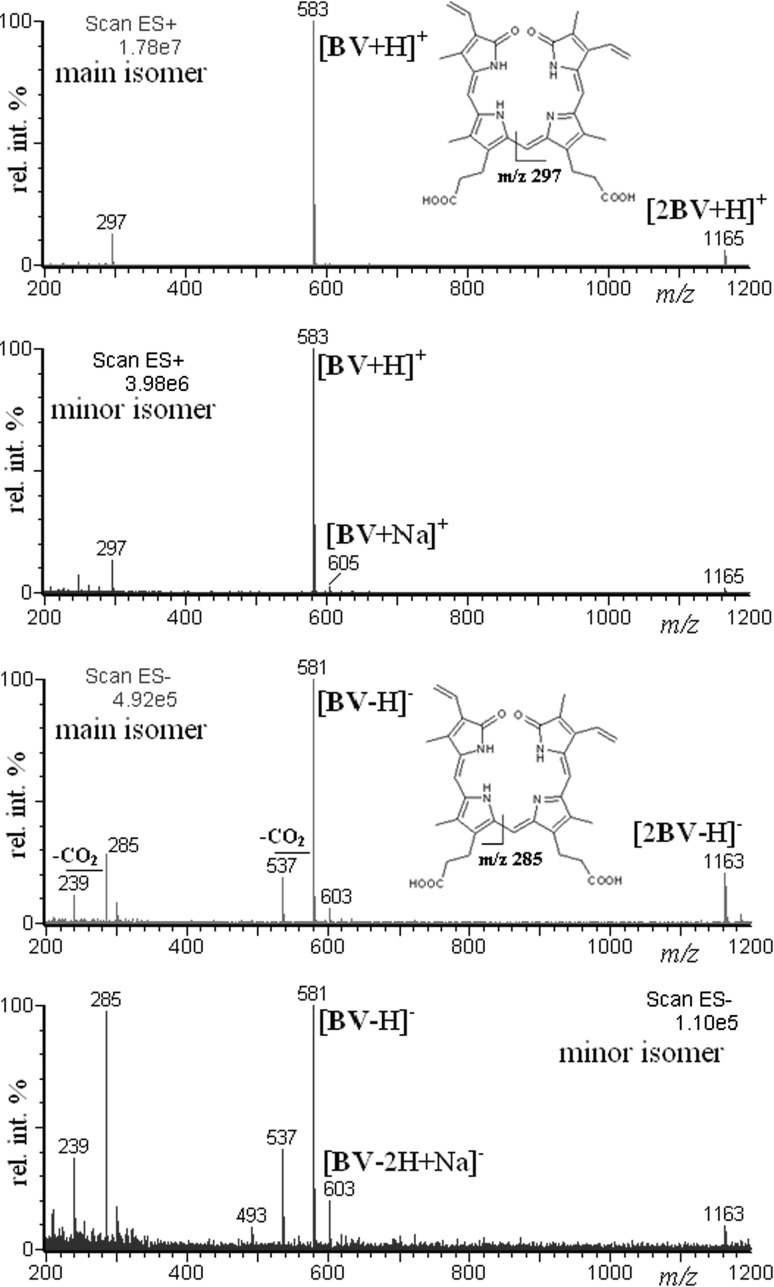
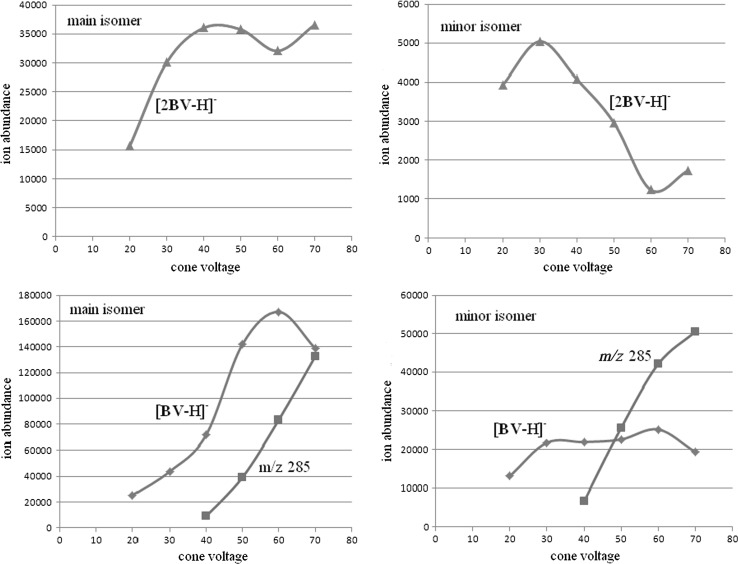
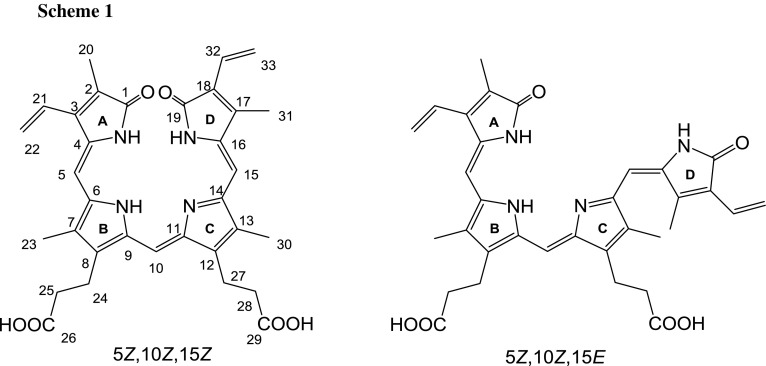
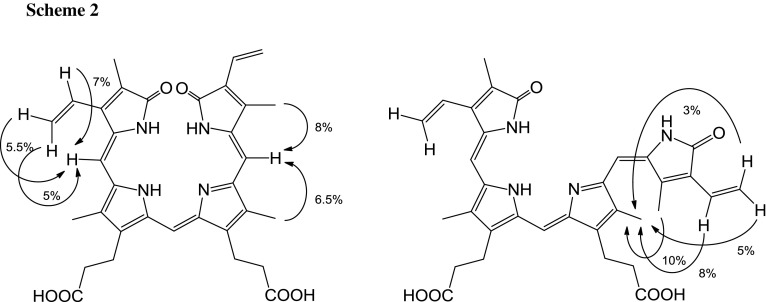
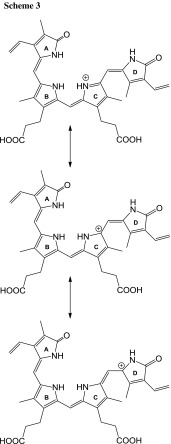
Abstract: A commercially available biliverdin sample was analyzed by means of HPLC/ESI-MS and NMR spectroscopy. It was been found that beside the main IXα 5Z,10Z,15Z isomer, the sample contains also the geometric isomer IXα 5Z,10Z,15E. It was also found the isomers behave differentially upon "in-source" fragmentation in negative ion mode (in contrast to the their behavior upon "in-source" fragmentation in positive ion mode and to their behavior upon MS/MS fragmentation in both modes): the relative abundances of deprotonated molecules and fragment ions are significantly different for both isomers, which can be used as an analytical tool to differentiate between the isomers.
Keywords: Biliverdin; Electrospray ionization; Geometric isomer; Mass spectrometry; NMR spectroscopy.
Figures
References
-
- Suzuki Y, Sakagishi Y. Anal Sci. 1995;11:699. doi: 10.2116/analsci.11.699. - DOI
LinkOut - more resources
Full Text Sources
Other Literature Sources