. 2018 May 15;10(5):1357-1372.
eCollection 2018.

Targeting CAND1 promotes caspase-8/RIP1-dependent apoptosis in liver cancer cells

Affiliations

Targeting CAND1 promotes caspase-8/RIP1-dependent apoptosis in liver cancer cells

Zhihui Che et al. Am J Transl Res. .

Abstract

Cullin-associated NEDD8-dissociated 1 (CAND1) plays a vital role in regulating the activity of Cullin-RING ubiquitin ligases (CRLs), which are frequently dysregulated in cancer. However, the role of CAND1 in hepatocellular carcinoma (HCC) remains unknown. Here, we found that CAND1 was overexpressed in HCC tissues compared to corresponding adjacent liver tissues (71.7% vs 16.7%); high expression of CAND1 was associated with poor overall survival (40.7 vs 57.3 months, P=0.0013); and CAND1 was an independent risk factor for the prognosis of HCC patients (N=138, P=0.018). Functional studies revealed that CAND1 knockdown efficiently suppressed the proliferation of liver cancer cells by activating caspase-8-dependent mitochondrial apoptosis. We also observed a mutual activation loop between caspase-8 and Receptor Interacting Protein 1 (RIP1), which amplified CAND1 knockdown-induced apoptotic signals in the cells. Furthermore, RIP1 inhibitor Necrostatin-1 eliminated the activation of caspase-8. In conclusion, our study pioneered in reporting high CAND1 expression as a predictor of poor prognosis for HCC patients. CAND1 silencing suppressed HCC cell proliferation by inducing caspase-8/RIP1-dependent apoptosis. These findings supported that CAND1 could be a new therapeutic target for liver cancer.

Keywords: Cullin-associated NEDD8-dissociated 1 (CAND1); Receptor Interacting Protein 1 (RIP1); apoptosis; caspase-8; hepatocellular carcinoma (HCC).


Conflict of interest statement

None.

Figures
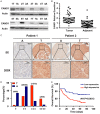
Figure 1
Figure 1
CAND1 expression in liver cancer tissues and its correlation with patient survival. (A, B) Representative western blot bands of CAND1 expression in liver cancer and corresponding adjacent tissues (8 of 63 pairs). β-actin was used as a loading control. T: tumor tissue; A: adjacent tissues (A). Dot Chart showed the relative CAND1 expression detected by western blot in 63 pairs of liver cancer tissues and adjacent tissues. The signal intensity of indicated proteins was obtained with a densitometric analysis using the software of Image J (MD, USA). β-actin was used as a loading control (B). (C) Representative photomicrographs showing IHC staining of CAND1 in liver cancer and corresponding adjacent tissues of two patients. T: tumor tissue; A: adjacent tissues. Magnification ×5 and ×200. (D) The cartogram depicts the distribution of CAND1 expression based on IHC staining intensity from the weakest (+) to the strongest (++++) in 138 cases of HCC tumor tissue (T) compared to that of adjacent tissues (A). (E) Kaplan-Meier log-rank survival analysis in the patients with CAND1 high expression [IHC staining (+++) or (++++)] compared to that of low expression [IHC staining (+) or (++)]. mean ± SD, **P<0.01.
Figure 2
Figure 2
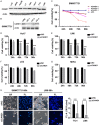
CAND1 knockdown suppressed liver cancer cells proliferation. (A) Western blot showed the expression of CAND1 in immortalized liver cell lines LO2 and MIHA, and in liver cancer cell lines Hep3B, Li7, BEL-7404, Huh7, SMMC7721 (7721) and LM6. (B, C) Three different siRNA sequences were used to confine the expression of CAND1 (siCAND1-1, siCAND1-2 and siCAND1-3). The CAND1 protein level was detected by western blot to confirm the knockdown efficacy in SMMC7721cells treated with siCAND1-1(siC1), siCAND1-2 (siC-2) and siCAND1-3 (siC-3) compared to that of scramble siRNA control (siNC) (B), and the effect of the siRNAs on cell viability was tested by MTS colorimetric assays in SMMC7721 cells (C). (D-G) Cells were transfected with siNC or siCAND1 for 24 h, 48 h, 72 h and 96 h, cell viability was tested by MTS colorimetric assays in Huh7 (D), LM6 (E), LO2 (F) and MIHA (G) (mean ± SD, *P<0.05; ***P<0.001). (H) Hoechst33342 staining was performed 96h after transfection of control or CAND1 siRNAs in SMMC7721 and LM6 cells. The left panel showed the bright field (BF) image and fluorescence (FL) image of the same view in the siCAND1 treatment group and siNC treatment group. The cartogram (right panel) indicated the fluorescence intensity of Hoechst33342 staining. BF: bright field; FL: fluorescence; FL-A: fluorescence area. (mean ± SD, ***P<0.001).
Figure 3
Figure 3
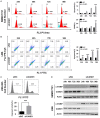
CAND1 knockdown induced apoptosis in HCC cells. A. SMMC7721 cells transfected with siNC or siCAND1 were subjected to cell cycle distribution analysis. The left panel shows the flow charts in the cells treated with either siCAND1 or siNC for the indicated hours. The right panel is the quantitative data for the population of cells at sub-G1 phase, and the population of cells at G2/M phase. (mean ± SD, **P<0.01; ***P<0.001). B. Annexin V and PI staining was used to analyze the apoptotic state of LM6 cells. The total portion of the early apoptotic cells [Annexin V (+) and PI (-)] and the late apoptotic cells [Annexin V (+) and PI (+)] was counted to plot the cartogram. (mean ± SD, **P<0.01; ***P<0.001). C. Capase-3 activation was detected using FITC-DEVD-FMK staining following flow cytometry analysis. The upper panel shows the flow charts in LM6 cells treated with either siCAND1 or siNC for 96 h, respectively; the lower panel is the quantitative data for the upper panel. (mean ± SD, ***P<0.001). D. The expression of apoptotic protein, cleaved-PARP (c-PARP) in SMMC7721 and LM6, was analyzed by western blot with specific antibodies as indicated. β-actin was also detected by western blot as a loading control.
Figure 4
Figure 4
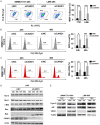
CAND1 knockdown activated mitochondrial apoptotic signal in HCC cells. Liver cancer cell lines SMMC7721 and LM6 were transfected with siNC or siCAND1, respectively. A. Mitochondrial membrane potentials (MMP) collapse in SMMC7721 and LM6 were monitored by JC-1 assays. The left panel shows the flow charts of the cells treated with either siCAND1 or siNC, respectively. The right panel showed the quantitative data in the bar figure. MMP: mitochondrial membrane potential; 7721: SMMC7721 cells. (Mean ± SD, ***P<0.001). B. Intracellular ROS levels were determined using DCFH-DA staining following flow cytometry analysis. The left panel shows the flow charts of the DCFH-DA staining in SMMC7721 cells treated with either siNC or siCAND1 for 24 h and 48 h. The right panel is the quantitative data for the left panel. (mean ± SD, *P<0.05; ***P<0.001). C. Mitochondrial ROS levels were determined using Mito-SOX Red staining following flow cytometry analysis. The left panel showed the flow charts of the Mito-SOX Red staining in SMMC7721 cells treated with either siNC or siCAND1 for 24 h and 48 h. The right panel is the quantitative data for the left panel (mean ± SD, **P<0.01; ***P<0.001). D. The expression of Bcl-2 family members (Bcl-2, Mcl-1, t-BID, Bax, Bak) was analyzed by western blot in LM6 cells treated with either siNC or siCAND1 for the indicated hours. β-actin was used as a loading control. E. The mitochondrial and cytoplasm gradients were isolated by gradient centrifugation. Apoptotic factors (AIF) released from the mitochondria (Mito) to the cytoplasm (Cyto) were analyzed by Western blot in the cells treated with either siNC or siCAND1 for 96 h. VDAC1 was used as a loading control for mitochondrial gradient; β-Tubulin was used as a loading control for cytoplasm gradient. siC: siCAND1. Cyto-C: cytochrome C. VDAC1: Voltage-Dependent Anion Channel 1.
Figure 5
Figure 5
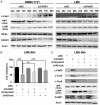
CAND1 knockdown induced caspase-8-dependent cleavage of RIP1. (A) Liver cancer cells were transfected with siControl or siCAND1 for 24 h, 48 h, 72 h, and 96 h. The protein levels for cleavage of Caspase-8 (c-Cas8), RIP protein (RIP 78 KD), cleavage of RIP (c-RIP 30 KD), MLKL and CAND1were analyzed by western blot in the SMMC7721 and LM6 cells treated with either siNC or siCAND1 for indicated hours. β-actin was used as a loading control. (B) Percent viable cells were evaluated by the MTS colorimetric assay in the LM6 cells transfected with siNC, siCAND1, siCaspase-8 or pretreated with Z-VAD-fmk (10 uM) and in the combination of siCAND1 with siCaspase8 or pre-treated with Z-VAD-fmk (10 uM) for 96 h. (mean ± SD, **P<0.01; ***P<0.001). (C) The protein levels for c-PARP, c-Cas9, c-Cas8, RIP (78 KD) and c-RIP (30 KD) were analyzed by western blot in the cells treated with the same scheme on (B).
Figure 6
Figure 6
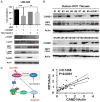
CAND1 knockdown-induced apoptosis was RIP1 kinase activity-dependent. A. LM6 cells were transfected with siCAND1 or pretreated with RIP1 inhibitor Necrostatin-1 (10 uM) for 96 h. Cell viability was analyzed by MTS colorimetric assays and the indicated protein levels were analyzed by western blot. (mean ± SD, **P<0.01; ***P<0.001). B. The protein level of CAND1 and RIP1 in 22 cases of human liver cancer tissues was analyzed by western blot. The upper panel shows the CAND1 and RIP1 protein level in the individual patients. The intensity of RIP and CAND1 level in each patient was also quantitated with a densitometric analysis using the Image J software (MD, USA), and normalized with the intensity of the actin protein in the same patient; the lower panel is the correlation analysis of the normalized RIP1 level and CAND1 level. RIP1/Actin or CAND1/Actin indicated the normalized intensity in each patient. C. Model of CAND1 silencing-induced apoptosis in liver cancer cells.

Similar articles

Cited by

References

    1. Sarikas A, Hartmann T, Pan ZQ. The cullin protein family. Genome Biol. 2011;12:220. - PMC - PubMed
    1. Petroski MD, Deshaies RJ. Function and regulation of cullin-RING ubiquitin ligases. Nat Rev Mol Cell Biol. 2005;6:9–20. - PubMed
    1. Zhao Y, Sun Y. Cullin-RING Ligases as attractive anti-cancer targets. Curr Pharm Des. 2013;19:3215–3225. - PMC - PubMed
    1. Nakayama KI, Nakayama K. Ubiquitin ligases: cell-cycle control and cancer. Nat Rev Cancer. 2006;6:369–381. - PubMed
    1. Schmidt MW, McQuary PR, Wee S, Hofmann K, Wolf DA. F-box-directed CRL complex assembly and regulation by the CSN and CAND1. Mol Cell. 2009;35:586–597. - PMC - PubMed

LinkOut - more resources