. 2020 Mar;51(5):1364-1376.
doi: 10.1111/ejn.13992. Epub 2018 Aug 12.

Electrocorticography reveals continuous auditory and visual speech tracking in temporal and occipital cortex

Affiliations

Electrocorticography reveals continuous auditory and visual speech tracking in temporal and occipital cortex

Cristiano Micheli et al. Eur J Neurosci. 2020 Mar.

Abstract

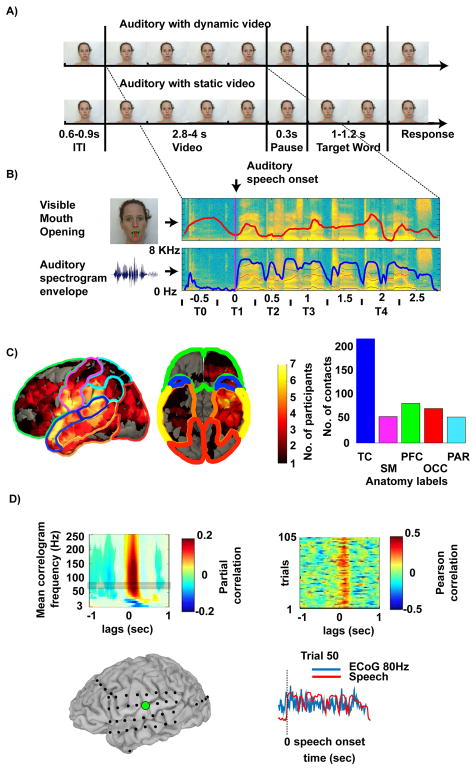
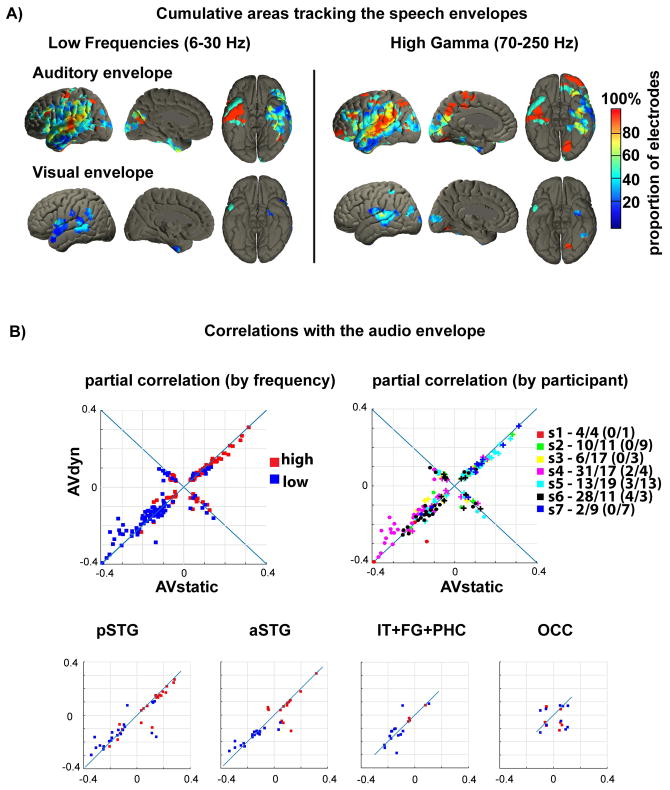
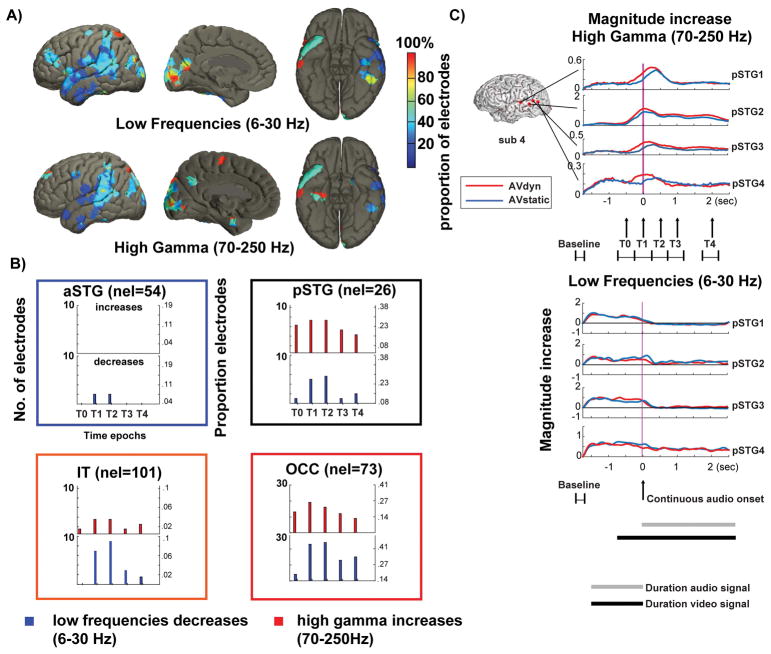
During natural speech perception, humans must parse temporally continuous auditory and visual speech signals into sequences of words. However, most studies of speech perception present only single words or syllables. We used electrocorticography (subdural electrodes implanted on the brains of epileptic patients) to investigate the neural mechanisms for processing continuous audiovisual speech signals consisting of individual sentences. Using partial correlation analysis, we found that posterior superior temporal gyrus (pSTG) and medial occipital cortex tracked both the auditory and the visual speech envelopes. These same regions, as well as inferior temporal cortex, responded more strongly to a dynamic video of a talking face compared to auditory speech paired with a static face. Occipital cortex and pSTG carry temporal information about both auditory and visual speech dynamics. Visual speech tracking in pSTG may be a mechanism for enhancing perception of degraded auditory speech.

Keywords: audiovisual speech; clear speech; continuous speech; multisensory; naturalistic stimuli.


Conflict of interest statement

Conflict of interest

The authors declare that they have no conflicts of interest to declare.

Figures

Figure 1
Figure 1
A) Trial structure: Subjects listened to sentences presented either with the speaker moving the lips (auditory with dynamic video, AVdyn) or with a static image of a speaker (auditory with static video, AVstatic). After a short pause a target word was presented and the subjects had to answer whether the word was present in the previous sentence. B) Two stimulus features were extracted from the sentence utterance interval: The time-series of the vertical mouth opening (red) and the envelope of the spectrogram (blue). Example time series for one sentence are shown. T0–T4 denote intervals for the time resolved analysis (T0: before audio onset (-0.5 ± 0.25 s), T1: audio speech onset (0 ± 0.25 s), T2: early sentence (0.5 ± 0.25 s), T3: middle sentence (1 ± 0.25 s), T4: late sentence (2 ± 0.25 s)). Note that in the AVdyn condition the speaker may already move her lips prior to auditory speech onset. C) Location of electrodes for all subjects, projected on a template brain. Over subjects the highest densities are along the STG (blue), inferior somatomotor (magenta), prefrontal (green), occipital (red), and parietal (cyan) cortices, indicated by the hotter colors. TC: temporal cortex, SM: sensory-motor, PFC: pre-frontal, OCC: occipital, PAR: parietal. D) Correlation between the neural response and the auditory envelope for a representative electrode over pSTG. Frequency resolved correlogram (partial correlations) for a single electrode (top left). The frequency range highlighted in the plot (80 ± 10 Hz) was used for the subsequent panels in D. Single trial correlation (Pearson correlation) across AVdyn trials between the neural response and the auditory envelope for the different lags from −1 to 1 second (top right). Single sentence neural response and auditory envelope time courses (r = 0.49, lag of 160 ms of the auditory envelope compared to the neural response (bottom right).
Figure 2
Figure 2
A) MNI template localization of areas that showed tracking of the auditory speech envelope (upper row) or the envelope of the visible mouth opening (lower row) as revealed by partial correlation. The color coded overlay represents the proportion of electrodes per area with significant tracking, calculated over electrodes from all subjects. Note the high proportions over pSTG and medial occipital cortex, indicating tracking of the auditory and the visual envelope of the speech signal. The effect is more pronounced in the HG- than in the LF-band. Supplementary figure 1 reports the absolute number of participants with significant electrodes and figure 1C shows the proportion of participants which had electrode coverage in an area. B) Upper row: The panels show the maxima of partial correlations for all significant electrodes. Each point corresponds to one electrode (electrodes can appear twice in the low and high frequencies). Left: positive correlations are distributed mainly in the HG band (red), negative correlations in the LF band (blue). Right: correlations distinguished by subject. The colors on the right indicate the different subjects (s1 to s7). Crosses indicate HG band and dots LF band. The numbers indicate significant electrodes per subject in the LF/HG bands. The numbers in parentheses indicate the electrodes in the positive quadrant. Lower row: significant electrodes in different cortical areas differentiated per band. Acronyms: pSTG: posterior STG, aSTG: anterior STG, IT+FG+PHC: inferior temporal, fusiform gyrus, parahippocampal cortex, OCC: occipital cortex.
Figure 3
Figure 3. Neural activation differences between AVdyn and AVstatic stimuli
A) Cortical distribution of electrodes that show significant effects (corrected for multiple comparisons) of adding speaker mouth movements (AVdyn) to auditory speech (AVstatic) over total number of electrodes from all subjects. The effect is calculated from spectrograms of neural activation in two dynamic bands and aggregated over subjects. Activation in pSTG and in medial visual cortex was modulated by additional visual speech information in both dynamic bands. Supplementary figure 2 reports the absolute number of participants with significant electrodes and figure 1C shows the density of participants per area. B) Time resolved effects in four anatomical areas defined in Fig. 1C. The bars indicate the proportion of electrodes in each area that show a significant difference in the neural activation spectrograms of the respective dynamic ranges (6–30 Hz, 70–250 Hz) in one of five (T0–T4) 500 ms time intervals starting before speech onset (T0) and ending 2 s after auditory speech onset (T4). Nel = total number of electrodes in the respective brain area. The strongest effect, in terms of proportion of electrodes with significant effects, is in pSTG and occipital cortex (OCC). The inferior anterior temporal cortices show smaller effects. Note that adding visual speaker information decreases amplitudes in the LF bands, below 30 Hz and increase neural activation in HG bands above 70 Hz. C) Examples of average time courses across trials for the two experimental conditions (AVdyn = red, AVstatic = blue) in 4 electrodes of one subject (S4). The time courses are shown for the HG (top) and LF (bottom) responses to the continuous speech input. The baseline time interval is −2 to −1.75 seconds with respect to speech onset, and it is chosen to make sure that no audio input is presented within its time frame. Note that the AVdyn response onsets precedes the AVstatic latency in most electrodes. Using partial correlation analysis, we found that neuronal responses in electrodes over posterior superior temporal gyrus (pSTG) and medial occipital cortex tracked respectively auditory and visual speech envelopes. In addition, we found a cross-modal effect of pSTG tracking visual speech while occipital cortex tracks auditory speech envelope. Using magnitude difference between conditions with and without dynamic video we determined that pSTG is an important location of magnitude modulation.

References

    1. Arnal LH, Wyart V, Giraud AL. Transitions in neural oscillations reflect prediction errors generated in audiovisual speech. Nat Neurosci. 2011;14:797–801. - PubMed
    1. Ashburner J, Friston KJ. Computing average shaped tissue probability templates. NeuroImage. 2009;45(2):333–341. - PubMed
    1. Bastiaansen M, Magyari L, Hagoort P. Syntactic unification operations are reflected in oscillatory dynamics during on-line sentence comprehension. J Cogn Neurosci. 2010 Jul;22(7):1333–47. doi: 10.1162/jocn.2009.21283. - DOI - PubMed
    1. Beauchamp MS, Lee KE, Argall BD, Martin A. Integration of auditory and visual information about objects in superior temporal sulcus. Neuron. 2004;41:809–823. - PubMed
    1. Bernstein LE, Liebenthal E. Neural pathways for visual speech perception. Front Neurosci. 2014;8:386. - PMC - PubMed

Publication types

LinkOut - more resources