. 2018 Jul 2;128(7):2996-3007.
doi: 10.1172/JCI95993. Epub 2018 Jun 11.

Human CD30+ B cells represent a unique subset related to Hodgkin lymphoma cells

Affiliations

Human CD30+ B cells represent a unique subset related to Hodgkin lymphoma cells

Marc A Weniger et al. J Clin Invest. .

Abstract

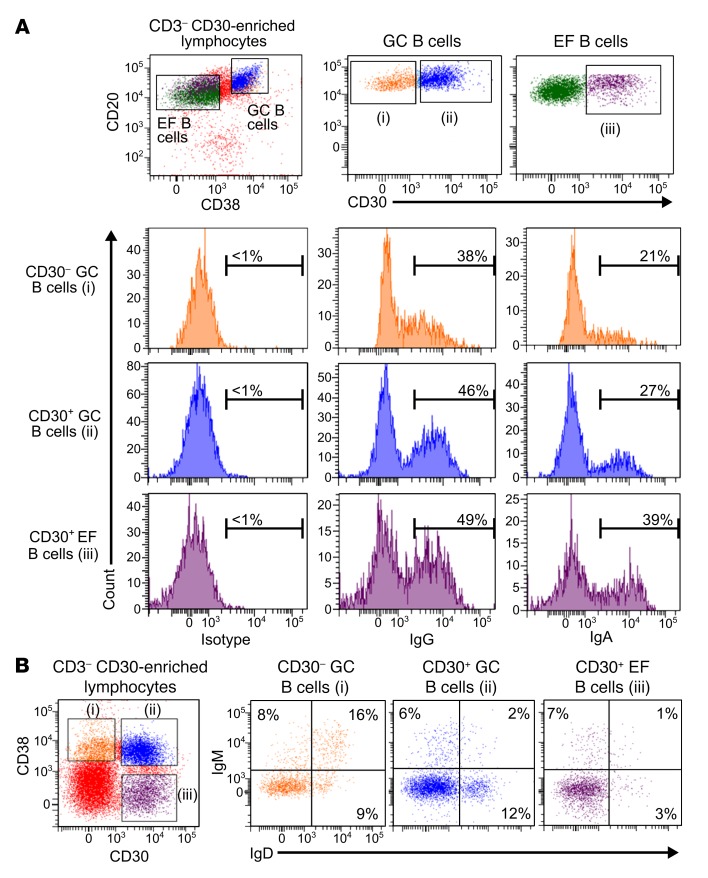
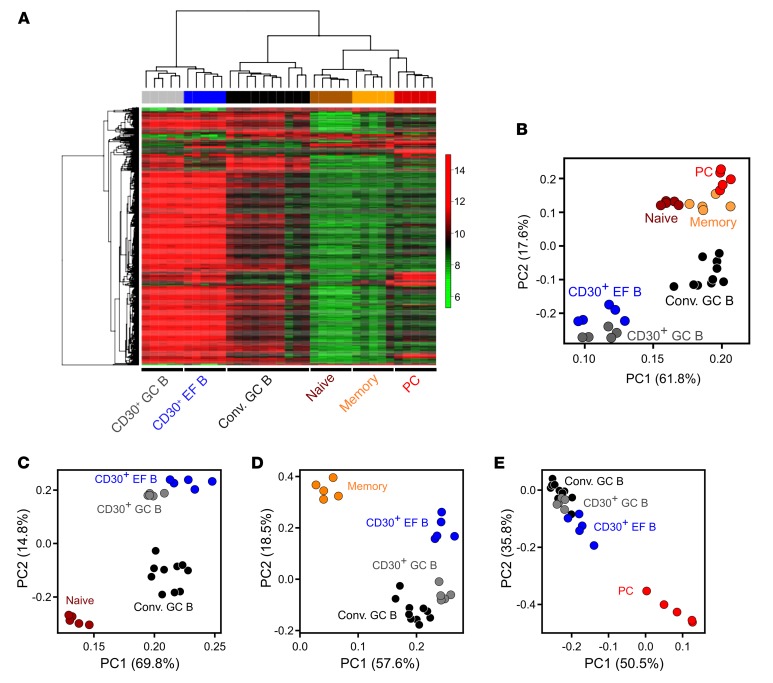
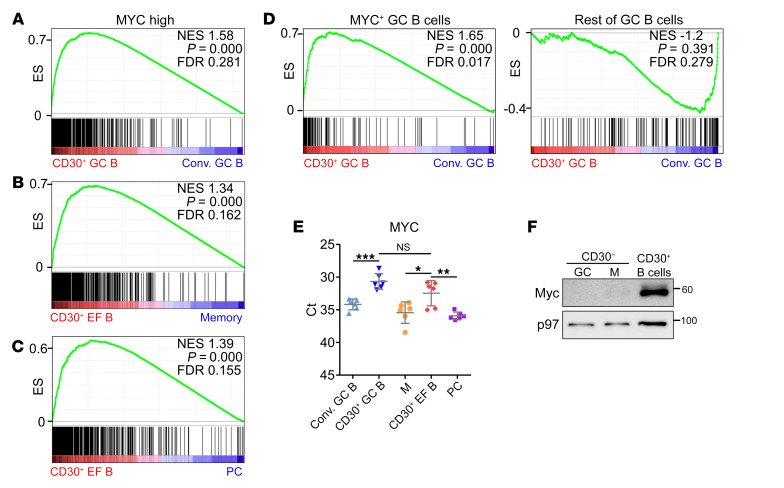
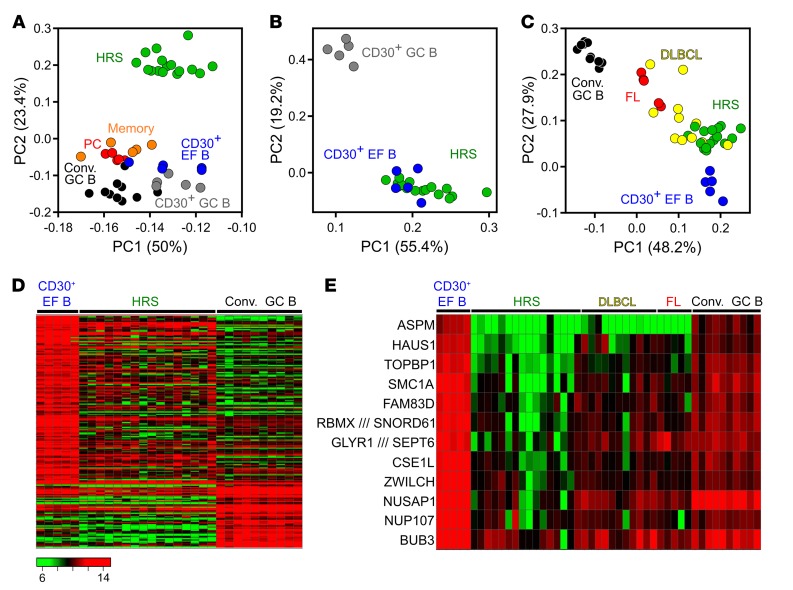
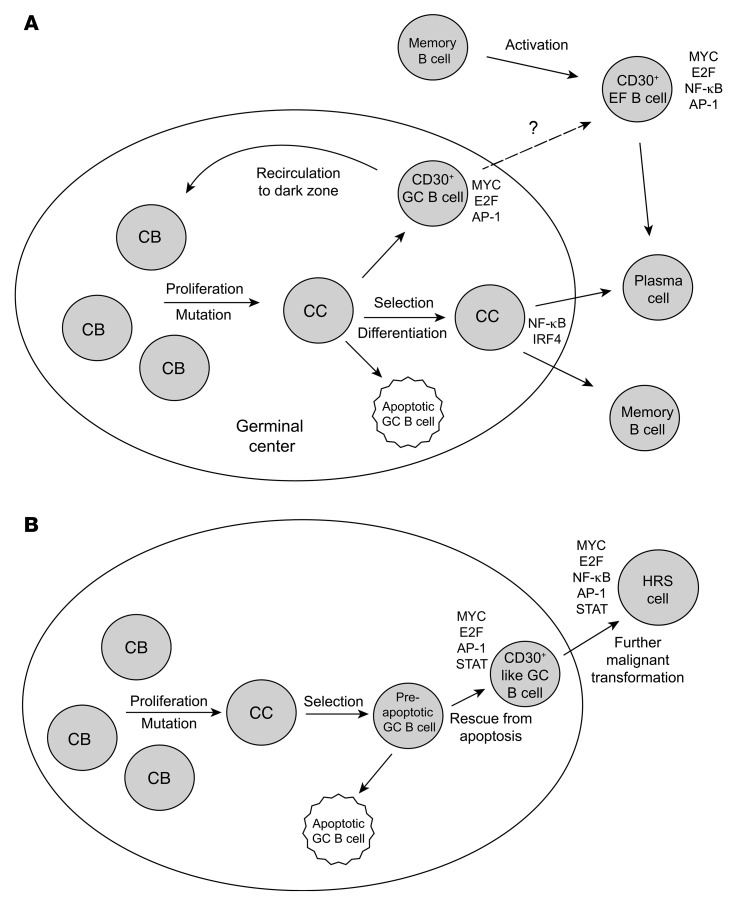
Very few B cells in germinal centers (GCs) and extrafollicular (EF) regions of lymph nodes express CD30. Their specific features and relationship to CD30-expressing Hodgkin and Reed/Sternberg (HRS) cells of Hodgkin lymphoma are unclear but highly relevant, because numerous patients with lymphoma are currently treated with an anti-CD30 immunotoxin. We performed a comprehensive analysis of human CD30+ B cells. Phenotypic and IgV gene analyses indicated that CD30+ GC B lymphocytes represent typical GC B cells, and that CD30+ EF B cells are mostly post-GC B cells. The transcriptomes of CD30+ GC and EF B cells largely overlapped, sharing a strong MYC signature, but were strikingly different from conventional GC B cells and memory B and plasma cells, respectively. CD30+ GC B cells represent MYC+ centrocytes redifferentiating into centroblasts; CD30+ EF B cells represent active, proliferating memory B cells. HRS cells shared typical transcriptome patterns with CD30+ B cells, suggesting that they originate from these lymphocytes or acquire their characteristic features during lymphomagenesis. By comparing HRS to normal CD30+ B cells we redefined aberrant and disease-specific features of HRS cells. A remarkable downregulation of genes regulating genomic stability and cytokinesis in HRS cells may explain their genomic instability and multinuclearity.

Keywords: B cells; Hematology; Hodgkins lymphoma; Immunology; Molecular pathology.


Conflict of interest statement

Conflict of interest: The authors have declared that no conflict of interest exists.

Figures

Figure 1
Figure 1. Phenotypic characterization of CD30+ B cells.
Tonsillar mononuclear cells were depleted of CD3+ T cells and enriched for CD30+ B cells by consecutive MACS isolation steps. (A) CD3 CD30–enriched B cells were stained for CD20, CD30, CD38, and either for IgG, IgA, or an isotype control. Gates defining CD30 GC B cells (i), CD30+ GC B cells (ii), and CD30+ EF B cells (iii) are given. Histograms show fractions of IgG+, IgA+ , and isotype control–positive cells. (B) IgM and IgD expression on CD30+ B cell subsets. The percentages of IgM+ and/or IgD+ cells are given. Gates defining CD30 GC B cells (i), CD30+ GC B cells (ii), and CD30+ EF B cells (iii) are shown on the left. The expression pattern of IgM and IgD for these 3 B cell subpopulations are depicted in the plots on the right.
Figure 2
Figure 2. Unsupervised hierarchical clustering and PCA of normal human B cell subsets.
(A) Unsupervised hierarchical clustering was performed on 683 probe sets with SD ≥ 1. For calculating the distance matrix we used the Manhattan distance method. The dendrogram was generated with the average linkage method from the R package geneplotter. (B) PCA was conducted on 683 probe sets with SD ≥ 1. The figure shows the first 2 principal components. The first principal component covers 61.8% of the variance, the second one 17.6%. (C) Supervised PCA was performed using 229 differentially expressed probe sets with FC ≥ 4 or ≤ –4 and FDR ≤ 0.05 between GC and naive B cells. (D) Supervised PCA was performed using 128 differentially expressed probe sets with FC ≥ 4 or ≤ –4 and FDR ≤ 0.05 between conventional GC and memory B cells. (E) Supervised PCA was performed using 130 differentially expressed probe sets with FC ≥ 4 or ≤ –4 and FDR ≤ 0.05 between GC B cells and plasma cells. In BE, the first 2 principal components are shown. Conv. GC, conventional GC B cells; PC, plasma cells; PC1/PC2, principal component 1/2.
Figure 3
Figure 3. MYC expression and activity in CD30+ B cells.
Expression of MYC and MYC target genes in CD30+ and conventional B cells. Enrichment plots of functionally validated MYC target genes (482 Myc high) (69) for comparisons of (A) CD30+ versus conventional (Conv.) GC B cells, (B) CD30+ EF B cells versus memory B cells, and (C) CD30+ EF B cells versus plasma cells (PC). (D) A comparison of CD30+ GC B cells versus conventional GC B cells is shown for a gene set specifically enriched in murine MYC+ GC B cells, and a gene set enriched in murine MYC GC B cells (42). (E) MYC expression in tonsillar CD30 cells (M, memory B cells; PC, plasma cells) and CD30+ GC and EF B cell subsets by RT-qPCR (n = 6 donors). Ct values are shown. Graphs indicate mean ± SD. (F) MYC protein expression in CD30+ B cells, CD30 GC B cells, and memory (M) B cells. A representative image of 2 independent experiments is shown. *P < 0.05; **P < 0.01, ***P < 0.001 (unpaired, 2-tailed t test).
Figure 4
Figure 4. PCA and heat maps of the comparison of HRS cells to CD30+ and CD30 B cells.
(A) Unsupervised 2D PCA of probe sets with a SD > 1 (765 probe sets) from the comparison of HRS cells to normal GC and post-GC B cell subsets. (B) Supervised PCA of CD30+ B cells versus HRS cells, based on genes differentially expressed between CD30+ GC and CD30+ EF B cells (254 probe sets; FC ≥ 2, FDR ≤ 0.05). (C) Two-dimensional PCA based on probe sets at least 4-fold differentially expressed between CD30+ EF and conventional (Conv.) GC B cells (70 probe sets). Besides these 2 normal B cell subsets, HRS cell samples as well as FL and DLBCL are displayed. (D) Heat map of a supervised analysis of genes differentially expressed between conventional GC B cells and CD30+ EF B cells (199 probe sets, FC ≥ 3). HRS cell samples are shown for comparison. (E) Heat map shows the expression of 12 of 169 genes downregulated at least 5-fold in HRS cells in comparison with CD30+ EF B cells that are involved in the regulation of the spindle apparatus, cytokinesis, and polyploidy. Samples of conventional GC B cells as well as of FL and DLBCL are included for comparison. Scale as in D.
Figure 5
Figure 5. Scenarios for the generation of normal CD30+ B cells and HRS cells.
(A) The key features of CD30+ GC B cells as outlined in the text indicate that CD30+ GC B cells represent the positively selected centrocytes (CC) that are preparing to return to the dark zone to become centroblasts (CB) again and undergo an additional round of proliferation and selection. High activity of MYC and E2F and signatures for AP-1 activity are hallmarks of these cells. CD30+ EF B cells likely represent reactivated memory B cells that undergo proliferation before they presumably differentiate into plasma cells. It is unclear whether CD30+ GC B cells may also directly differentiate into CD30+ EF B cells. (B) Scenario for the generation of HRS cells. Genetic features of HRS cells (crippled IgV genes in at least a quarter of cases) strongly indicate that these cells derive from preapoptotic GC B cells that were rescued from apoptosis by some transforming events (e.g., EBV infection in a fraction of cases). The similarities in their gene expression between HRS and CD30+ B cells indicate that HRS precursor cells differentiated into the direction of CD30+ B cells in the course of their further malignant transformation. Mainly because of the downregulation of GC B cell–specific genes and the strong constitutive NF-κB activity, HRS cells more closely resemble CD30+ EF B cells than CD30+ GC B cells.

References

    1. Falini B, et al. CD30 (Ki-1) molecule: a new cytokine receptor of the tumor necrosis factor receptor superfamily as a tool for diagnosis and immunotherapy. Blood. 1995;85(1):1–14. - PubMed
    1. Stein H, et al. The expression of the Hodgkin’s disease associated antigen Ki-1 in reactive and neoplastic lymphoid tissue: evidence that Reed-Sternberg cells and histiocytic malignancies are derived from activated lymphoid cells. Blood. 1985;66(4):848–858. - PubMed
    1. Kurth J, et al. EBV-infected B cells in infectious mononucleosis: viral strategies for spreading in the B cell compartment and establishing latency. Immunity. 2000;13(4):485–495. doi: 10.1016/S1074-7613(00)00048-0. - DOI - PubMed
    1. Cattoretti G, Büttner M, Shaknovich R, Kremmer E, Alobeid B, Niedobitek G. Nuclear and cytoplasmic AID in extrafollicular and germinal center B cells. Blood. 2006;107(10):3967–3975. doi: 10.1182/blood-2005-10-4170. - DOI - PubMed
    1. Cattoretti G, Shaknovich R, Smith PM, Jäck HM, Murty VV, Alobeid B. Stages of germinal center transit are defined by B cell transcription factor coexpression and relative abundance. J Immunol. 2006;177(10):6930–6939. doi: 10.4049/jimmunol.177.10.6930. - DOI - PubMed

Publication types

MeSH terms

Substances