. 2018 Jul 2;128(7):3024-3040.
doi: 10.1172/JCI96477. Epub 2018 Jun 11.

SGK1 induces vascular smooth muscle cell calcification through NF-κB signaling

Affiliations

SGK1 induces vascular smooth muscle cell calcification through NF-κB signaling

Jakob Voelkl et al. J Clin Invest. .

Abstract

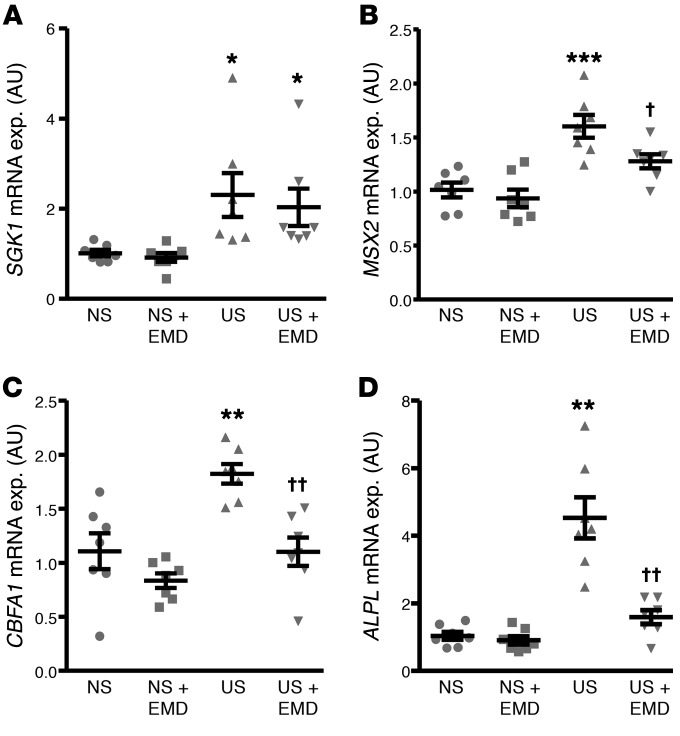
Medial vascular calcification, associated with enhanced mortality in chronic kidney disease (CKD), is fostered by osteo-/chondrogenic transdifferentiation of vascular smooth muscle cells (VSMCs). Here, we describe that serum- and glucocorticoid-inducible kinase 1 (SGK1) was upregulated in VSMCs under calcifying conditions. In primary human aortic VSMCs, overexpression of constitutively active SGK1S422D, but not inactive SGK1K127N, upregulated osteo-/chondrogenic marker expression and activity, effects pointing to increased osteo-/chondrogenic transdifferentiation. SGK1S422D induced nuclear translocation and increased transcriptional activity of NF-κB. Silencing or pharmacological inhibition of IKK abrogated the osteoinductive effects of SGK1S422D. Genetic deficiency, silencing, and pharmacological inhibition of SGK1 dissipated phosphate-induced calcification and osteo-/chondrogenic transdifferentiation of VSMCs. Aortic calcification, stiffness, and osteo-/chondrogenic transdifferentiation in mice following cholecalciferol overload were strongly reduced by genetic knockout or pharmacological inhibition of Sgk1 by EMD638683. Similarly, Sgk1 deficiency blunted vascular calcification in apolipoprotein E-deficient mice after subtotal nephrectomy. Treatment of human aortic smooth muscle cells with serum from uremic patients induced osteo-/chondrogenic transdifferentiation, effects ameliorated by EMD638683. These observations identified SGK1 as a key regulator of vascular calcification. SGK1 promoted vascular calcification, at least partly, via NF-κB activation. Inhibition of SGK1 may, thus, reduce the burden of vascular calcification in CKD.

Keywords: Cardiovascular disease; Cell Biology; Chronic kidney disease; NF-kappaB; Vascular Biology.


Conflict of interest statement

Conflict of interest: The authors have declared that no conflict of interest exists.

Figures

Figure 1
Figure 1. SGK1 expression in VSMCs.
(A) Scatter dot plots and arithmetic means ± SEM (n = 6 per group; arbitrary units [AU]) of SGK1 relative mRNA expression in primary HAoSMCs following treatment with control (CTR) or aldosterone (Aldo), dexamethasone (Dex), β-glycerophosphate (Pi), glucose, recombinant human TGF-β1 protein, or recombinant human BMP-2 protein. (B) Representative original Western blots and scatter dot plots and arithmetic means ± SEM (n = 4 per group; AU) of normalized SGK1/GAPDH protein ratio in HAoSMCs following treatment with triggers of osteo-chondrogenic transdifferentiation. *P < 0.05, **P < 0.01, ***P < 0.001 statistically significant vs. control-treated HAoSMCs (1-way ANOVA with Tukey-Honestly Significant Difference [HSD] [A] and with Games-Howell post hoc test [B]). (C and D) Scatter dot plots and arithmetic means ± SEM (AU) of Sgk1 relative mRNA expression in aortic tissue from kl/kl mice and WT mice (C, n = 7 per group) and DBA mice without (CTR) or with subtotal nephrectomy (Nx) (D, n = 7–8 per group). (E and F) Scatter dot plots and arithmetic means ± SEM (AU) of SGK1 (E) and MSX2 (F) relative mRNA expression in coronary artery tissue from patients with maintained (CTR, n = 10) and impaired (IRF, n = 9) renal function. **P < 0.01 statistically significant vs. WT mice, control-treated mice, or CTR patients, respectively (unpaired 2-tailed t test for CF). (G) Correlation of SGK1 and MSX2 relative mRNA expression (AU) in coronary artery tissue from CTR and IRF patients. P represents the 2-tailed probability value of the Pearson correlation. (H) Representative original histological images (n = 5 per group) showing SGK1 expression as well as ectopic calcification by von Kossa staining (calcification, gray to black) in coronary artery sections from control patients and dialysis patients. Scale bars: 100 μm.
Figure 2
Figure 2. SGK1 overexpression induces osteo-/chondrogenic transdifferentiation of primary HAoSMCs.
(A) Representative original Western blots and scatter dot plots and arithmetic means ± SEM (n = 4 per group; AU) of normalized SGK1/GAPDH and phospho-NDRG1(Thr346)/GAPDH protein ratio in HAoSMCs following transfection with empty vector (V), constitutively active SGK1S422D (SGK1SD), or inactive SGK1K127N (SGK1KN). (BG) Scatter dot plots and arithmetic means ± SEM (n = 8 per group; AU) of MSX2 (B), WNT7A (C), WNT3A (D), CBFA1 (E), ALPL (F), and ANKH (G) relative mRNA expression in HAoSMCs following transfection with empty vector (V), constitutively active SGK1S422D (SGK1SD), or inactive SGK1K127N (SGK1KN). (H) Scatter dot plots and arithmetic means ± SEM (n = 8 per group; AU) of normalized CBFA1 transcriptional activation in HAoSMCs following transfection with empty vector (V), constitutively active SGK1S422D (SGK1SD), or inactive SGK1K127N (SGK1KN). (I) Scatter dot plots and arithmetic means ± SEM (n = 4 per group, U/mg protein) of alkaline phosphatase activity in HAoSMCs following transfection with empty vector (V), constitutively active SGK1S422D (SGK1SD), or inactive SGK1K127N (SGK1KN). (J) Scatter dot plots and arithmetic means ± SEM (n = 12 per group; AU) of normalized PPi levels in the cell culture medium of HAoSMCs following transfection with empty vector (V), constitutively active SGK1S422D (SGK1SD), or inactive SGK1K127N (SGK1KN). *P < 0.05, **P < 0.01, ***P < 0.001 statistically significant vs. V-transfected HAoSMCs; P < 0.05, ††P < 0.01, †††P < 0.001 statistically significant vs. SGK1SD-transfected HAoSMCs (1-way ANOVA with Tukey-HSD post hoc test for AC, E, G, and J and with Games-Howell post hoc test for D, F, H, and I).
Figure 3
Figure 3. NF-κB–dependent effects of SGK1 on osteo-/chondrogenic signaling in primary HAoSMCs.
(A) Representative confocal microscopy images (n = 3 per group) showing NF-κB p65 protein expression and localization in HAoSMCs following transfection with empty vector (V), constitutively active SGK1S422D (SGK1SD), or inactive SGK1K127N (SGK1KN). Green labeling, NF-κB p65 expression; magenta labeling, nuclei. Scale bars: 20 μm. (B) Scatter dot plots and arithmetic means ± SEM (n = 4 per group; AU) of NF-κB–dependent transcriptional activity measured by luciferase reporter assay in HAoSMCs following transfection with NF-κB–responsive luciferase/Renilla constructs and with empty vector (V), constitutively active SGK1S422D (SGK1SD), or inactive SGK1K127N (SGK1KN). (C) Scatter dot plots and arithmetic means ± SEM (n = 8 per group; AU) of ZFP36 relative mRNA expression in HAoSMCs following transfection with empty vector (V), constitutively active SGK1S422D (SGK1SD), or inactive SGK1K127N (SGK1KN). (DF) Scatter dot plots and arithmetic means ± SEM (n = 6 per group; AU) of MSX2 (D), CBFA1 (E), and ALPL (F) relative mRNA expression in HAoSMCs following transfection with empty vector (V) or constitutively active SGK1S422D (SGK1SD) and additional treatment with control, BAY11-7082 (BAY), parthenolide (PAR), or BMS-345541 (BMS). (GI) Scatter dot plots and arithmetic means ± SEM (n = 6 per group; AU) of MSX2 (G), CBFA1 (H), and ALPL (I) relative mRNA expression in HAoSMCs following transfection with empty vector (V) or constitutively active SGK1S422D (SGK1SD) and additional silencing with negative control siRNA (Neg.si), IKKα siRNA (IKKαsi), or IKKβ siRNA (IKKβsi). *P < 0.05, ***P < 0.001 statistically significant vs. V-transfected HAoSMCs; P < 0.05, ††P < 0.01, †††P < 0.001 statistically significant vs. SGK1SD-transfected HAoSMCs (1-way ANOVA with Tukey-HSD post hoc test for BE and H or with Games-Howell post hoc test for G and I and Steel-Dwass method for F).
Figure 4
Figure 4. Sgk1 deficiency reduces phosphate-induced osteo-/chondrogenic transdifferentiation and calcification of primary MAoSMCs.
(A) Scatter dot plots and arithmetic means ± SEM (n = 6 per group; AU) of Sgk1 relative mRNA expression in primary MAoSMCs isolated from WT mice (sgk1+/+) and treated with control or β-glycerophosphate (Pi). (B) Representative confocal microscopy images (n = 3 per group) showing Sgk1 and NF-κB p65 protein expression and scatter dot plots and arithmetic means ± SEM (n = 3 per group; AU) of normalized Sgk1 fluorescence intensity in sgk1–/– or sgk1+/+ MAoSMCs treated with control or Pi. Green labeling, Sgk1 or NF-κB p65 expression; magenta labeling, nuclei. Scale bars: 20 μm. **P < 0.01, ***P < 0.001 statistically significant vs. control-treated MAoSMCs (unpaired 2-tailed t test). (C) Scatter dot plots and arithmetic means ± SEM (n = 6 per group; AU) of NF-κB–dependent transcriptional activity measured by luciferase reporter assay in sgk1–/– or sgk1+/+ MAoSMCs treated with control or Pi. (D) Representative original images (n = 3 per group) showing alizarin red staining in sgk1–/– or sgk1+/+ MAoSMCs treated with control or calcification medium. Calcified areas are shown as red staining. (EI) Scatter dot plots and arithmetic means ± SEM of calcium content (E, n = 6 per group, μg/mg protein), alkaline phosphatase activity (F, n = 6 per group, U/mg protein), and Msx2 (G), Cbfa1 (H), and Alpl (I) relative mRNA expression (n = 6 per group; AU) in sgk1–/– or sgk1+/+ MAoSMCs treated with control or Pi. *P < 0.05, ***P < 0.001 statistically significant vs. control-treated sgk1+/+ MAoSMCs; P < 0.05, ††P < 0.01, †††P < 0.001 statistically significant vs. calcification medium/Pi–treated sgk1+/+ MAoSMCs (1-way ANOVA with Tukey-HSD post hoc test for C, E, and GI and Steel-Dwass method for F).
Figure 5
Figure 5. SGK1 inhibition ameliorates phosphate-induced osteo-/chondrogenic transdifferentiation and calcification of primary HAoSMCs.
(A) Scatter dot plots and arithmetic means ± SEM (n = 7 per group; AU) of SGK1 relative mRNA expression in HAoSMCs following treatment with control or β-glycerophosphate (Pi) without or with additional treatment with SGK1 inhibitor EMD638683 (EMD). (B) Representative confocal microscopy images (n = 3 per group) showing NF-κB p65 protein expression and localization in HAoSMCs following treatment with control or β-glycerophosphate (Pi) without or with additional treatment with SGK1 inhibitor EMD638683 (EMD). Green labeling, NF-κB p65 expression; magenta labeling, nuclei. Scale bars: 20 μm. (C) Representative original images (n = 4 per group) showing alizarin red staining in HAoSMCs following treatment with control or with calcification medium without or with additional treatment with SGK1 inhibitor EMD638683 (EMD). Calcified areas are shown as red staining. (DH) Scatter dot plots and arithmetic means ± SEM of calcium content (D, n = 6 per group, μg/mg protein), alkaline phosphatase activity (E, n = 4 per group, U/mg protein), and MSX2 (F), CBFA1 (G), and ALPL (H) relative mRNA expression (n = 7 per group; AU) in HAoSMCs following treatment with control or phosphate (Pi) without or with additional treatment with SGK1 inhibitor EMD638683 (EMD). *P < 0.05, **P < 0.01, ***P < 0.001 statistically significant vs. control-treated HAoSMCs; P < 0.05, ††P < 0.01, †††P < 0.001 statistically significant vs. HAoSMCs treated with calcification medium/Pi alone (Steel-Dwass method for A and 1-way ANOVA with Tukey-HSD post hoc test for DH).
Figure 6
Figure 6. Sgk1 deficiency ameliorates vascular calcification and stiffness during vitamin D3 overload–induced calcification.
(A) Representative original images (n = at least 3 per group) showing aortic alizarin red staining in Sgk1-deficient mice (sgk1–/–) or corresponding WT mice (sgk1+/+) receiving vehicle or high-dosed cholecalciferol (vD). Scale bar: 5 mm. Calcified areas are shown as red staining. (B) Scatter dot plots and arithmetic means ± SEM (n = 7 per group; μg/mg protein) of calcium content in the aortic arch of sgk1–/– mice or sgk1+/+ mice receiving vehicle or high-dosed cholecalciferol (vD). (C) Scatter dot plots and arithmetic means ± SEM (n = 6–9 per group; m/s) of abdominal aortic pulse propagation velocity (PPV) in sgk1–/– mice or sgk1+/+ mice receiving vehicle or high-dosed cholecalciferol (vD). (D and E) Scatter dot plots and arithmetic means ± SEM (n = 10–11 per group; AU) of Col1a1 (D) and Fn1 (E) relative mRNA expression in aortic tissue of sgk1–/– mice or sgk1+/+ mice receiving vehicle or high-dosed cholecalciferol (vD). **P < 0.01, ***P < 0.001 statistically significant vs. control sgk1+/+ mice; P < 0.05, ††P < 0.01, †††P < 0.001 statistically significant vs. vD-treated sgk1+/+ mice (1-way ANOVA with Tukey-HSD post hoc test for B, C, and E or with Games-Howell post hoc test for D). (F) Summary data of wall tension (n = 7 rings, 4 mice per group; mN/mm) during mechanical stretch (μm) ex vivo of abdominal aortae isolated from sgk1–/– mice or sgk1+/+ mice receiving high-dosed cholecalciferol (vD). *P < 0.05, **P < 0.01 statistically significant vs. vD-treated sgk1–/– mice (unpaired 2-tailed t test).
Figure 7
Figure 7. Sgk1 deficiency ameliorates vascular osteoinductive signaling during vitamin D3 overload–induced calcification.
(A) Representative confocal microscopy images (n = 4 per group) showing Sgk1 and Msx2 protein expression and scatter dot plots and arithmetic means ± SEM (n = 4 per group; AU) of normalized Sgk1 and Msx2 fluorescence intensity in aortic tissues of Sgk1-deficient mice (sgk1–/–) or corresponding WT mice (sgk1+/+) receiving vehicle or high-dosed cholecalciferol (vD). Green labeling, protein expression; magenta labeling, nuclei; red labeling, actin staining. Scale bars: 25 μm. (B) Scatter dot plots and arithmetic means ± SEM (n = 10–11 per group; AU) of Sgk1 relative mRNA expression in aortic tissue of sgk1+/+ mice receiving vehicle or high-dosed cholecalciferol (vD). (CI) Scatter dot plots and arithmetic means ± SEM (n = 10–11 per group; AU) of Msx2 (C), Wnt7a (D), Wnt3a (E), Cbfa1 (F), Alpl (G), Zfp36 (H), and Ankh (I) relative mRNA expression in aortic tissue of sgk1–/– mice or sgk1+/+ mice receiving vehicle or high-dosed cholecalciferol (vD). *P < 0.05, **P < 0.01, ***P < 0.001 statistically significant vs. control sgk1+/+ mice; P < 0.05, ††P < 0.01, †††P < 0.001 statistically significant vs. vD-treated sgk1+/+ mice (unpaired 2-tailed t test for Sgk1 panel of A and for B; 1-way ANOVA with Games-Howell post hoc test for Msx2 panel of A and for CF; and Steel-Dwass method for GI).
Figure 8
Figure 8. Sgk1 inhibition ameliorates vascular calcification, stiffness, and osteoinductive signaling during vitamin D3 overload–induced calcification.
(A) Representative original images (n = 3 per group) showing aortic alizarin red staining in mice receiving vehicle or high-dosed cholecalciferol (vD) without or with additional treatment with SGK1 inhibitor EMD638683 (EMD). Scale bar: 5 mm. The calcified areas are shown as red staining. (B) Scatter dot plots and arithmetic means ± SEM (n = 7 per group; μg/mg protein) of calcium content in the aortic arch of mice receiving vehicle or high-dosed cholecalciferol (vD) without or with additional treatment with SGK1 inhibitor EMD638683 (EMD). (C) Scatter dot plots and arithmetic means ± SEM (n = 10 per group; m/s) of abdominal aortic pulse propagation velocity (PPV) in mice receiving vehicle or high-dosed cholecalciferol (vD) without or with additional treatment with SGK1 inhibitor EMD638683 (EMD). (D) Scatter dot plots and arithmetic means ± SEM (n = 7 per group; AU) of Sgk1 relative mRNA expression in aortic tissue of mice receiving vehicle or high-dosed cholecalciferol (vD). (E–K) Scatter dot plots and arithmetic means ± SEM (n = 7 per group; AU) of Msx2 (E), Wnt7a (F), Wnt3a (G), Cbfa1 (H), Alpl (I), Zfp36 (J), and Ankh (K) relative mRNA expression in aortic tissue of mice receiving vehicle or high-dosed cholecalciferol (vD) without or with additional treatment with SGK1 inhibitor EMD638683 (EMD). *P < 0.05, **P < 0.01, ***P < 0.001 statistically significant vs. control mice; P < 0.05, ††P < 0.01, †††P < 0.001 statistically significant vs. vD-treated mice (unpaired 2-tailed t test for D and 1-way ANOVA with Tukey-HSD post hoc test for J and K or with Games-Howell post hoc test for B, C, and EI).
Figure 9
Figure 9. Sgk1 deficiency ameliorates vascular calcification in apolipoprotein E–null mice after subtotal nephrectomy.
(A) Scatter dot plots and arithmetic means ± SEM (n = 5–9 per group; AU) of Sgk1 relative mRNA expression in aortic tissue of mice lacking apolipoprotein E (apoE–/–) without or with subtotal nephrectomy (Nx). ***P < 0.001 statistically significant vs. control mice (unpaired 2-tailed t test). (B) Scatter dot plots and arithmetic means ± SEM (n = 5–10 per group; μg/mg protein) of calcium content in the aortic arch of Sgk1-deficient mice (apoE–/–sgk1–/–) or corresponding WT mice (apoE–/–sgk1+/+) under the apoE–/– background without or with subtotal nephrectomy (Nx). (C) Representative confocal microscopy images (n = 4 per group) showing Msx2 protein expression and scatter dot plots and arithmetic means ± SEM (n = 4 per group; AU) of normalized Msx2 fluorescence intensity in aortic tissues of apoE–/–sgk1–/– mice or corresponding apoE–/–sgk1+/+ mice without or with subtotal nephrectomy (Nx). Green labeling, Msx2 expression; magenta labeling, nuclei; red labeling, actin staining. Scale bars: 25 μm. (DJ) Scatter dot plots and arithmetic means ± SEM (n = 5–9 per group; AU) of Msx2 (D), Wnt7a (E), Wnt3a (F), Cbfa1 (G), Alpl (H), Zfp36 (I), and Ankh (J) relative mRNA expression in aortic tissue of apoE–/–sgk1–/– mice or corresponding apoE–/–sgk1+/+ mice without or with subtotal nephrectomy (Nx). *P < 0.05, **P < 0.01, ***P < 0.001 statistically significant vs. control apoE–/–sgk1+/+ mice; P < 0.05, ††P < 0.01, †††P < 0.001 statistically significant vs. Nx-treated apoE–/–sgk1+/+ mice (1-way ANOVA with Tukey-HSD post hoc test for B, DF, H, and J or with Games-Howell post hoc test for C and G, and Steel-Dwass method for I).
Figure 10
Figure 10. SGK1 inhibition ameliorates uremic serum–induced osteo-/chondrogenic transdifferentiation of primary HAoSMCs.
Scatter dot plots and arithmetic means ± SEM (n = 7 per group; AU) of SGK1 (A), MSX2 (B), CBFA1 (C), and ALPL (D) relative mRNA expression in HAoSMCs following treatment with normal serum (NS) or uremic serum (US) without or with additional treatment with SGK1 inhibitor EMD638683 (EMD). *P < 0.05, **P < 0.01, ***P < 0.001 statistically significant vs. NS-treated HAoSMCs; P < 0.05, ††P < 0.01 statistically significant vs. US-treated HAoSMCs (Steel-Dwass method for A and 1-way ANOVA with Tukey-HSD post hoc test for B and C or with Games-Howell post hoc test for D).

Similar articles

Cited by

References

    1. Rennenberg RJ, Kessels AG, Schurgers LJ, van Engelshoven JM, de Leeuw PW, Kroon AA. Vascular calcifications as a marker of increased cardiovascular risk: a meta-analysis. Vasc Health Risk Manag. 2009;5(1):185–197. - PMC - PubMed
    1. Mizobuchi M, Towler D, Slatopolsky E. Vascular calcification: the killer of patients with chronic kidney disease. J Am Soc Nephrol. 2009;20(7):1453–1464. doi: 10.1681/ASN.2008070692. - DOI - PubMed
    1. Giachelli CM. The emerging role of phosphate in vascular calcification. Kidney Int. 2009;75(9):890–897. doi: 10.1038/ki.2008.644. - DOI - PMC - PubMed
    1. Chen NX, Moe SM. Pathophysiology of vascular calcification. Curr Osteoporos Rep. 2015;13(6):372–380. doi: 10.1007/s11914-015-0293-9. - DOI - PubMed
    1. Paloian NJ, Giachelli CM. A current understanding of vascular calcification in CKD. Am J Physiol Renal Physiol. 2014;307(8):F891–F900. doi: 10.1152/ajprenal.00163.2014. - DOI - PMC - PubMed

Publication types

MeSH terms