Review
. 2020 Mar;39(1-2):55-82.
doi: 10.1002/mas.21570. Epub 2018 Jun 11.

DNA adducts: Formation, biological effects, and new biospecimens for mass spectrometric measurements in humans

Affiliations
Review

DNA adducts: Formation, biological effects, and new biospecimens for mass spectrometric measurements in humans

Byeong Hwa Yun et al. Mass Spectrom Rev. 2020 Mar.

Abstract

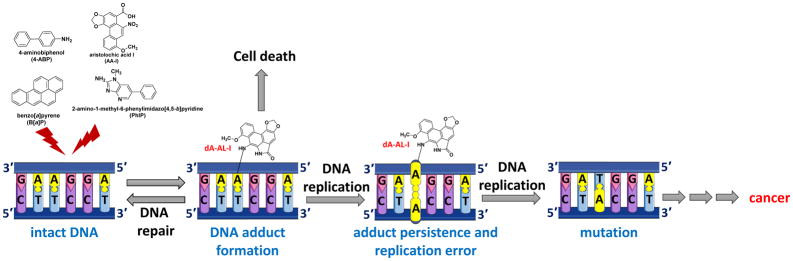
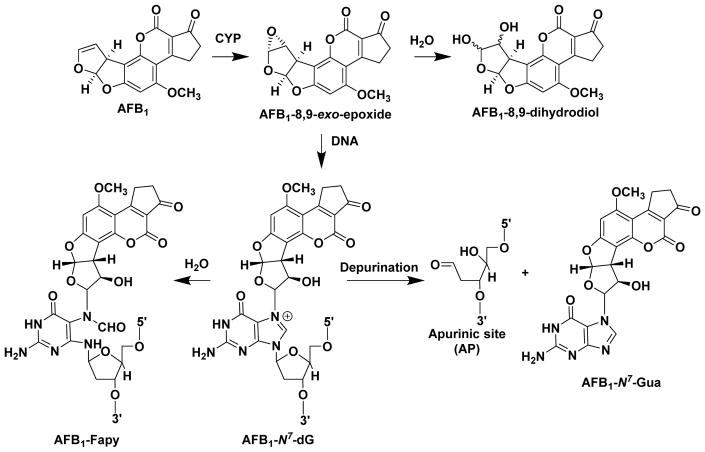
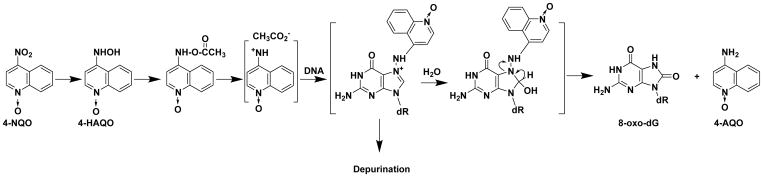
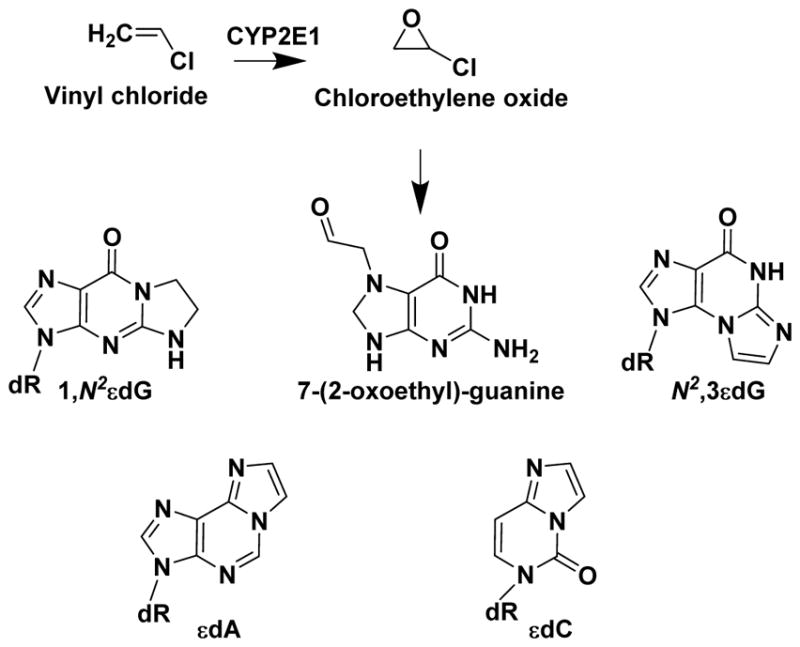
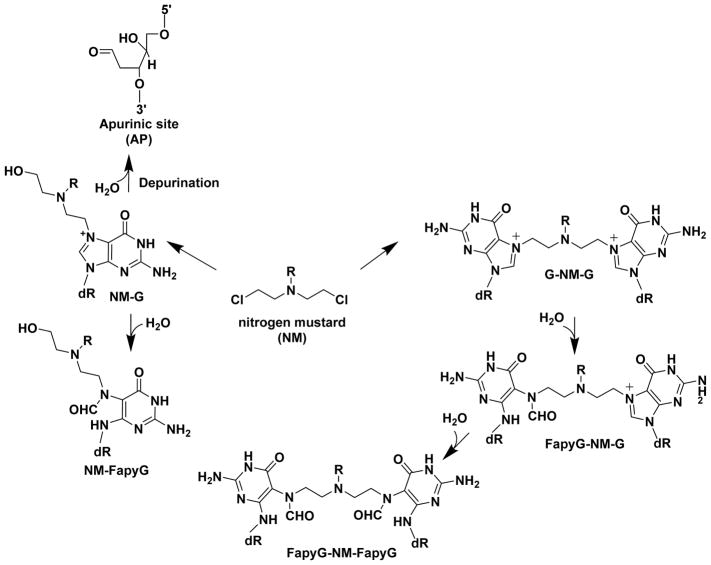
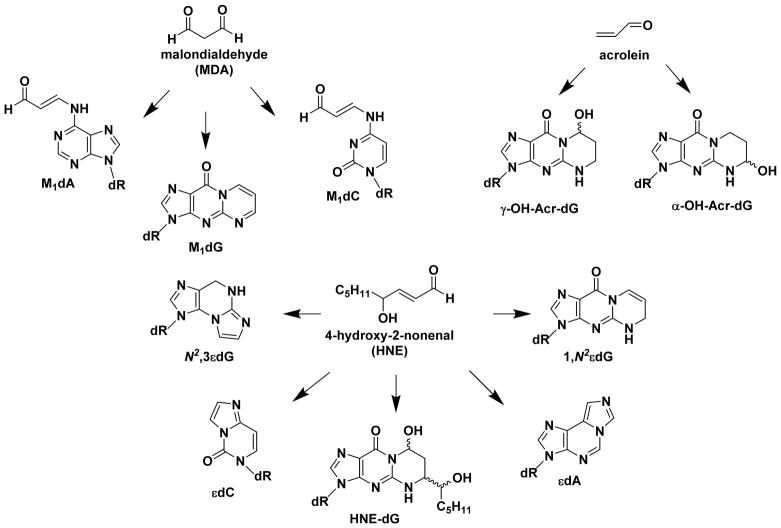
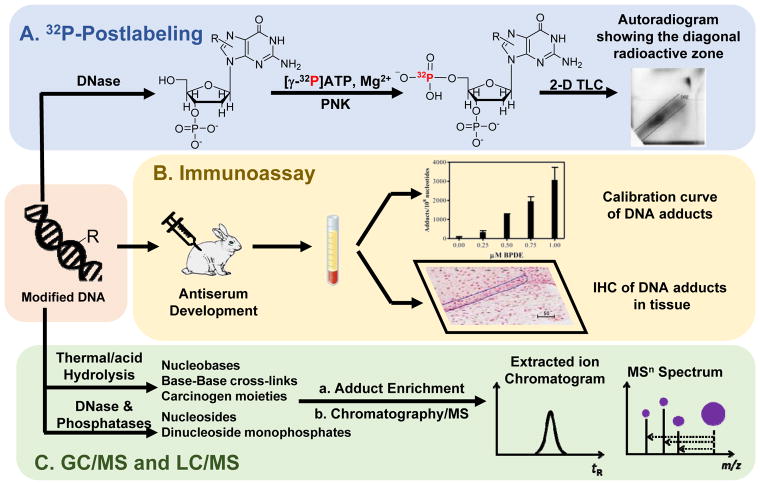
Hazardous chemicals in the environment and diet or their electrophilic metabolites can form adducts with genomic DNA, which can lead to mutations and the initiation of cancer. In addition, reactive intermediates can be generated in the body through oxidative stress and damage the genome. The identification and measurement of DNA adducts are required for understanding exposure and the causal role of a genotoxic chemical in cancer risk. Over the past three decades, 32 P-postlabeling, immunoassays, gas chromatography/mass spectrometry, and liquid chromatography/mass spectrometry (LC/MS) methods have been established to assess exposures to chemicals through measurements of DNA adducts. It is now possible to measure some DNA adducts in human biopsy samples, by LC/MS, with as little as several milligrams of tissue. In this review article, we highlight the formation and biological effects of DNA adducts, and highlight our advances in human biomonitoring by mass spectrometric analysis of formalin-fixed paraffin-embedded tissues, untapped biospecimens for carcinogen DNA adduct biomarker research.

Keywords: DNA adduct; biomarker; biomonitoring; carcinogen; mass spectrometry.


Figures

Figure 1
Figure 1
Role of DNA adducts in mutations and chemical carcinogenesis. The mutation induced by the DNA adduct of aristolochic acid I, an A:T > T:A transversion, is depicted as a prototype.
Figure 2
Figure 2
Reactive sites for adduction and oxidative damage in DNA. Reprinted with permission from ref. (Liu et al, (2015), 2015[Royal Society of Chemistry])
Figure 3
Figure 3
Chemical structures of benzo[a]pyrene (B[a]P), 4-(methylnitrosamino)-1-(3-pyridyl)-1-butanone (NNK), 4-aminobiphenol (4-ABP), 2-amino-1-methyl-6-phenylimidazo[4,5-b]pyridine (PhIP), 2-amino-3,8-dimethylimidazo[4,5-f]quinoxaline (MeIQx), and aristolochic acid (AA-I) and their major DNA adducts.
Figure 4
Figure 4
Chemical structures of benzo[a]pyrene (B[a]P), 4-(methylnitrosamino)-1-(3-pyridyl)-1-butanone (NNK), and their adducts formed on the phosphate backbone of DNA.
Figure 5
Figure 5
The AFB1-N7-Gua and apurinic site (AP) formed by aflatoxin B1 (AFB1).
Figure 6
Figure 6
A proposed mechanism of formation of an apurinic site and 8-oxo-dG from a DNA adduct of 4-nitroquinoline-1-oxide (4-NQO).
Figure 7
Figure 7
Bioactivation of vinyl chloride and its derived DNA adducts.
Figure 8
Figure 8
Chemical structures of nitrogen mustards, their ring-opened Fapy DNA adducts, and apurinic site formation.
Figure 9
Figure 9
Chemical structures of oxidative DNA damage by reactive oxygen species (ROS).
Figure 10
Figure 10
Chemical structures of malondialdehyde (MDA), acrolein, 4-hydroxy-2-nonenal (HNE), and their DNA adducts.
Figure 11
Figure 11
Scheme of experimental approaches for DNA adduct analysis. (A) 32P-postlabeling, (B) immuno-based assay and (C) GC/MS and LC/MS methods.
Figure 12
Figure 12
The fragmentation pathways of modified nucleosides analyzed by LC/MS. (A) the major fragmentation of the modified nucleosides is the neutral loss of deoxyribose, and other common fragmentations include (B) the neutral loss of base and (C) the formation of base ions. Reprinted with permission from ref. (Villalta et al, (2017), 2017[MDPI])
Figure 13
Figure 13
Schematic description of DNA adductomic approaches using different mass spectrometric techniques. The scheme focuses on adducted nucleosides with precursors ([M + H]+) in the m/z range of 330 to 630. (A) The continuous scanning of the constant neutral loss (CNL) of 116 Da in QqQ MS. This approach can be achieved either by using the CNL scan mode of 116 Da (A1), or by pseudo-CNL setting up 300 SRM transitions of [M + H]+ → [M − 116 + H]+ (A2). (B) The data-dependent acquisition (DDA) of top N ions in Q-trap, Q-TOF or Obrtriap. (C) The CNL (116 or 116.0474 Da) triggering of MS3 in trap-based MS that can perform multi-stage MS scan (Q-trap, linear ion trap (LIT), or LIT-Orbitrap). Adduct precursors are fragmented if they are selected by the survey scan in DDA mode (C1) or if they are in the targeted inclusion list (C2). The subsequent MS3 scan is only triggered if the loss of 116 or 116.0474 Da is detected in the MS2 scan. (D) The adductomics approach through sequential window acquisition of all theoretical fragment-ion spectra (SWATH)-like methods in HRAMS. In Q-TOF (D1), a full scan of precursor ions is acquired followed by MSE (ramping collision energy: low to high) including presumed adducts, are fragmented to generate [M + H − 116]+ and other possible fragment ions. In wide-SIM/MS2 (D2) conducted in the LIT-Orbitrap, all ions, including adduct precursors, are detected in SIM of 30 m/z windows in the Orbitrap, and their aglycones are detected in the following MS2 scan.
Figure 14
Figure 14
DNA adducts detected in human tissues by the wide-SIM/MS2 method: dG-C8-PhIP and several endogenous lipid peroxidation adducts in prostate; dA-AL-I in renal tissues. Adduct structures are displayed to the right. Reprinted with permission from ref. (Guo et al, (2017), 2017[American Chemical Society])
Figure 15
Figure 15
Formation of formaldehyde mediated crosslinking of DNA and protein. Formaldehyde permeates the surface of tissue specimens and reacts with a nucleophilic groups of protein and/or DNA base resulting an unstable methylol intermediate and a Schiff base. Then, the second nucleophile from inter- or intramolecular DNA or protein attacks the Schiff base to generate a crosslinked product. A specific example of a protein-DNA crosslink is shown. The atoms are color coded to match those of Fig. 15: cyan, protein; red, formaldehyde; and black, DNA. Reprinted with permission from ref. (Hoffman et al, (2015), 2015[American Society of Biochemistry and Molecular Biology])
Figure 16
Figure 16
Mean level of dA-AL-I adducts present in mouse kidney and liver following treatment with AA-I (0.001–1 mg/kg body weight). Adduct levels measured in freshly frozen and FFPE mouse kidney (○ and ●) and liver (□ and ■) (mean adduct level, SD, N = 4 animals per dose, quadruplicate measurements per animal) were plotted as a function of dose. The overall mean difference in adduct levels between freshly frozen and FFEP kidney and liver tissues across all doses was 21 ± 14% (mean ± SD). dA-AL-I adduct formation was below the limit of detection in liver of mice dosed with AA-I at 0.001 mg/kg body weight. Mean levels of dA-AL-I adducts were significantly statistically different between freshly frozen and FFPE kidney or liver at the following dose treatments of AA-I: kidney, 1 mg/kg, P = 0.03; liver, 0.1 mg/kg, P = 0.01; unpaired two-tailed t-test. Reprinted with permission from ref. (Yun et al, (2013), 2013 [American Chemical Society])
Figure 17
Figure 17
Representative mass chromatograms at the MS3 scan stage and product ion spectra of dA-AL-I in human FFPE kidney DNA (5 μg) spiked with 15N5-labeled internal standard at a level of 5 adducts in 108 bases. The chromatograms were reconstructed from the extracted ions of (panels a and b) dA-AL-I (MS3 at m/z 292, 293, 412) and (panels d and e) [15N5]-dA-AL-I (MS3 at m/z 292, 293, 417). Untreated calf thymus DNA served as negative control (panel a) and a human FFPE kidney cortex tissue from a patient with upper urinary tract carcinoma (panel b). Product ion spectra were acquired at MS3 scan stage for dA-AL-I in FFPE tissue and the internal standard [15N5]-dA-AL-I (panels c and f). The structure of the aglycone [BH2]+ adduct of dA-AL-I and proposed mechanisms of fragmentation of the adduct at the MS3 scan stage are shown in the top right corner. Reprinted with permission from ref. (Yun et al, (2013), 2013 [American Chemical Society])
Figure 18
Figure 18
dA-AL-I adduct levels in matching fresh frozen and FFPE kidney samples, containing both renal cortex and medulla, obtained from 11 individuals residing in endemic regions of Croatia and Serbia who underwent nephroureterectomy and a representative FFPE paraffin embedded renal tissue block. Measurements were done in duplicate and values were within 10% of each other. Reprinted with permission from ref. (Yun et al, (2015), 2015 [Royal Society of Chemistry])
Figure 19
Figure 19
Extracted ion chromatograms (EIC) at the MS2 scan stage of human prostate samples that were (top left) negative and (top right) positive for dG-C8-PhIP. (Bottom row) EIC and MS3 spectra of the human prostate sample that was positive for dG-C8-PhIP.

References

    1. Miller EC. Some current perspectives on chemical carcinogenesis in humans and experimental animals: Presidential Address. Cancer Res. 1978;38:1479–1496. - PubMed
    1. Scharer OD. Chemistry and biology of DNA repair. Angew Chem Int Ed Engl. 2003;42:2946–2974. - PubMed
    1. Sancar A, Lindsey-Boltz LA, Unsal-Kacmaz K, Linn S. Molecular mechanisms of mammalian DNA repair and the DNA damage checkpoints. Annu Rev Biochem. 2004;73:39–85. - PubMed
    1. Wood RD, Mitchell M, Sgouros J, Lindahl T. Human DNA repair genes. Science. 2001;291:1284–1289. - PubMed
    1. Stratton MR, Campbell PJ, Futreal PA. The cancer genome. Nature. 2009;458:719–724. - PMC - PubMed

Publication types

LinkOut - more resources