

Modifier locus mapping of a transgenic F2 mouse population identifies CCDC115 as a novel aggressive prostate cancer modifier gene in humans
- PMID: 29890952
- PMCID: PMC5996485
- DOI: 10.1186/s12864-018-4827-2
Modifier locus mapping of a transgenic F2 mouse population identifies CCDC115 as a novel aggressive prostate cancer modifier gene in humans
Abstract
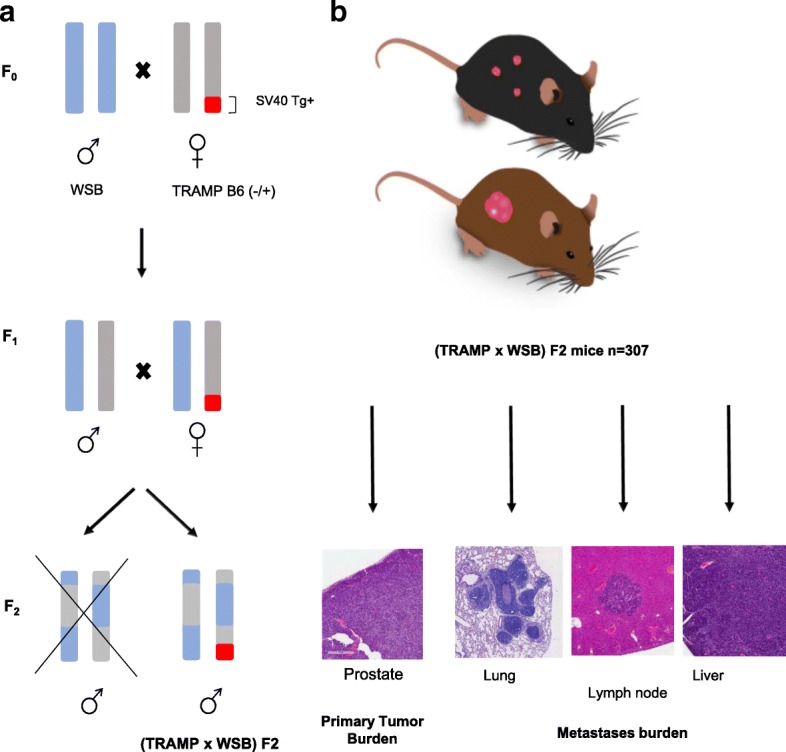
Background: It is well known that development of prostate cancer (PC) can be attributed to somatic mutations of the genome, acquired within proto-oncogenes or tumor-suppressor genes. What is less well understood is how germline variation contributes to disease aggressiveness in PC patients. To map germline modifiers of aggressive neuroendocrine PC, we generated a genetically diverse F2 intercross population using the transgenic TRAMP mouse model and the wild-derived WSB/EiJ (WSB) strain. The relevance of germline modifiers of aggressive PC identified in these mice was extensively correlated in human PC datasets and functionally validated in cell lines.
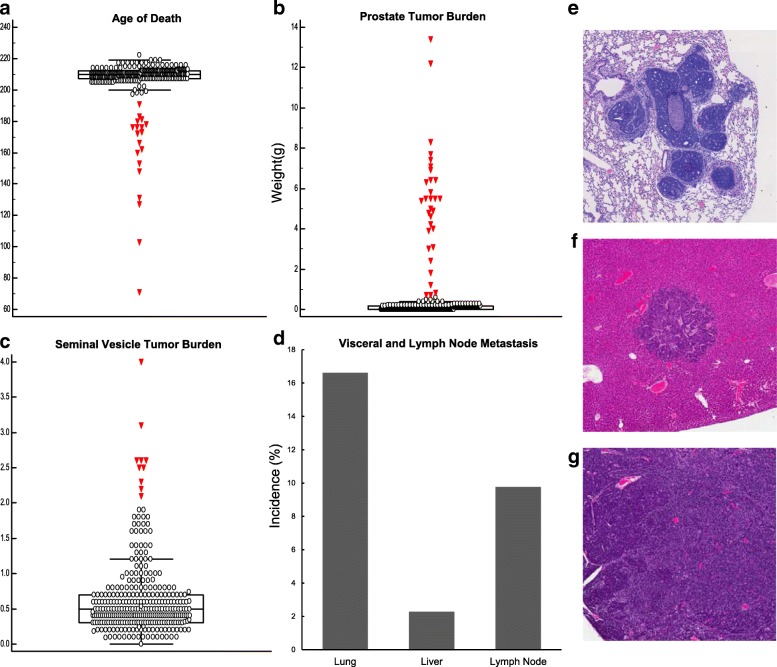
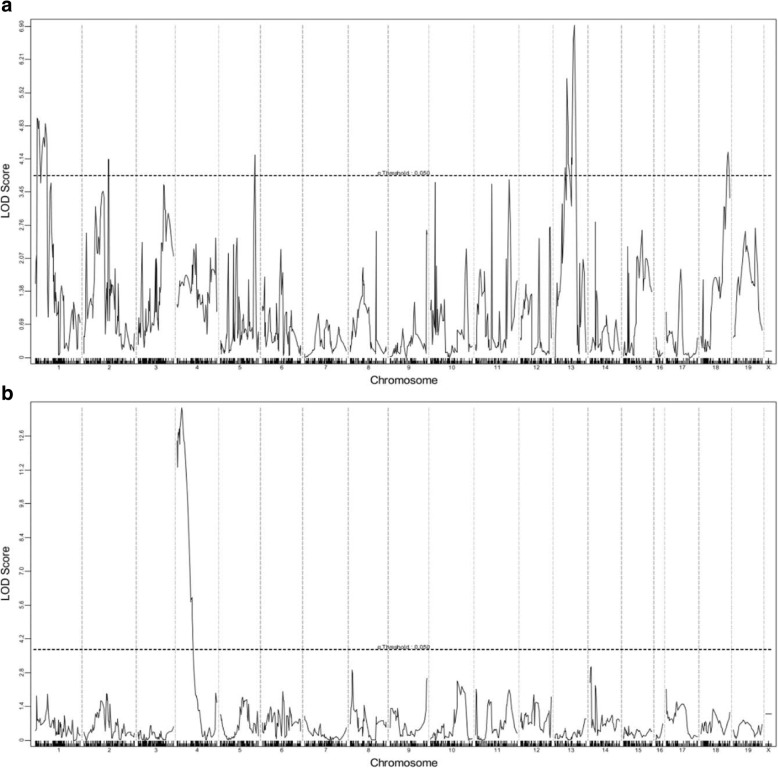
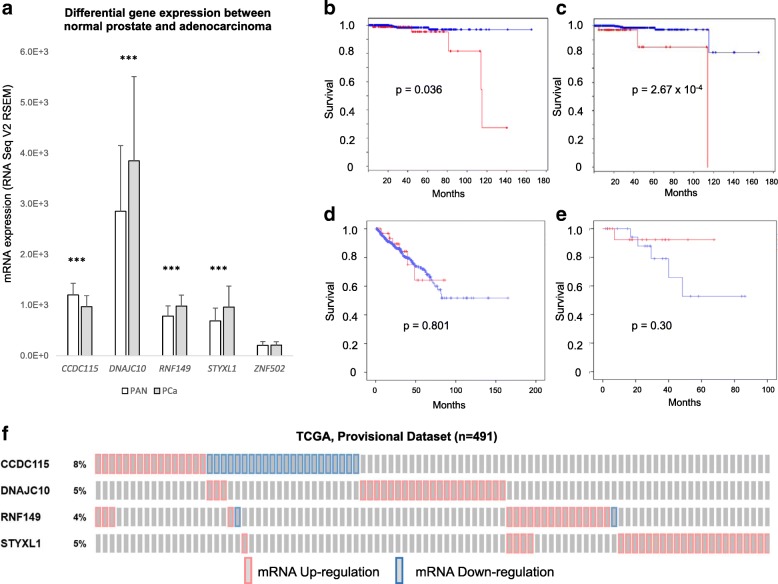
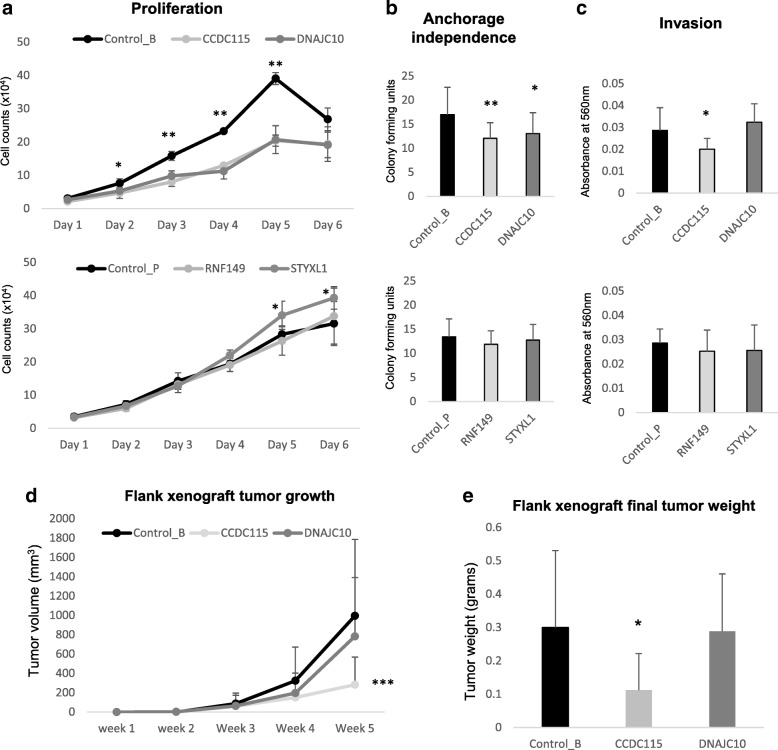
Results: Aggressive PC traits were quantified in a population of 30 week old (TRAMP x WSB) F2 mice (n = 307). Correlation of germline genotype with aggressive disease phenotype revealed seven modifier loci that were significantly associated with aggressive disease. RNA-seq were analyzed using cis-eQTL and trait correlation analyses to identify candidate genes within each of these loci. Analysis of 92 (TRAMP x WSB) F2 prostates revealed 25 candidate genes that harbored both a significant cis-eQTL and mRNA expression correlations with an aggressive PC trait. We further delineated these candidate genes based on their clinical relevance, by interrogating human PC GWAS and PC tumor gene expression datasets. We identified four genes (CCDC115, DNAJC10, RNF149, and STYXL1), which encompassed all of the following characteristics: 1) one or more germline variants associated with aggressive PC traits; 2) differential mRNA levels associated with aggressive PC traits; and 3) differential mRNA expression between normal and tumor tissue. Functional validation studies of these four genes using the human LNCaP prostate adenocarcinoma cell line revealed ectopic overexpression of CCDC115 can significantly impede cell growth in vitro and tumor growth in vivo. Furthermore, CCDC115 human prostate tumor expression was associated with better survival outcomes.
Conclusion: We have demonstrated how modifier locus mapping in mouse models of PC, coupled with in silico analyses of human PC datasets, can reveal novel germline modifier genes of aggressive PC. We have also characterized CCDC115 as being associated with less aggressive PC in humans, placing it as a potential prognostic marker of aggressive PC.
Keywords: CCDC115; DNAJC10; Germline variation; LNCaP; Prostate cancer; Quantitative trait loci; RNF149; STYXL1; TRAMP mouse model.
Conflict of interest statement
Ethics approval
All animals used in this study were handled, housed and used in the experiments humanely in accordance with the NHGRI Animal Care and Use Committee guidelines under animal study protocol G-09-2.
Competing interests
The authors declare that they have no competing interests.
Publisher’s Note
Springer Nature remains neutral with regard to jurisdictional claims in published maps and institutional affiliations.
Figures
References
-
- Beltran H, Rickman DS, Park K, Chae SS, Sboner A, MacDonald TY, Wang Y, Sheikh KL, Terry S, Tagawa ST, et al. Molecular characterization of neuroendocrine prostate cancer and identification of new drug targets. Cancer Discov. 2011;1(6):487–495. doi: 10.1158/2159-8290.CD-11-0130. - DOI - PMC - PubMed
MeSH terms
Substances
Grants and funding
LinkOut - more resources
Full Text Sources
Other Literature Sources
Medical
Molecular Biology Databases
Miscellaneous
