. 2018 Jun 11;17(1):74.
doi: 10.1186/s12938-018-0502-8.

Automatic hand phantom map generation and detection using decomposition support vector machines

Affiliations

Automatic hand phantom map generation and detection using decomposition support vector machines

Huaiqi Huang et al. Biomed Eng Online. .

Abstract

Background: There is a need for providing sensory feedback for myoelectric prosthesis users. Providing tactile feedback can improve object manipulation abilities, enhance the perceptual embodiment of myoelectric prostheses and help reduce phantom limb pain. Many amputees have referred sensation from their missing hand on their residual limbs (phantom maps). This skin area can serve as a target for providing amputees with non-invasive tactile sensory feedback. One of the challenges of providing sensory feedback on the phantom map is to define the accurate boundary of each phantom digit because the phantom map distribution varies from person to person.

Methods: In this paper, automatic phantom map detection methods based on four decomposition support vector machine algorithms and three sampling methods are proposed, complemented by fuzzy logic and active learning strategies. The algorithms and methods are tested on two databases: the first one includes 400 generated phantom maps, whereby the phantom map generation algorithm was based on our observation of the phantom maps to ensure smooth phantom digit edges, variety, and representativeness. The second database includes five reported phantom map images and transformations thereof. The accuracy and training/ classification time of each algorithm using a dense stimulation array (with 100 [Formula: see text] 100 actuators) and two coarse stimulation arrays (with 3 [Formula: see text] 5 and 4 [Formula: see text] 6 actuators) are presented and compared.

Results: Both generated and reported phantom map images share the same trends. Majority-pooling sampling effectively increases the training size, albeit introducing some noise, and thus produces the smallest error rates among the three proposed sampling methods. For different decomposition architectures, one-vs-one reduces unclassified regions and in general has higher classification accuracy than the other architectures. By introducing fuzzy logic to bias the penalty parameter, the influence of pooling-induced noise is reduced. Moreover, active learning with different strategies was also tested and shown to improve the accuracy by introducing more representative training samples. Overall, dense arrays employing one-vs-one fuzzy support vector machines with majority-pooling sampling have the smallest average absolute error rate (8.78% for generated phantom maps and 11.5% for reported and transformed phantom map images). The detection accuracy of coarse arrays was found to be significantly lower than for dense array.

Conclusions: The results demonstrate the effectiveness of support vector machines using a dense array in detecting refined phantom map shapes, whereas coarse arrays are unsuitable for this task. We therefore propose a two-step approach, using first a non-wearable dense array to detect an accurate phantom map shape, then to apply a wearable coarse stimulation array customized according to the detection results. The proposed methodology can be used as a tool for helping haptic feedback designers and for tracking the evolvement of phantom maps.

Keywords: Active learning; Hand amputee; Machine learning; Phantom map; Sensory feedback; Support vector machines.


Figures
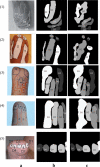
Fig. 1
Fig. 1
Reported phantom map image classification examples. Examples of a reported phantom map images [13, 23, 27, 28], b processed and down-sampled phantom maps, and c predicted phantom maps using OVO-SVM and 2×2 majority pooling
Fig. 2
Fig. 2
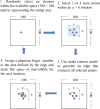
Automatic phantom map detection flow. Automatic phantom map detection flow diagram. In the flow graph, only the generated phantom map images are used as an example
Fig. 3
Fig. 3
Phantom map generation flow. Phantom map generation flow graph
Fig. 4
Fig. 4
CPS controlled by a and b. Phantom sensation coverage control: average CPS of 5 finger phantom maps generated by varying a and b within 0<a,b60
Fig. 5
Fig. 5
CPS distribution. CPS distribution of 400 generated phantom maps (100 samples of each type). x-axis: CPS, y-axis: number of phantom maps.
Fig. 6
Fig. 6
Generated phantom map models. Examples of generated phantom map models
Fig. 7
Fig. 7
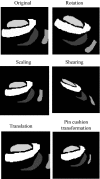
Examples of reported phantom map image transformations, including rotation, scaling, shearing, translation, and pin cushion transformation in contrast to the original phantom map shape
Fig. 8
Fig. 8
Illustration of the proposed sampling methods: a random sampling, b systematic sampling, c 2 × 2 majority pooling sampling, and d 2 × 2 majority pooling sampling. The total number of samples is 100 for each case. The stars represent sampled points. The sampled points were enlarged for better visualization
Fig. 9
Fig. 9
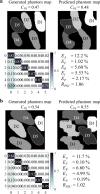
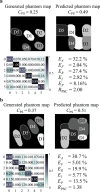
Examples of real and predicted phantom maps. Examples of generated phantom maps, predicted phantom maps, their confusion matrices, absolute error rates (EA), functional error rates (EF), redundancy error rates (ER), insufficiency error rates (EI), and precision error rates(EP) using a BT-SVM with 3×3 majority pooling and b OVA-SVM with 3×3 majority pooling
Fig. 10
Fig. 10
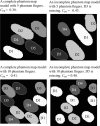
Selected phantom maps PSC. The 16 pre-selected representative phantom maps used for choosing the SVM parameters C and γ. a Four complete phantom maps with 5 phantom fingers, b four incomplete phantom maps with 10 phantom fingers, c four complete phantom maps with 10 fingers, and d four incomplete phantom maps with 10 fingers
Fig. 11
Fig. 11
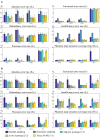
Grand average accuracy using dense array. Grand average error rates and phantom sensation coverage ratios over a all 400 generated phantom maps and b five reported phantom map images and their corresponding transformed images. For 2×2 majority pooling, EMP¯ = 5.35% for generated phantom maps and EMP¯ = 4.27% for reported phantom map images. The grand average accuracy is influenced both by the sampling methods and SVM algorithms used. For both generated and reported phantom maps, OVO-SVM produces the smallest error rate. Even though the absolute error rate (EA) for reported phantom maps is higher than for the generated ones, the more critical metric (function error rate EF) is still within an acceptable range
Fig. 12
Fig. 12
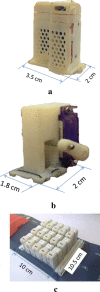
Stimulation devices. Two types of stimulation devices and an experimental coarse stimulation array. These are primarily used for providing sensory feedback for upper limb amputees. a Hybrid (vibrotactile and mechanotactile) stimulation device, b mechanotactile stimulation device
Fig. 13
Fig. 13
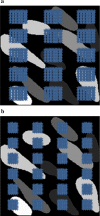
Coarse array sampling methods. Graphical representations of coarse array sampling. The blue stars represent sampling points. a Hybrid stimulation array: 3×5 sampling size with 15×9 pooling size. b Mechanotactile stimulation array: 4×6 sampling size with 7×7 pooling size
Fig. 14
Fig. 14
Grand average accuracy using coarse array. Grand average accuracy results over all 400 generated phantom maps using coarse stimulation arrays, compared with the best scenario case in the dense array (Fig. 12). Statistical analysis using paired t-test was conducted. All the coarse array accuracy results were significantly different (p<0.05 ) from their counterpart when using the dense array
Fig. 15
Fig. 15
Coarse array examples. Examples of using coarse stimulation arrays to detect phantom map distributions. The used array types and algorithms are a OVO-SVM, 3×5 hybrid coarse array (corresponding to 15×9 majority pooling), and b BT-SVM, 4×6 mechanotactile coarse array (corresponding to 7×7 majority pooling)
Fig. 16
Fig. 16
Shift examples. Examples of shifting error caused by a lateral socket shift
Fig. 17
Fig. 17
OVO shift error boxplot. Error rates (EA: red, EF: green, ER: blue, and EI: Magenta, EP: black) as functions of different degrees of shifting (no shift, 2% shift, and 5% shift). The rectangle spans the first and the third quartile of the error rate. The line inside each rectangle shows the median value. The two whiskers above and below each rectangle show the minimum and the maximum. The phantom map models used are 100 complete phantom maps with five fingers. The algorithm used was OVO-SVM with 2×2 majority pooling

Similar articles

Cited by

References

    1. Otto Bock. http://www.ottobock.com/. Accessed 5 Oct 2016.
    1. Touch Bionics: I-Limb. http://www.touchbionics.com/products/active-prostheses/i-limb-ultra. Accessed 5 Oct 2016.
    1. Vincent systems. http://vincentsystems.de/en/. Accessed 5 Oct 2016.
    1. Pylatiuk C, Schulz S, Kargov A, Bretthauer G. Two multiarticulated hydraulic hand prostheses. Artif Organs. 2004;28(11):980–986. doi: 10.1111/j.1525-1594.2004.00014.x. - DOI - PubMed
    1. Dietrich C, Walter-Walsh K, Preißler S, Hofmann GO, Witte OW, Miltner WHR, Weiss T. Sensory feedback prosthesis reduces phantom limb pain: proof of a principle. Neurosci Lett. 2012;507:97–100. doi: 10.1016/j.neulet.2011.10.068. - DOI - PubMed

LinkOut - more resources