. 2018 Aug 9;132(6):565-576.
doi: 10.1182/blood-2018-02-831065. Epub 2018 Jun 11.

Aged murine hematopoietic stem cells drive aging-associated immune remodeling

Affiliations

Aged murine hematopoietic stem cells drive aging-associated immune remodeling

Hanna Leins et al. Blood. .

Abstract

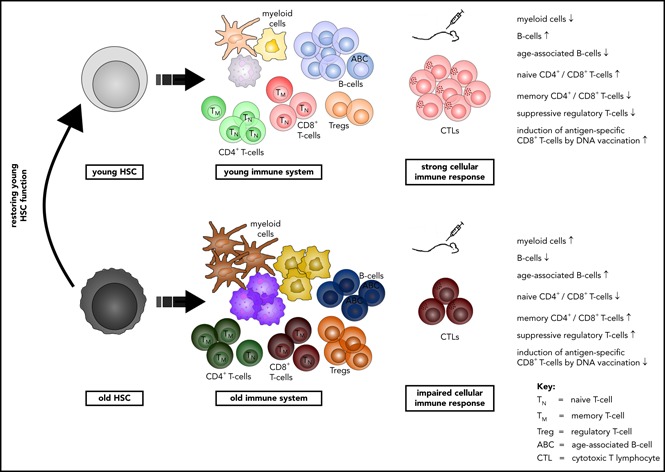
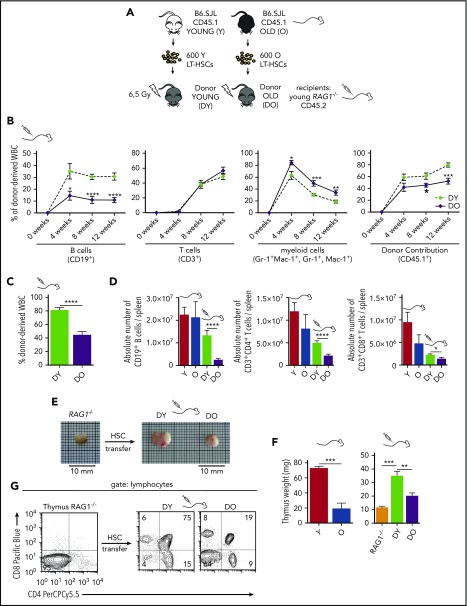
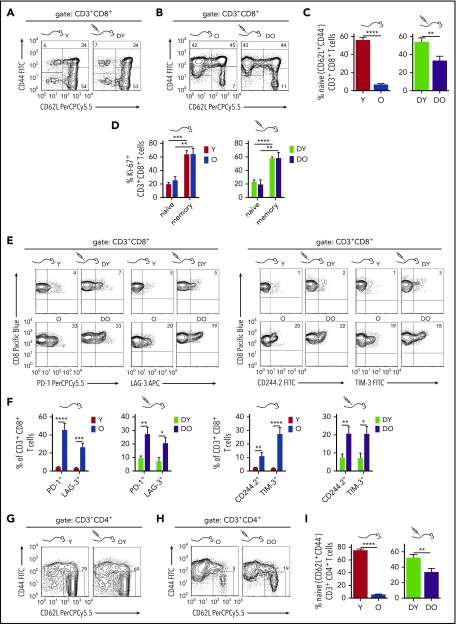
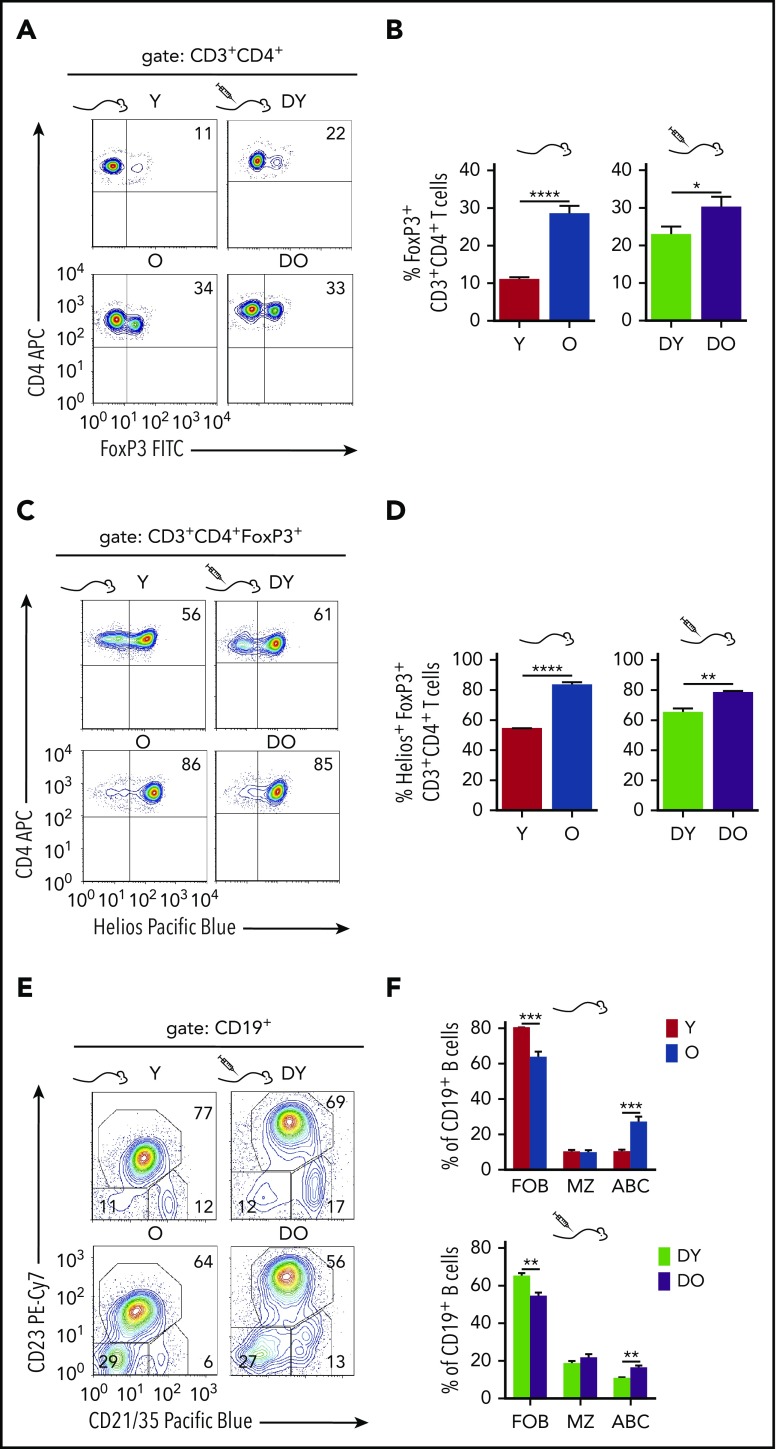
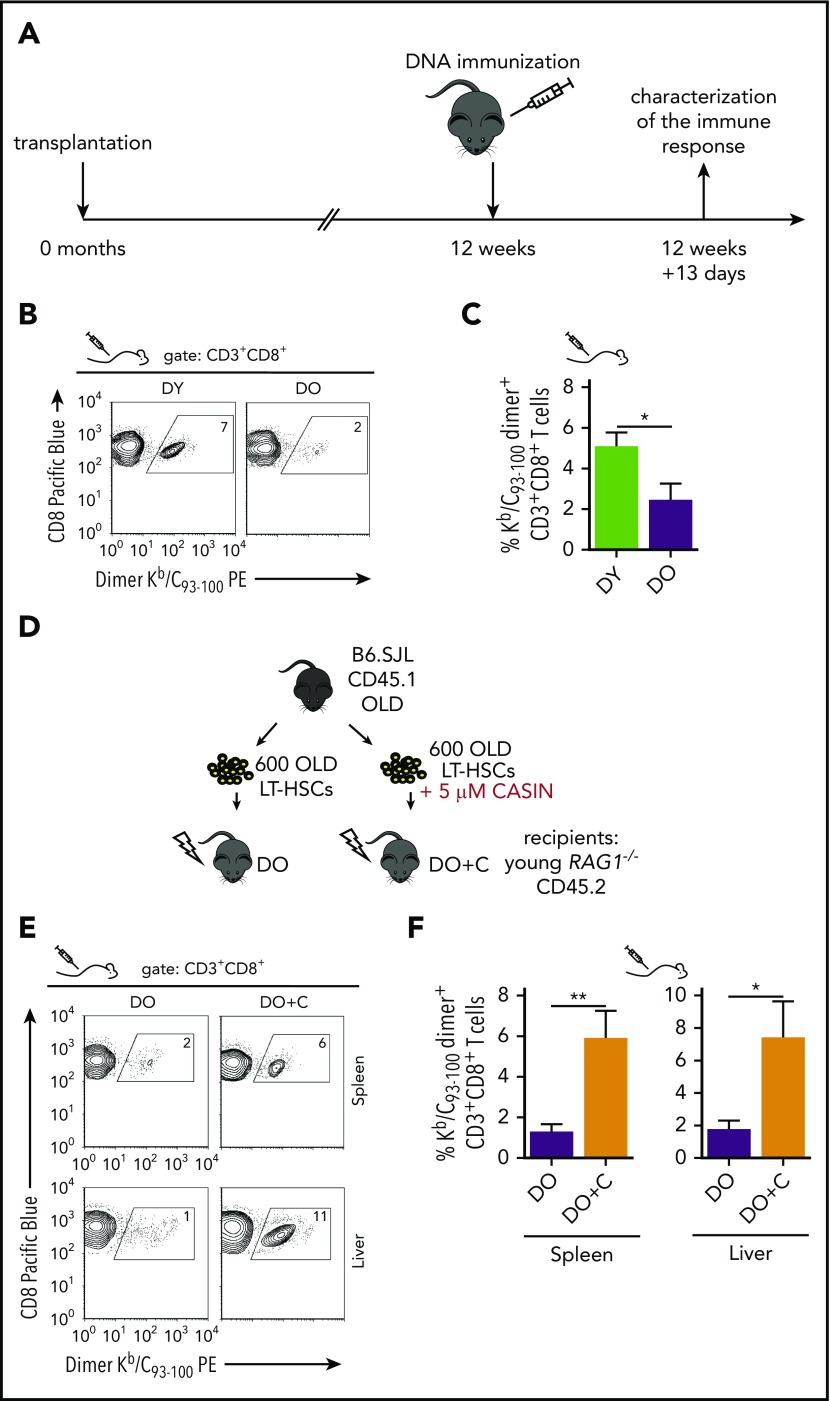
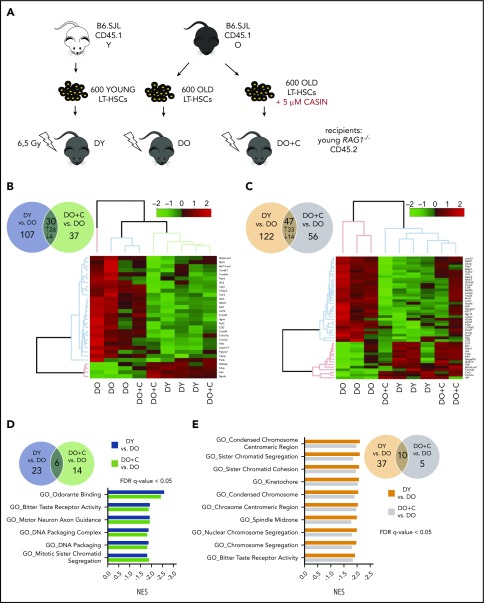
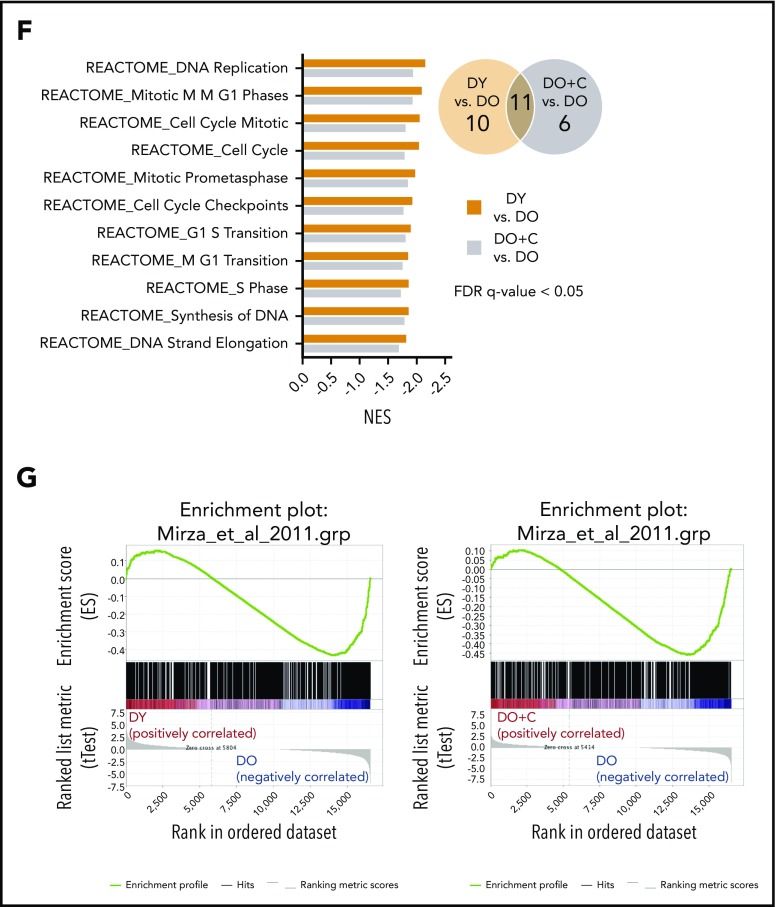
Aging-associated remodeling of the immune system impairs its functional integrity and contributes to increased morbidity and mortality in the elderly. Aging of hematopoietic stem cells (HSCs), from which all cells of the adaptive immune system ultimately originate, might play a crucial role in the remodeling of the aged immune system. We recently reported that aging of HSCs is, in part, driven by elevated activity of the small RhoGTPase Cdc42 and that aged HSCs can be rejuvenated in vitro by inhibition of the elevated Cdc42 activity in aged HSCs with the pharmacological compound CASIN. To study the quality of immune systems stemming selectively from young or aged HSCs, we established a HSC transplantation model in T- and B-cell-deficient young RAG1-/- hosts. We report that both phenotypic and functional changes in the immune system on aging are primarily a consequence of changes in the function of HSCs on aging and, to a large extent, independent of the thymus, as young and aged HSCs reconstituted distinct T- and B-cell subsets in RAG1-/- hosts that mirrored young and aged immune systems. Importantly, aged HSCs treated with CASIN reestablished an immune system similar to that of young animals, and thus capable of mounting a strong immune response to vaccination. Our studies further imply that epigenetic signatures already imprinted in aged HSCs determine the transcriptional profile and function of HSC-derived T and B cells.


Conflict of interest statement

Conflict-of-interest disclosure: The authors declare no competing financial interests.

Figures

None
Graphical abstract
Figure 1.
Figure 1.
Transplantation of DY and DO HSCs in RAG1−/−recipients. (A) Schematic representation of the experimental setup: 600 HSCs were isolated from young (Y) and old (O) B6.SJL (CD45.1) mice and subsequently transplanted into irradiated young RAG1−/− (CD45.2) recipients. (B) Contribution of DY and DO HSCs (CD45.1) to white blood cells was analyzed in peripheral blood every 4 weeks up to 12 weeks (DY, DO, n = 15). (C) 12 weeks posttransplantation, recipient mice were scarified and donor contribution to total white blood cells in spleen was analyzed (DY, n = 16; DO, n = 19). (D) Absolute number of donor-derived splenic CD19+ B cells, CD3+CD4+ and CD3+CD8+ T cells in recipient animals and nontransplanted young and aged B6.SJL mice (Y, n = 8; O, n = 7; DY, n = 16; DO, n = 19). (E) Representative gross anatomy of thymi taken from a nontransplanted RAG1−/− mouse and RAG1−/− recipients transplanted with DY or DO HSCs. (F) Weight of thymus glands isolated from nontransplanted young and aged B6.SJL mice, RAG1−/− mice, and RAG1−/− recipients transplanted with DY and DO HSCs (Y, n = 4; O, RAG1−/−, n = 3; DY, n = 5; DO, n = 8). (G) Representative thymic profile of nontransplanted RAG1−/− mice and RAG1−/− hosts of DY and DO HSCs. Total thymic cells from transplanted and nontransplanted animals were analyzed for CD4 and CD8 expression, using flow cytometry. CD4+, CD8+, and CD4+CD8+ T cells were gated as mononucleated cells within the lymphocyte population. *P < .05; **P < .01; ***P < .001; and ****P < .0001. (B) Two-tailed unpaired Student's t-test, mean ± SEM. (C-D) Two-tailed unpaired Student's t-test, mean + SEM. (D) Only means of nontransplanted young vs aged mice and recipients of DY vs DO HSCs were compared statistically. (F) Two-tailed unpaired Students's t-test, one-way ANOVA, mean + SEM.
Figure 2.
Figure 2.
Phenotypic characterization of splenic CD8+and CD4+T cells in RAG1−/−recipients. (A-B) To identify naive and memory CD8+ T cells, splenocytes were stained for CD3, CD8, CD62L, and CD44 expression. Shown are representative flow cytometry profiles of naive (CD44CD62L+), central memory (CM; CD44+CD62L+), and effector memory (EM; CD44+CD62L) T cells within the CD3+CD8+ T cells from young and aged nontransplanted mice and RAG1−/− recipients of DY and DO HSCs. (C) Quantification of naive CD3+CD8+ T cells within the total CD3+CD8+ population (Y, n = 8; O, n = 7; DY, n = 16; DO, n = 19). (D) Proliferation of CD3+CD8+ T cells isolated from young and old animals and RAG1−/− recipients of DY and DO HSCs was analyzed by expression of the nuclear protein Ki-67. Percentage of naive (CD44) and memory (CD44+) CD3+CD8+ T cells, which are Ki-67+, are depicted (Y, O, n = 4; DY, n = 5; DO, n = 9). (E) CD3+CD8+ T cells isolated from nontransplanted young and old B6.SJL mice and RAG1−/− hosts transplanted with DY or DO HSCs were stained for the exhaustion marker PD-1, CD244.2, TIM-3, and LAG-3. Representative flow cytometric profiles of individual stains are depicted. (F) Percentages of the different inhibitory receptors within CD3+CD8+ T cells are shown (Y, n = 8; O, n = 7; DY, n = 16; DO, n = 19). (G-H) Splenic naive CD4+ T cells from recipients of DY and DO HSCs and nontransplanted young and aged mice were identified as CD44CD62L+ cells within the CD3+CD4+ T-cell population. Representative dot plot profiles of the flow cytometric analysis are depicted. (I) Quantification of naive CD3+CD4+ T cells within the total CD3+CD4+ population (Y, n = 8; O, n = 7; DY, n = 16; DO, n = 19). *P < .05; **P < .01; ***P < .001; ****P < .0001 2-tailed unpaired Student's t-test, mean + SEM.
Figure 3.
Figure 3.
Regulatory T- and B-cell subsets in HSC transplanted RAG1−/−mice. To identify regulatory T cells, splenocytes were stained for surface expression of CD3 and CD4 as well as intracellular FoxP3 expression. Representative graphs of individual stains for FoxP3 as well as quantification of FoxP3+ cells within the CD3+CD4+ population are shown in (A) and (B), respectively (Y, n = 8; O, n = 7; DY, n = 15; DO, n = 17). Regulatory T cells coexpressing the Ikaros zinc finger transcription factor Helios were identified within the FoxP3+ population. (C) Representative dot plot profiles of the underlying flow cytometric analysis and (D) quantification of Helios+ regulatory T cells within the FoxP3+ population (Y, n = 5; O, n = 5; DY, n = 4; DO, n = 7). For characterization of splenic B cells, CD19+ cells from young and old nontransplanted B6.SJL mice and RAG1−/− recipients of DY and DO HSCs were stained for follicular B cells (FOB; CD21/35+CD23+), marginal zone B cells (MZ; CD21/35highCD23), and age-associated B cells (ABC; CD21/35CD23). Shown are representative graphs of individual stains (E) and quantification of these B-cell populations within the total CD19+ population (Y, n = 8; O, n = 7; DY, n = 13; DO, n = 16) (F). *P < .05; **P < .01; ***P < .001; ****P < .0001, 2-tailed unpaired Student's t-test, mean + SEM.
Figure 4.
Figure 4.
Priming CD8+T-cell responses in HSC-transplanted RAG1−/−hosts by DNA vaccination. (A) Schematic representation of the experimental set-up: 12 weeks after transplantation, recipient mice were immunized with pCI/C DNA encoding the hepatitis B virus Core antigen. Thirteen days after immunization, splenic Kb/C93-100 dimer+ CD8+ T-cell frequencies were determined by flow cytometry. Representative graphs of individual stains as well as quantification of the KbC93-100 dimer staining are shown in (B) and (C), respectively (DY, n = 9; DO, n = 8). (D) Schematic representation of the experimental set-up. HSCs were isolated from old B6.SJL mice and cultured for 16 hours ± 5 µM CASIN. Subsequently, 600 HSCs were transplanted in subleathally irradiated young RAG1−/− mice. Twelve weeks after transplantation, recipient mice were immunized with the mammalian expression vector pCI/C. Thirteen days after immunization, transplanted mice were sacrificed and the percentage of Kb/C93-100 dimer+ cells was determined within the CD3+CD8+ population by flow cytometry. Quantification as well as representative graphs of the Kb/C93-100 dimer staining for spleen (DO, n = 11; DO+C, n = 9) and liver (DO, n = 8; DO+C, n = 6) are shown in (E) and (F), respectively. *P < .05; **P < .01, 2-tailed unpaired Student's t-test, mean + SEM.
Figure 5.
Figure 5.
Gene expression profiles of naive CD4+T cells and CD19+B cells isolated from HSC-transplanted RAG1−/−mice. (A) Schematic representation of the experimental setup: HSCs were isolated from young and old B6.SJL (CD45.1) mice and cultured for 16 hours ± 5 µM CASIN. 600 HSCs were transplanted into sublethally irradiated young RAG1−/− (CD45.2) recipients. Twelve weeks after transplantation, naive CD4+ T and CD19+ B cells were isolated and RNA sequencing was performed (B) Venn diagram of significantly differentially expressed genes in naive CD4+ T cells between DY vs DO (blue circle) and DO+C vs DO (green circle). The heat map shows unsupervised clustering of the genes expressed differentially in the same direction between the 2 groups. (C) Venn diagram of significantly differentially expressed genes in CD19+ B cells between DY vs DO (orange circle) and DO+C vs DO (violet circle). Genes, differentially expressed in the same direction between the 2 groups, are depicted as heat map (unsupervised clustering). (D) Venn diagram shows GSEA of significantly enriched GO gene sets differentially expressed in naive CD4+ T cells between DY vs DO (blue circle) and DO+C vs DO (green circle). Normalized enrichment scores (NES) of GO categories differentially expressed in the same direction between the 2 groups are depicted. (E-F) Venn diagrams show GSEA of significantly enriched GO and REACTOME gene sets, respectively, differentially expressed in CD19+ B cells between DY vs DO (orange circle) and DO+C vs DO (violet circle). NES of GO and REACTOM categories differentially expressed in the same direction between the 2 groups are depicted. (G) GSEA enrichment plots of correlation between gene sets previously identified by Mirza et al. to be differentially expressed in naive CD4+ T cells from nontransplanted young and aged mice and differentially expressed genes between DY and DO HSC recipients as well as DO+C and DO recipients. DY, DO and DO+C, n = 3. (D-F) FDR q-value < 0.05; (G) FDR q-value < 0.25.
Figure 5.
Figure 5.
Gene expression profiles of naive CD4+T cells and CD19+B cells isolated from HSC-transplanted RAG1−/−mice. (A) Schematic representation of the experimental setup: HSCs were isolated from young and old B6.SJL (CD45.1) mice and cultured for 16 hours ± 5 µM CASIN. 600 HSCs were transplanted into sublethally irradiated young RAG1−/− (CD45.2) recipients. Twelve weeks after transplantation, naive CD4+ T and CD19+ B cells were isolated and RNA sequencing was performed (B) Venn diagram of significantly differentially expressed genes in naive CD4+ T cells between DY vs DO (blue circle) and DO+C vs DO (green circle). The heat map shows unsupervised clustering of the genes expressed differentially in the same direction between the 2 groups. (C) Venn diagram of significantly differentially expressed genes in CD19+ B cells between DY vs DO (orange circle) and DO+C vs DO (violet circle). Genes, differentially expressed in the same direction between the 2 groups, are depicted as heat map (unsupervised clustering). (D) Venn diagram shows GSEA of significantly enriched GO gene sets differentially expressed in naive CD4+ T cells between DY vs DO (blue circle) and DO+C vs DO (green circle). Normalized enrichment scores (NES) of GO categories differentially expressed in the same direction between the 2 groups are depicted. (E-F) Venn diagrams show GSEA of significantly enriched GO and REACTOME gene sets, respectively, differentially expressed in CD19+ B cells between DY vs DO (orange circle) and DO+C vs DO (violet circle). NES of GO and REACTOM categories differentially expressed in the same direction between the 2 groups are depicted. (G) GSEA enrichment plots of correlation between gene sets previously identified by Mirza et al. to be differentially expressed in naive CD4+ T cells from nontransplanted young and aged mice and differentially expressed genes between DY and DO HSC recipients as well as DO+C and DO recipients. DY, DO and DO+C, n = 3. (D-F) FDR q-value < 0.05; (G) FDR q-value < 0.25.

Comment in

References

    1. Black S, De Gregorio E, Rappuoli R. Developing vaccines for an aging population. Sci Transl Med. 2015;7(281):281ps8. - PubMed
    1. Boraschi D, Aguado MT, Dutel C, et al. The gracefully aging immune system. Sci Transl Med. 2013;5(185):185ps8. - PubMed
    1. Nikolich-Žugich J. The twilight of immunity: emerging concepts in aging of the immune system. Nat Immunol. 2018;19(1):10-19. - PubMed
    1. Decman V, Laidlaw BJ, Doering TA, et al. Defective CD8 T cell responses in aged mice are due to quantitative and qualitative changes in virus-specific precursors. J Immunol. 2012;188(4):1933-1941. - PMC - PubMed
    1. Aw D, Silva AB, Maddick M, von Zglinicki T, Palmer DB. Architectural changes in the thymus of aging mice. Aging Cell. 2008;7(2):158-167. - PubMed

Publication types

MeSH terms