. 2018 Jun 26;115(26):E6085-E6094.
doi: 10.1073/pnas.1803841115. Epub 2018 Jun 11.

A stress recovery signaling network for enhanced flooding tolerance in Arabidopsis thaliana

Affiliations

A stress recovery signaling network for enhanced flooding tolerance in Arabidopsis thaliana

Elaine Yeung et al. Proc Natl Acad Sci U S A. .

Abstract

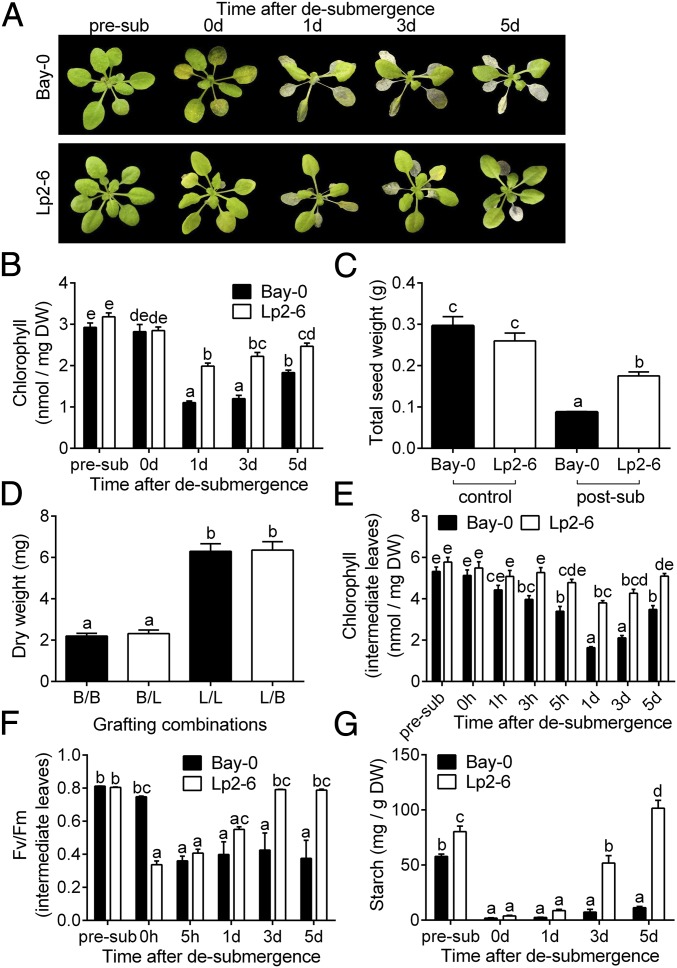
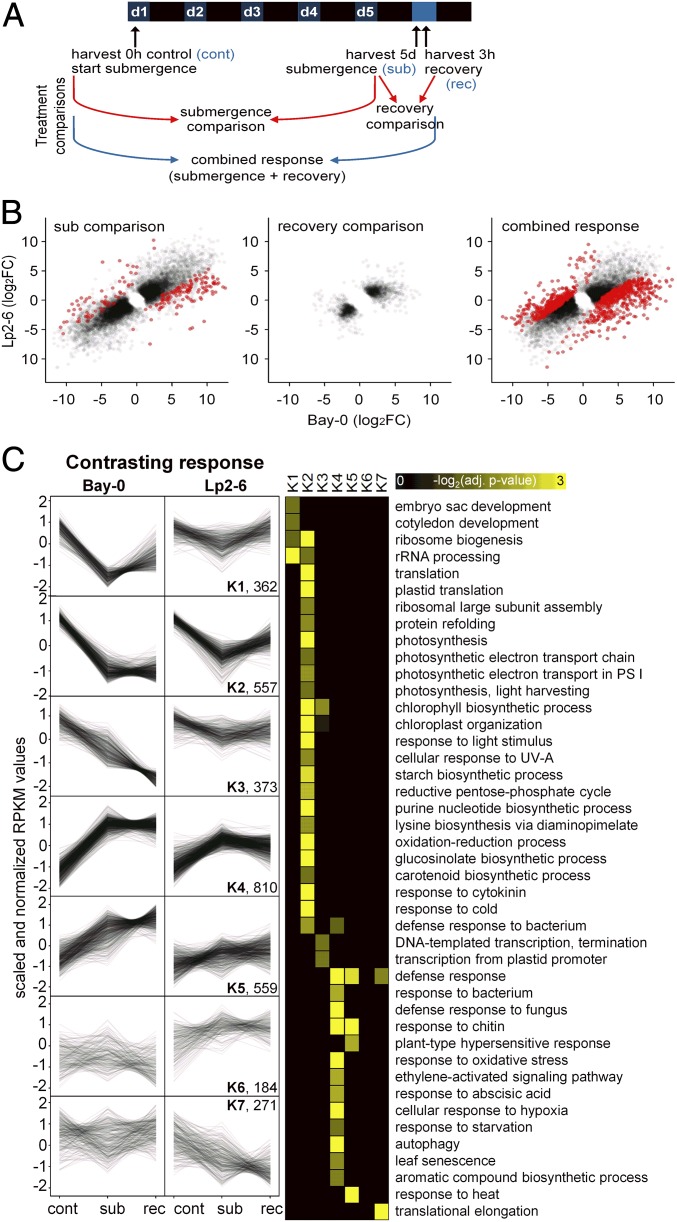
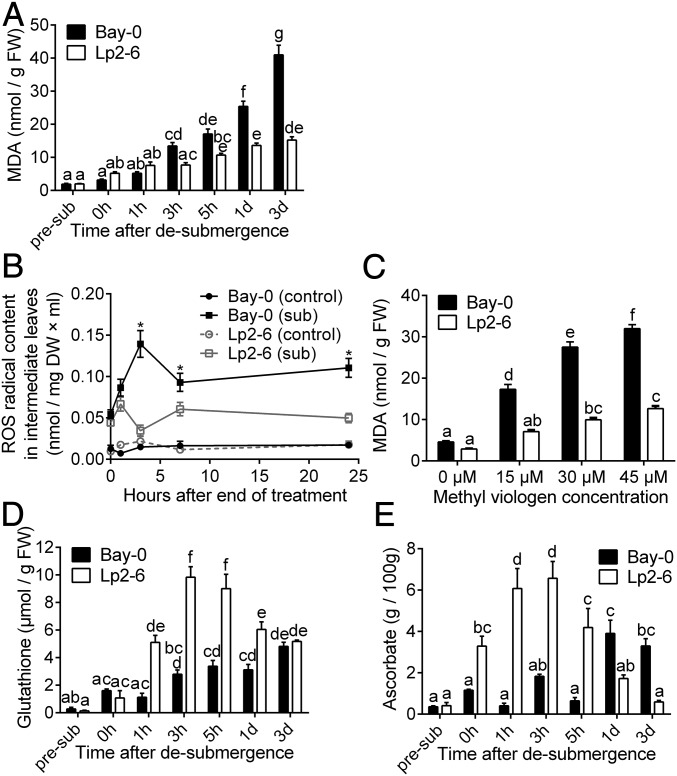
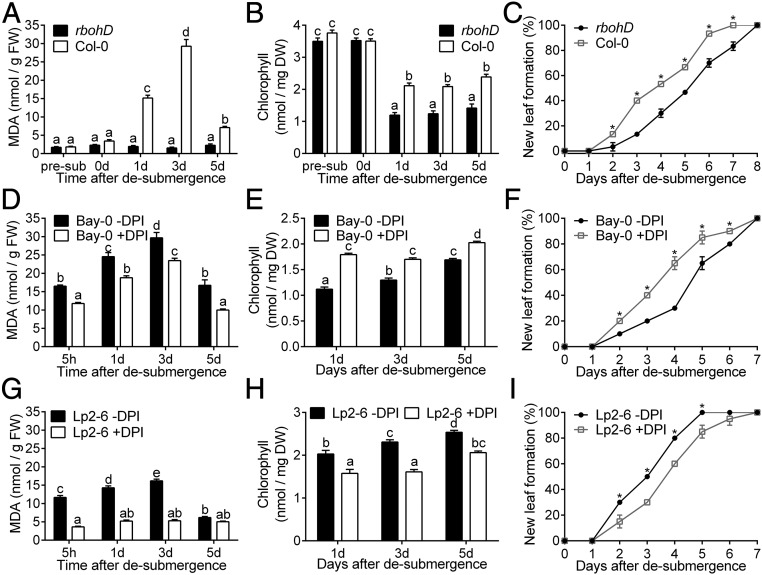
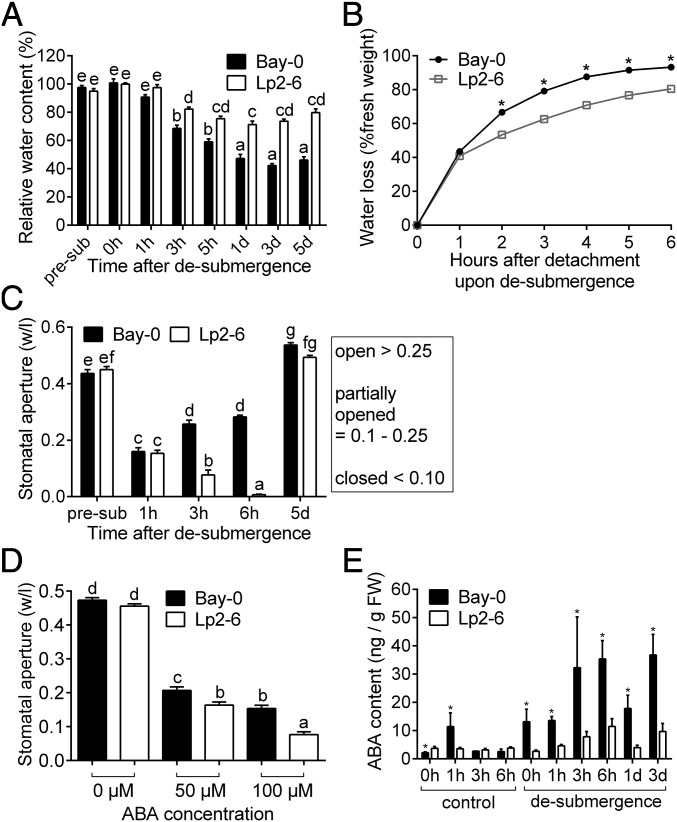
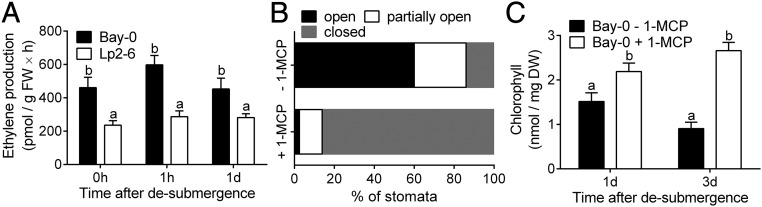
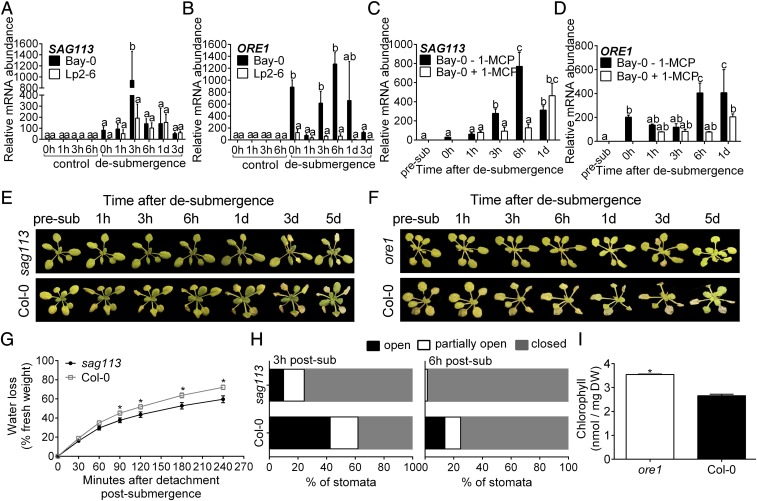
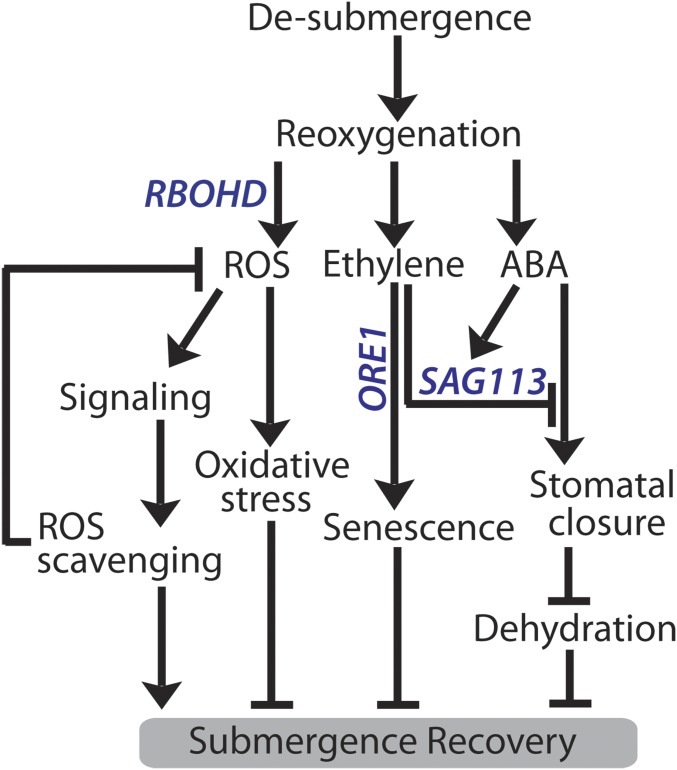
Abiotic stresses in plants are often transient, and the recovery phase following stress removal is critical. Flooding, a major abiotic stress that negatively impacts plant biodiversity and agriculture, is a sequential stress where tolerance is strongly dependent on viability underwater and during the postflooding period. Here we show that in Arabidopsis thaliana accessions (Bay-0 and Lp2-6), different rates of submergence recovery correlate with submergence tolerance and fecundity. A genome-wide assessment of ribosome-associated transcripts in Bay-0 and Lp2-6 revealed a signaling network regulating recovery processes. Differential recovery between the accessions was related to the activity of three genes: RESPIRATORY BURST OXIDASE HOMOLOG D, SENESCENCE-ASSOCIATED GENE113, and ORESARA1, which function in a regulatory network involving a reactive oxygen species (ROS) burst upon desubmergence and the hormones abscisic acid and ethylene. This regulatory module controls ROS homeostasis, stomatal aperture, and chlorophyll degradation during submergence recovery. This work uncovers a signaling network that regulates recovery processes following flooding to hasten the return to prestress homeostasis.

Keywords: dehydration; flooding; reactive oxygen species; recovery; ribosome footprinting.


Conflict of interest statement

The authors declare no conflict of interest.

Figures

Fig. 1.
Fig. 1.
Effects of complete submergence on subsequent recovery in two Arabidopsis accessions, Bay-0 and Lp2-6. (A) Representative shoots of Bay-0 and Lp2-6 before submergence (pre-sub), after 5 d of dark submergence (0 d), and 1, 3, and 5 d of recovery. (B) Chlorophyll content of whole rosettes (n = 9 or 10). DW, dry weight. (C) Total seed output of individual control and submergence recovery plants (n = 10 to 15). (D) Shoot dry weight of grafted plants submerged for 5 d and recovered for another 5 d under control conditions. Grafting combinations represent the accession of the shoot/root (B, Bay-0; L, Lp2-6) (n = 45 to 60). (E) Chlorophyll content in intermediary leaves (n = 15). (F) Maximum quantum efficiency of photosystem II (Fv/Fm) in intermediary leaves (n = 10). (G) Starch content in whole rosettes (n = 3). Data represent mean ± SEM from independent experiments. Significant difference is denoted by different letters (P < 0.05, one- or two-way ANOVA with Tukey’s multiple comparisons test).
Fig. 2.
Fig. 2.
Submergence and recovery induce distinct changes in ribosome-associated transcripts. (A) Overview of Ribo-seq experimental design and treatment comparisons. Bay-0 and Lp2-6 intermediary leaves were harvested before treatment (control, cont), 5-d dark submergence (submergence, sub), and 3 h after desubmergence (recovery, rec). The submergence effect was investigated by comparing 5-d submergence-treated samples with the 0-h control (“submergence comparison”). Both samples were harvested at the same time during the photoperiod. The recovery effect was a comparison of 5-d submerged samples with those recovered for 3 h in control air and light conditions after desubmergence (“recovery comparison”). The combined effect of submergence and recovery was determined by comparing desubmerged 3-h recovery plants with 0-h control plants (“combined response”). (B) Scatterplots comparing Bay-0 and Lp2-6 log2FC (fold change) under submergence comparison, recovery comparison, and combined response. Red dots represent accession × treatment DEGs (Padj < 0.05) and black dots are remaining DEGs. (C) Fuzzy K-means clustering of genes showing different behavior in Bay-0 and Lp2-6. Control (0 h, cont), submergence (5 d, sub), and recovery (3 h, rec) conditions were individually plotted as black lines using scaled and normalized reads per kilobase per million mapped reads (RPKM) values, and the total number of DEGs in each cluster is noted. GO enrichment for each cluster is visualized as a heatmap.
Fig. 3.
Fig. 3.
Lp2-6 effectively contains oxidative stress resulting from excessive ROS during recovery. (A) Malondialdehyde content of Bay-0 and Lp2-6 rosettes before submergence (pre-sub), after 5 d of submergence (0h), and during subsequent recovery (n = 7). FW, fresh weight. (B) Electron paramagnetic resonance spectroscopy quantified ROS in Bay-0 and Lp2-6 intermediary leaves of control or recovering plants after 5 d of submergence (n = 30). Asterisks represent significant difference (P < 0.05) between submerged accessions at the specified time point. (C) MDA content of rosettes with varying concentrations of exogenously applied methyl viologen (n = 7). (D and E) Glutathione (D) and ascorbate (E) content in intermediary leaves recovering from 5 d of submergence (n = 3). Data represent mean ± SEM. In all panels except B, significant difference is denoted by different letters (P < 0.05, one- or two-way ANOVA with Tukey’s multiple comparisons test).
Fig. 4.
Fig. 4.
Postsubmergence ROS formation mediated through RBOHD regulates recovery. (AC) MDA content (n = 12) (A), chlorophyll content (n = 12) (B), and new leaf formation (C) of rbohD-3 and Col-0 (n = 30) rosettes during recovery following 5 d of submergence. (DF) MDA content (n = 20) (D), chlorophyll content (n = 20) (E), and new leaf formation (n = 20) (F) of Bay-0 plants with or without diphenyleneiodonium application upon desubmergence. (GI) MDA content (n = 20) (G), chlorophyll content (n = 20) (H), and new leaf formation (n = 20) (I) during recovery of Lp2-6 plants sprayed with or without DPI upon desubmergence. Data represent mean ± SEM. Asterisks represent a significant difference between the two accessions at the specified time point (P < 0.05, two-way ANOVA with Sidak’s multiple comparisons test). Significant difference is denoted by different letters (P < 0.05, two-way ANOVA with Tukey’s multiple comparisons test).
Fig. 5.
Fig. 5.
Higher desiccation stress in Bay-0 corresponds to earlier stomatal opening during recovery. (A) Relative water content in intermediary leaves before submergence (pre-sub), after 5 d of submergence (0h), and subsequent recovery time points (n = 15). (B) Hourly water loss of 10-leaf-stage rosettes after detachment from roots immediately upon desubmergence (0 h) compared with the initial fresh weight (n = 30). (C) Stomatal width aperture (based on width/length ratio) measured using stomatal imprints on the adaxial side of intermediary leaves (n = 85 to 227) of plants before treatment (pre-sub), and subsequent recovery time points. (D) Stomatal aperture of epidermal peels from intermediary leaves of plants grown under control conditions and incubated in 0, 50, or 100 µM ABA (n = 180). (E) ABA quantification in intermediary leaves of Bay-0 and Lp2-6 recovering from 5 d of submergence and corresponding controls (n = 3). Data represent mean ± SEM. Different letters represent significant difference, and asterisks represent significant differences between the accessions at the specified time point (P < 0.05; B, two-way ANOVA with Tukey’s multiple comparisons test; E, one-way ANOVA with planned comparisons on log-transformed data).
Fig. 6.
Fig. 6.
Dehydration and accelerated senescence in Bay-0 upon desubmergence is linked to higher ethylene evolution during recovery. (A) Ethylene emissions from Bay-0 and Lp2-6 shoots after desubmergence (n = 4 or 5). (B) Stomatal classification at 3 or 6 h after desubmergence of Bay-0 plants treated with or without the ethylene perception inhibitor 1-MCP (n = 280 to 300). (C) Chlorophyll content in whole rosettes of Bay-0 treated with or without 1-MCP (n = 5 or 6). 1-MCP treatment was imposed immediately upon desubmergence. Data represent mean ± SEM. Different letters represent significant difference (P < 0.05, two-way ANOVA with Tukey’s multiple comparisons test).
Fig. 7.
Fig. 7.
Ethylene-mediated dehydration and senescence in Bay-0 postsubmergence link to the induction of SAG113 inhibiting stomatal closure and ORE1 promoting chlorophyll breakdown. (A and B) Relative mRNA abundance of SAG113 (A) and ORE1 (B) measured by qRT-PCR in Bay-0 and Lp2-6 intermediary leaves following desubmergence after 5 d of submergence (n = 3 biological replicates). (C and D) Relative mRNA abundance of SAG113 (C) and ORE1 (D) measured by qRT-PCR in intermediary leaves of Bay-0 plants treated with and without 1-MCP (n = 3 or 4 biological replicates). (E and F) Representative images of sag113 (E) and ore1 (F) mutants during recovery after 4 d of submergence compared with wild-type Col-0. (G) Water loss in sag113 and Col-0 after detachment from roots upon desubmergence compared with the initial fresh weight (n = 4). (H) Stomatal classification at 3 and 6 h after desubmergence for sag113 and Col-0 submerged for 4 d (n = 120–180). (I) Chlorophyll content in whole rosettes of ore1 and Col-0 after 5 d of recovery following 4 d of submergence (n = 3). Data represent mean ± SEM. Different letters represent significant difference, and asterisks represent significant difference between genotypes at the specified time point (P < 0.05, two-way ANOVA with Tukey’s multiple comparisons test).
Fig. 8.
Fig. 8.
Signaling network mediating postsubmergence recovery. Following prolonged submergence, the shift to a normoxic environment generates the postsubmergence signals ROS, ethylene, and ABA. A ROS burst upon reoxygenation occurs due to reduced scavenging and increased production in Bay-0 from several sources, including RBOHD activity. While excessive ROS accumulation is detrimental and can cause cellular damage, ROS-mediated signaling is required to trigger downstream processes that benefit recovery, including enhanced antioxidant capacity for ROS homeostasis. Signals triggering RBOHD induction following desubmergence are unclear, but hormonal control is most likely involved. Recovering plants experience physiological drought due to reduced root conductance, resulting in increased ABA levels postsubmergence which can regulate stomatal movements to offset excessive water loss. High ethylene production in Bay-0 caused by ACC oxidation upon reaeration can counter drought-induced stomatal closure via induction of the protein phosphatase 2C SAG113, accelerating water loss and senescence. Higher transcript abundance of SAG113 in Bay-0 is also positively regulated by ABA, and could be a means to speed up water loss and senescence in older leaves. Ethylene also accelerates chlorophyll breakdown via the NAC transcription factor ORE1. The timing of stomatal reopening during recovery is critical for balancing water loss with CO2 assimilation, and is likely regulated by postsubmergence ethylene–ABA dynamics and signaling interactions.

References

    1. Bailey-Serres J, Lee SC, Brinton E. Waterproofing crops: Effective flooding survival strategies. Plant Physiol. 2012;160:1698–1709. - PMC - PubMed
    1. Voesenek LACJ, Bailey-Serres J. Flood adaptive traits and processes: An overview. New Phytol. 2015;206:57–73. - PubMed
    1. Hirabayashi Y, et al. Global flood risk under climate change. Nat Clim Chang. 2013;3:816–821.
    1. Jackson MB. Ethylene and responses of plants to soil waterlogging and submergence. Annu Rev Plant Physiol. 1985;36:145–174.
    1. Armstrong W. Aeration in higher plants. Adv Bot Res. 1980;7:225–332.

Publication types

MeSH terms

LinkOut - more resources