. 2018 Jun 26;115(26):E6000-E6009.
doi: 10.1073/pnas.1802188115. Epub 2018 Jun 11.

Glycosylation-dependent galectin-receptor interactions promote Chlamydia trachomatis infection

Affiliations

Glycosylation-dependent galectin-receptor interactions promote Chlamydia trachomatis infection

Agustin L Lujan et al. Proc Natl Acad Sci U S A. .

Abstract

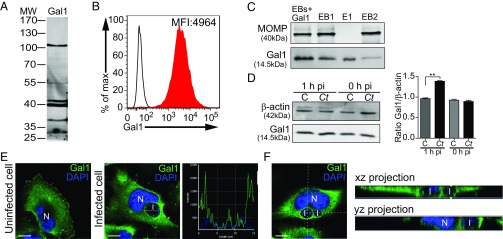
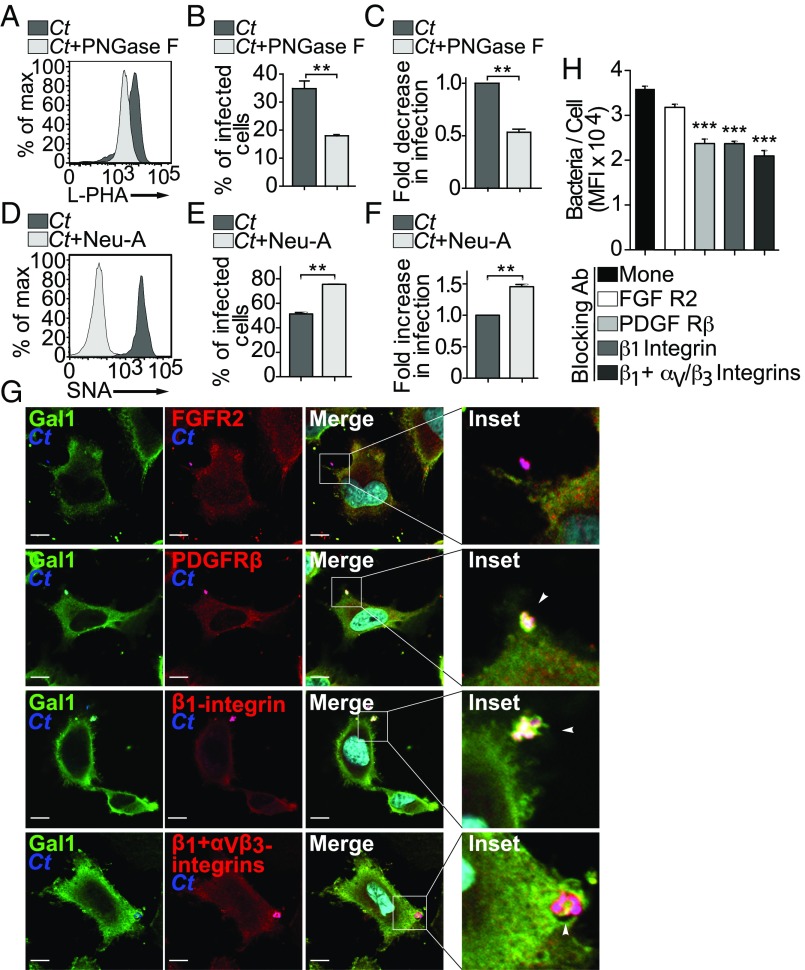
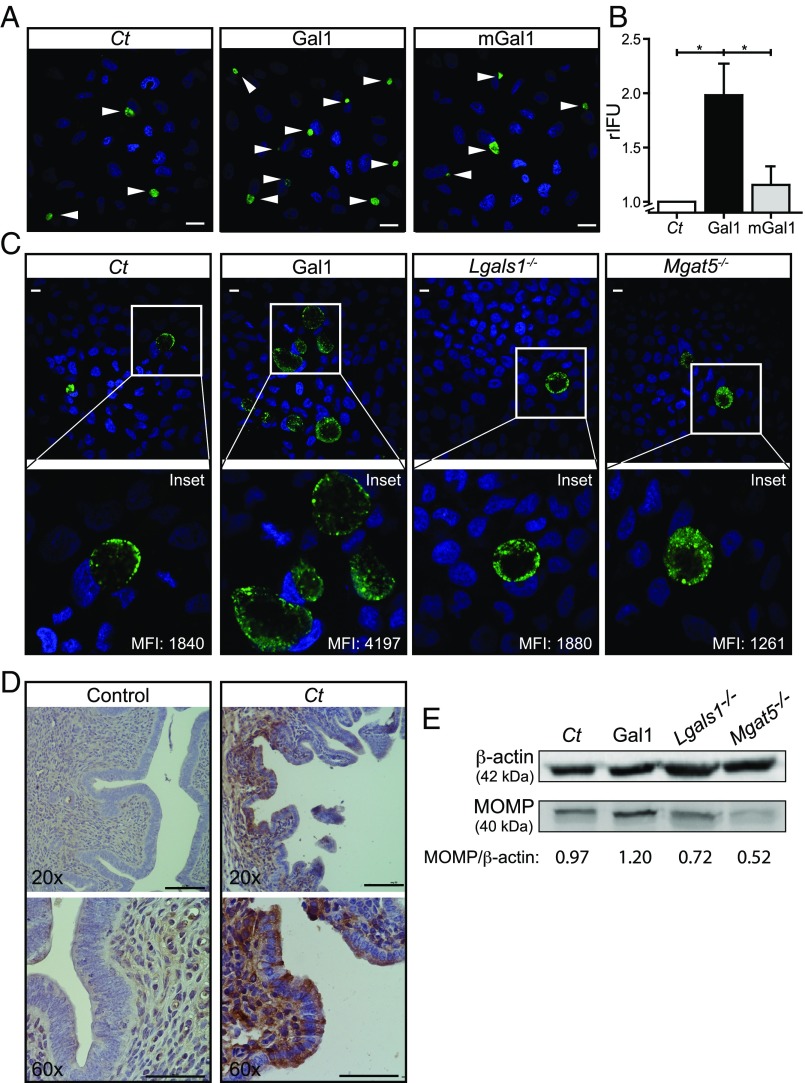
Chlamydia trachomatis (Ct) constitutes the most prevalent sexually transmitted bacterium worldwide. Chlamydial infections can lead to severe clinical sequelae including pelvic inflammatory disease, ectopic pregnancy, and tubal infertility. As an obligate intracellular pathogen, Ct has evolved multiple strategies to promote adhesion and invasion of host cells, including those involving both bacterial and host glycans. Here, we show that galectin-1 (Gal1), an endogenous lectin widely expressed in female and male genital tracts, promotes Ct infection. Through glycosylation-dependent mechanisms involving recognition of bacterial glycoproteins and N-glycosylated host cell receptors, Gal1 enhanced Ct attachment to cervical epithelial cells. Exposure to Gal1, mainly in its dimeric form, facilitated bacterial entry and increased the number of infected cells by favoring Ct-Ct and Ct-host cell interactions. These effects were substantiated in vivo in mice lacking Gal1 or complex β1-6-branched N-glycans. Thus, disrupting Gal1-N-glycan interactions may limit the severity of chlamydial infection by inhibiting bacterial invasion of host cells.

Keywords: Chlamydia trachomatis; galectin-1; glycosylation; host–pathogen interactions; sexually transmitted diseases.


Conflict of interest statement

The authors declare no conflict of interest.

Figures

Fig. 1.
Fig. 1.
Cell surface glycan profiles of Ct and HeLa cells. (A) Lectin blot analysis of whole-cell lysates of Ct infectious forms (EBs) detected with biotinylated lectins followed by streptavidin-HRP. (B) Western blot analysis of MOMP and OmcB expression in whole bacterial cell lysates. (C) Glycophenotype of HeLa cells detected with biotinylated lectins and PE-conjugated streptavidin (filled curve) or incubated with PE-conjugated streptavidin alone (control; empty curve) analyzed by flow cytometry. In A and B blots are representative of three independent experiments. In C histograms are representative of three independent experiments.
Fig. 2.
Fig. 2.
Regulated expression, subcellular distribution, and binding of Gal1 to bacterial and host cell glycoproteins. (A) Binding of biotinylated Gal1 to Ct glycoproteins detected by lectin blotting. (B) Binding of biotinylated Gal1 to HeLa cells detected with PE-conjugated streptavidin (filled curve) and control cells incubated with PE-conjugated streptavidin alone (empty curve), assessed by flow cytometry. (C) Analysis of carbohydrate-dependent binding of Gal1 to EBs. Bacteria were incubated with 0.3 µM recombinant Gal1 (EB+Gal1) and washed twice with 100 mM lactose as indicated in Materials and Methods. Bacterial pellets (EB+Gal1, EB1, and EB2) and eluate (E1) were resolved by SDS/PAGE. MOMP and Gal1 were detected using specific polyclonal antibodies. (D) Immunoblot analysis of endogenous Gal1 in uninfected control (C) or infected (Ct) HeLa cells. β-actin was used as loading control (Left). Ratio of Gal1/β-actin expression in uninfected vs. infected cells (Right). (E) Confocal microscopy of subcellular Gal1 distribution upon infection. Uninfected HeLa cells (Left) and cells infected with Ct (MOI 1) for 18 h (Middle) are shown. (Right) The intensity profile scanned along a line crossing the inclusion area. (Scale bars, 10 µm.) (F) A single xy section from the stack of images of a HeLa cell infected for 18 h. xz and yz projections are shown aside the image. I, chlamydial inclusion; N, nucleus. Data are representative of three independent experiments. In A, C, and D blots are representative of at least three independent experiments. In D bars represent the mean ± SEM of three independent experiments (**P < 0.01).
Fig. 3.
Fig. 3.
Promotion of Ct adhesion and infection by Gal1. (A) Immunoblot analysis of endogenous Gal1 in HeLa cells incubated with different Ct numbers (MOI 1 and 3) during the binding step at 4 °C. Clathrin was used as loading control. (BD) HeLa cells were infected with Ct (green) (MOI 0.5) in the presence of increasing concentrations of recombinant Gal1 (0.1–5 µM) during the binding step at 4 °C and analyzed by flow cytometry. (B) Percentage of infected HeLa cells at 24 h pi. (C) Fold increase in infection at 24 h pi. (D) Quantification of bacteria per cell measured by MFI at 24 h pi. (EG) HeLa cells were infected with Ct (green) in the absence or presence of 1 μM WT Gal1 or mGal1 during the binding step at 4 °C. (E) Fold increase in infection at 24 h pi analyzed by flow cytometry. (F) Fold increase in the number of bacteria per cell determined by relative MFI at 24 h pi. In C, E, and F bars are the mean ± SEM (*P < 0.05, **P < 0.01, ***P < 0.001). (G) Representative micrographs of Ct-infected HeLa cells (green) by confocal microscopy. Arrowheads in insets indicate chlamydial inclusions. DNA was stained with DAPI (blue). (Scale bars, 10 µm.) N, nucleus. Data are representative of five independent experiments performed in triplicates, except in A, where experiments were performed twice.
Fig. 4.
Fig. 4.
Ultrastructural analysis of Ct-infected HeLa cells in the presence or absence of Gal1. (A) HeLa cells were infected with Ct (MOI 1) in the absence or presence of 1 μM Gal1 or mGal1 during the binding step at 4 °C. Cells were fixed at 15 min pi (Right) or 2 h pi (Left and Middle) and processed for transmission electron microscopy. Arrowheads show chlamydial inclusions. (Middle and Right) Magnifications of chlamydial inclusions. (BD) Percentage of HeLa cells containing one or two Ct inclusions when incubated in the absence (B) or in the presence of 1 µM Gal1 (C) or mGal1 (D) during the binding step at 4 °C. (E) Percentage of Ct inclusions containing one or two bacteria in cells infected in the absence or in the presence of 1 µM Gal1 or mGal1 during the binding step at 4 °C. Data are representative of two independent experiments performed in duplicates.
Fig. 5.
Fig. 5.
Glycosylation-dependent Ct binding to host cell receptors promotes infection. (AC) HeLa cells were pretreated with PNGase F to release N-glycans. (A) Analysis of l-PHA binding to untreated or PNGase F-treated cells by flow cytometry. (B) Percentage of infected HeLa cells determined by flow cytometry. (C) Fold decrease of Ct infection in PNGase F-treated cells. (DF) HeLa cells were treated with neuraminidase A (Neu A) to release sialic acid. (D) Analysis of SNA binding to untreated and Neu A-treated cells by flow cytometry. (E) Percentage of infected HeLa cells by flow cytometry. (F) Fold increase of Ct infection in Neu A-treated cells. (G) Immunofluorescence detection of N-glycosylated receptors on HeLa cells incubated with Ct during the binding step at 4 °C (MOI 3). Infection was confirmed using an anti-MOMP antibody (blue). FGFR2, PDGFRβ, β1-integrin, and αVβ3 integrins were detected using specific antibodies (red). Gal1 was detected using a rabbit anti-human Gal1 antibody (green). Arrowheads indicate triple colocalization. (Scale bars, 10 µm.) (H) Contribution of glycosylated receptors to Gal1-induced Ct infection. Quantification of bacteria per cell measured by MFI at 24 h pi in HeLa cells incubated with 1 µM recombinant Gal1 in the absence or presence of different neutralizing monoclonal antibodies. In B, C, E, F, and H data are the mean ± SEM of three experiments (**P < 0.01, ***P < 0.001). In A, D, and G data are representative of three independent experiments performed in triplicates.
Fig. 6.
Fig. 6.
Gal1 promotes chlamydial infection in vitro and in vivo. (A and B) HeLa cells were infected with Ct (green) (MOI 0.5) in the absence or presence of 1 µM recombinant Gal1 or mGal1. At the end of chlamydial developmental cycle (48 h pi), infected cells were lysed and the infectious particles were titrated in serial dilutions on HeLa cell monolayers. (A) Confocal microscopy of inclusions generated by progenies collected from chlamydial control (Ct), Gal1-treated, and mGal1-treated HeLa cells. Representative images show the inclusions (green) developed at 24 h pi. DNA was stained with DAPI (blue). Arrowheads indicate chlamydial inclusions. (Scale bars, 10 µm.) (B) Number of relative IFU (rIFU) generated by chlamydial progenies determined by flow cytometry (*P < 0.05). (C and D) Development of Ct infection in vivo. Female C57BL/6 mice were intravaginally infected with fluorescent Ct in the absence (Ct; n = 10) or presence of 1 µM recombinant Gal1 (Gal1; n = 10). Mice lacking Gal1 (Lgals1−/−; n = 10) or MGAT5 (Mgat5−/−; n = 5) were infected with Ct. At 14 dpi vaginal discharges were collected. (C) Confocal microscopy of inclusions (green) generated in HeLa cell monolayers exposed for 24 h pi to mice vaginal discharges. (Insets) Magnifications of the selected areas. MFI represents fluorescent intensity of bacterial inclusion determined by flow cytometry. (Scale bars, 10 μm.) (D) Immunohistochemical analysis of Gal1 expression in uteri sections from uninfected and Ct-infected mice. (Scale bars, 50 μm.) (E) Immunoblot analysis of bacterial MOMP in uterine tissue from chlamydial control (Ct), Gal1-treated, Lgals1−/−, or Mgat5−/− mice. β-actin was used as loading control. Data are the mean ± SEM (B) or are representative (A and CE) of three independent experiments.

References

    1. World Health Organization 2011. Prevalence and incidence of selected sexually transmitted infections, Chlamydia trachomatis, Neisseria gonorrhoeae, syphilis and Trichomonas vaginalis: Methods and results used by WHO to generate 2005 estimate (WHO, Geneva), pp 1–38.
    1. Elwell C, Mirrashidi K, Engel J. Chlamydia cell biology and pathogenesis. Nat Rev Microbiol. 2016;14:385–400. - PMC - PubMed
    1. Menon S, et al. Human and pathogen factors associated with Chlamydia trachomatis-related infertility in women. Clin Microbiol Rev. 2015;28:969–985. - PMC - PubMed
    1. Zhu H, Shen Z, Luo H, Zhang W, Zhu X. Chlamydia trachomatis infection-associated risk of cervical cancer: A meta-analysis. Medicine (Baltimore) 2016;95:e3077. - PMC - PubMed
    1. Bastidas RJ, Elwell CA, Engel JN, Valdivia RH. Chlamydial intracellular survival strategies. Cold Spring Harb Perspect Med. 2013;3:a010256. - PMC - PubMed

Publication types