

Metabolomic and microarray analyses of adipose tissue of dapagliflozin-treated mice, and effects of 3-hydroxybutyrate on induction of adiponectin in adipocytes
- PMID: 29891844
- PMCID: PMC5995811
- DOI: 10.1038/s41598-018-27181-y
Metabolomic and microarray analyses of adipose tissue of dapagliflozin-treated mice, and effects of 3-hydroxybutyrate on induction of adiponectin in adipocytes
Abstract
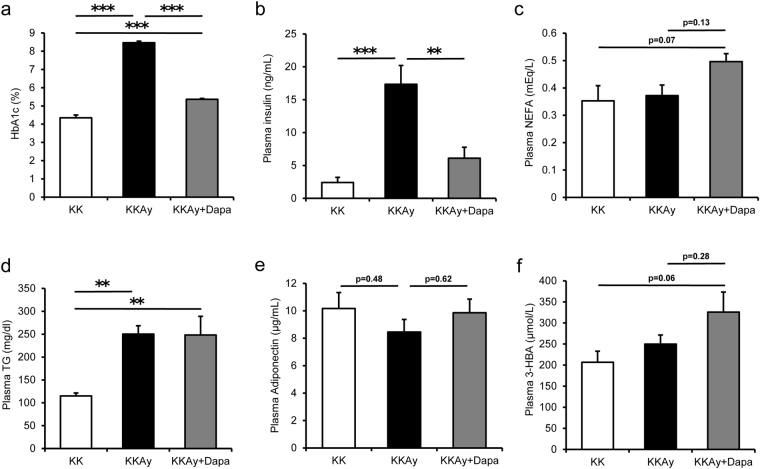
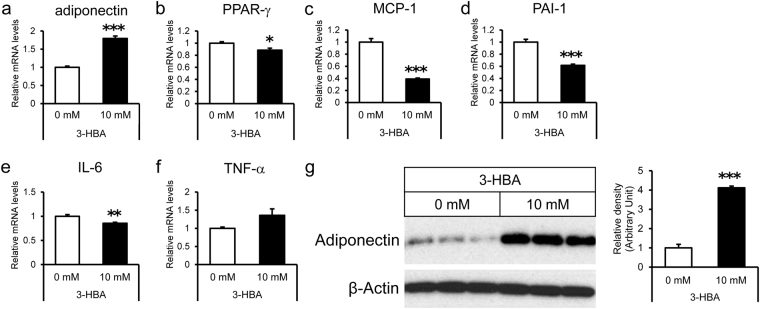
Sodium/glucose cotransporter 2 (SGLT2) inhibitor improves systemic glucose metabolism. To clarify the effect of dapagliflozin, we performed gene expression microarray and metabolomic analyses of murine adipose tissue. Three groups of mice were used; non-diabetic control KK mice (KK), diabetic KKAy mice (KKAy), and KKAy mice treated with dapagliflozin (KKAy + Dapa). Plasma glucose levels were significantly reduced in KKAy + Dapa compared with KKAy. Food consumption was larger in KKAy + Dapa than KKAy, and there were no significant differences in body and adipose tissue weight among the groups. Metabolomic analysis showed higher levels of many intermediate metabolites of the glycolytic pathway and TCA cycle in KKAy than KK, albeit insignificantly. Dapagliflozin partially improved accumulation of glycolytic intermediate metabolites, but not intermediate metabolites of the TCA cycle, compared with KKAy. Interestingly, dapagliflozin increased plasma and adipose 3-hydroxybutyric acid (3-HBA) levels. Microarray analysis showed that adipocytokines were downregulated in KKAy compared with KK mice, and upregulated by dapagliflozin. In vitro, 3-HBA induced β-hydroxybutyrylation of histone H3 at lysine 9 and upregulation of adiponectin in 3T3-L1 adipocytes independent of their acetylation or methylation. Our results suggest that 3-HBA seems to provide protection through epigenetic modifications of adiponectin gene in adipocytes.
Conflict of interest statement
This work was supported by grants from AstraZeneca K.K. and Ono Pharmaceutical Co., Ltd., Osaka Japan. Dr. Atsunori Fukuhara belongs to endowed department by Takeda Pharmaceutical Company, Sanwa Kagaku Kenkyusho Co., Ltd., Rohto Pharmaceutical Co., Ltd, FUJI OIL HOLDINGS INC., and Roche DC Japan. The funders had no role in study design, data collection and analysis, decision to publish, or preparation of the manuscript.
Figures


Similar articles
-
Dapagliflozin in patients with type 1 diabetes: A post hoc analysis of the effect of insulin dose adjustments on 24-hour continuously monitored mean glucose and fasting β-hydroxybutyrate levels in a phase IIa pilot study.Diabetes Obes Metab. 2017 Jun;19(6):814-821. doi: 10.1111/dom.12882. Epub 2017 Mar 27. Diabetes Obes Metab. 2017. PMID: 28098426 Clinical Trial.
-
Beneficial metabolic actions of a stable GIP agonist following pre-treatment with a SGLT2 inhibitor in high fat fed diabetic mice.Mol Cell Endocrinol. 2016 Jan 15;420:37-45. doi: 10.1016/j.mce.2015.11.019. Epub 2015 Nov 30. Mol Cell Endocrinol. 2016. PMID: 26607806
-
The Effects of Dapagliflozin on Systemic and Renal Vascular Function Display an Epigenetic Signature.J Clin Endocrinol Metab. 2019 Oct 1;104(10):4253-4263. doi: 10.1210/jc.2019-00706. J Clin Endocrinol Metab. 2019. PMID: 31162549 Clinical Trial.
-
[Dapagliflozin, a Sodium-Glucose Co-transporter-2 Inhibitor, Acutely Reduces Energy Expenditure in Brown Adipose Tissue via Neural Signals in Mice].Yakugaku Zasshi. 2018;138(7):945-954. doi: 10.1248/yakushi.17-00223-3. Yakugaku Zasshi. 2018. PMID: 29962474 Review. Japanese.
-
Dapagliflozin: a new sodium-glucose cotransporter 2 inhibitor for treatment of type 2 diabetes.Am J Health Syst Pharm. 2015 Mar 1;72(5):361-72. doi: 10.2146/ajhp140168. Am J Health Syst Pharm. 2015. PMID: 25694411 Review.
Cited by
-
Ketone body 3-hydroxybutyrate enhances adipocyte function.Sci Rep. 2022 Jun 16;12(1):10080. doi: 10.1038/s41598-022-14268-w. Sci Rep. 2022. PMID: 35710581 Free PMC article.
-
Possible Involvement of Adipose Tissue in Patients With Older Age, Obesity, and Diabetes With SARS-CoV-2 Infection (COVID-19) via GRP78 (BIP/HSPA5): Significance of Hyperinsulinemia Management in COVID-19.Diabetes. 2021 Dec;70(12):2745-2755. doi: 10.2337/db20-1094. Epub 2021 Oct 6. Diabetes. 2021. PMID: 34615619 Free PMC article. Review.
-
Effects of ketogenic diet and ketone bodies on the cardiovascular system: Concentration matters.World J Diabetes. 2020 Dec 15;11(12):584-595. doi: 10.4239/wjd.v11.i12.584. World J Diabetes. 2020. PMID: 33384766 Free PMC article. Review.
-
Exenatide and Dapagliflozin Combination Enhances Sertoli Cell Secretion of Key Metabolites for Spermatogenesis.Biomedicines. 2022 May 11;10(5):1115. doi: 10.3390/biomedicines10051115. Biomedicines. 2022. PMID: 35625851 Free PMC article.
-
Function and mechanism of histone β-hydroxybutyrylation in health and disease.Front Immunol. 2022 Sep 12;13:981285. doi: 10.3389/fimmu.2022.981285. eCollection 2022. Front Immunol. 2022. PMID: 36172354 Free PMC article. Review.
References
MeSH terms
Substances
LinkOut - more resources
Full Text Sources
Other Literature Sources
Molecular Biology Databases
Miscellaneous
