. 2018 Jun 11;8(1):8874.
doi: 10.1038/s41598-018-27163-0.

Model of the adaptive immune response system against HCV infection reveals potential immunomodulatory agents for combination therapy

Affiliations

Model of the adaptive immune response system against HCV infection reveals potential immunomodulatory agents for combination therapy

Ayesha Obaid et al. Sci Rep. .

Abstract

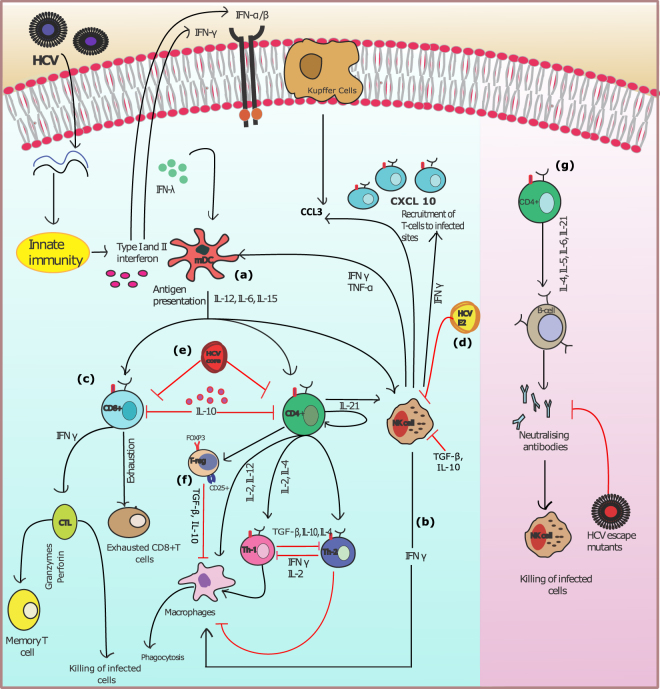
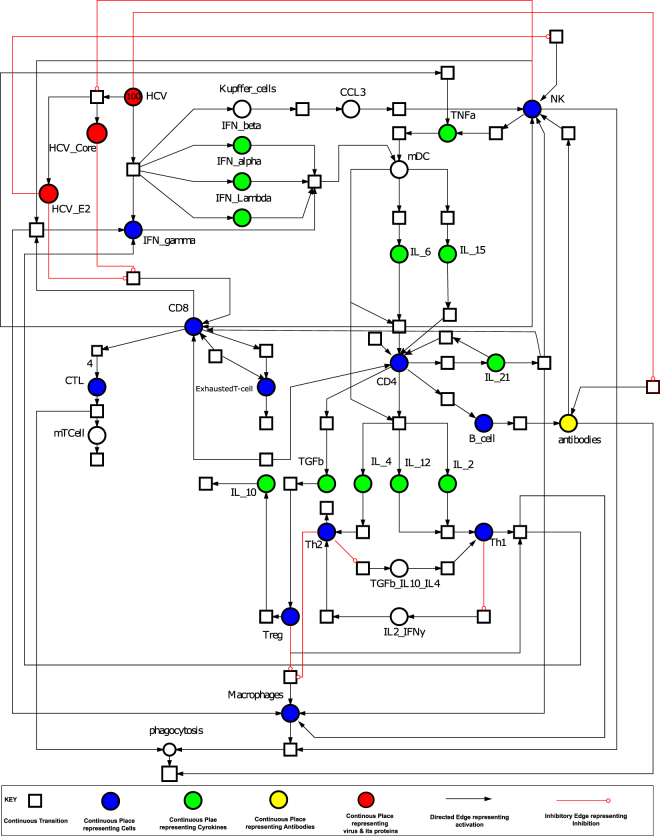
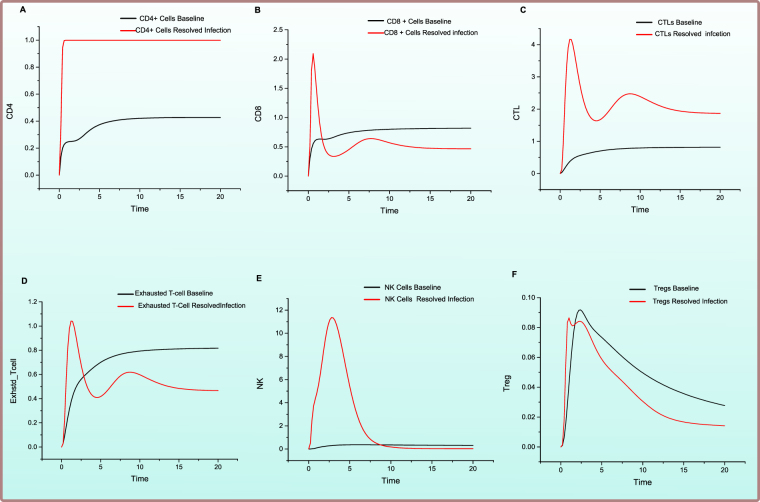
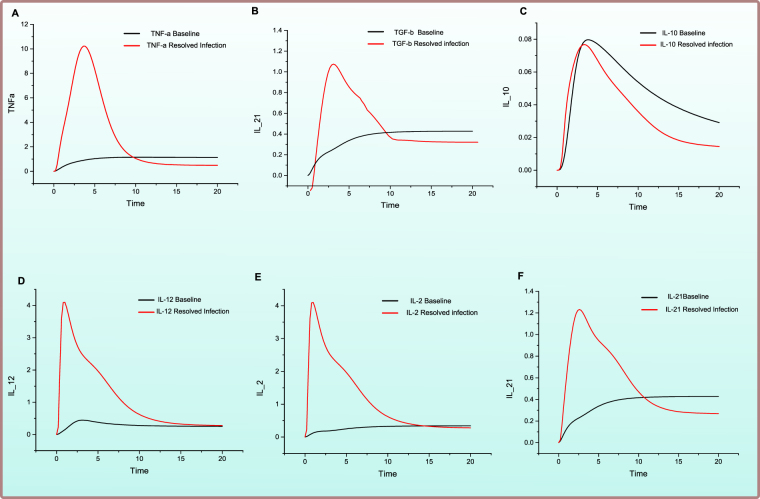
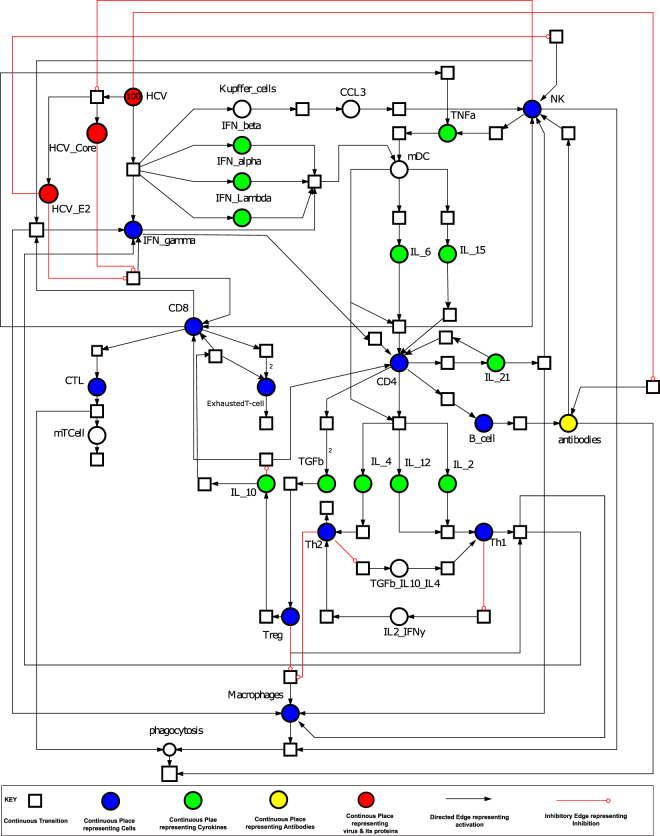
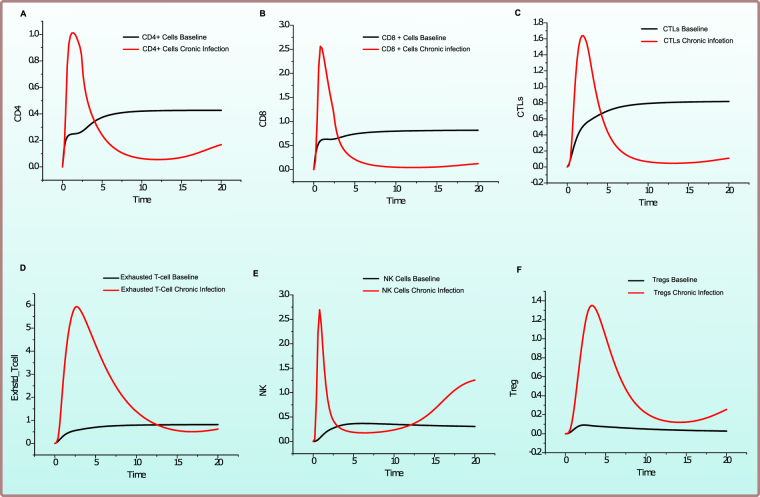
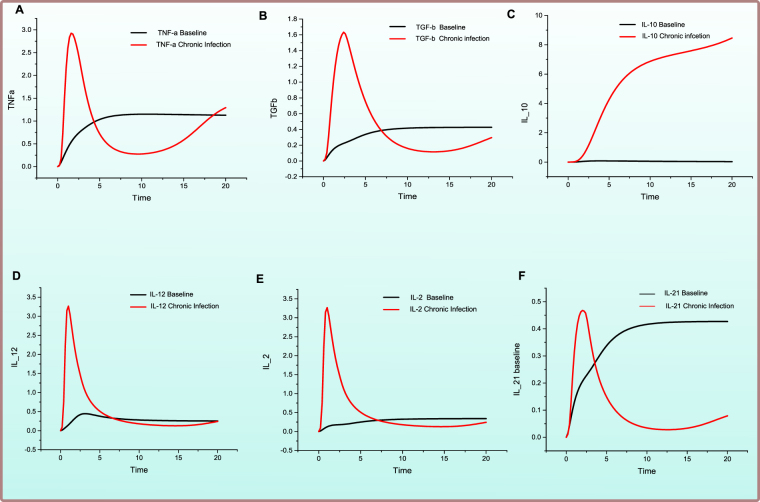
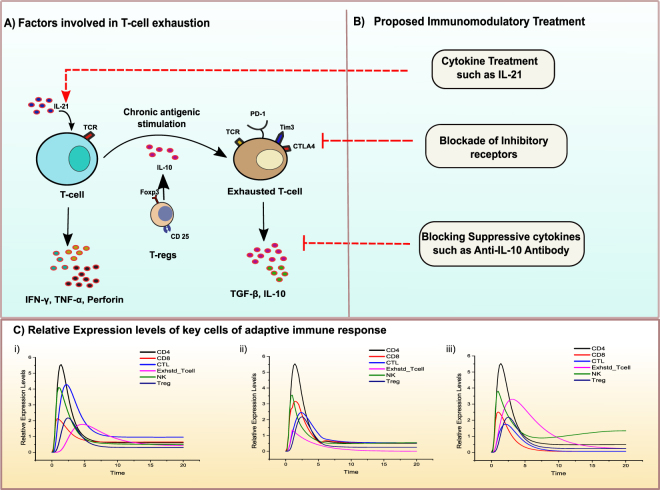
A regulated immune system employs multiple cell types, diverse variety of cytokines and interacting signalling networks against infections. Systems biology offers a promising solution to model and simulate such large populations of interacting components of immune systems holistically. This study focuses on the distinct components of the adaptive immune system and analysis, both individually and in association with HCV infection. The effective and failed adaptive immune response models have been developed followed by interventions/perturbations of various treatment strategies to get better assessment of the treatment responses under varying stimuli. Based on the model predictions, the NK cells, T regulatory cells, IL-10, IL-21, IL-12, IL-2 entities are found to be the most critical determinants of treatment response. The proposed potential immunomodulatory therapeutic interventions include IL-21 treatment, blocking of inhibitory receptors on T-cells and exogenous anti-IL-10 antibody treatment. The relative results showed that these interventions have differential effect on the expression levels of cellular and cytokines entities of the immune response. Notably, IL-21 enhances the expression of NK cells, Cytotoxic T lymphocytes and CD4+ T cells and hence restore the host immune potential. The models presented here provide a starting point for cost-effective analysis and more comprehensive modeling of biological phenomenon.


Conflict of interest statement

The authors declare no competing interests.

Figures

Figure 1
Figure 1
HCV infection and key adaptive immune responses: As soon as HCV RNA is recognized by host cells in the liver (Hepatocytes). In response, innate immune system produces Type I and II interferons to trigger an antiviral state,. While adaptive immune response is initiated by several main entities in the immune system. They include, (a) memory Dendritic cells (mDC) that activate CD8+ cells, CD4+ cells and natural killer (NK) cells by releasing cytokines IL-15, IL-4, IL-12 (b) NK cells produce interferon-γ to mediate antiviral effects. (c) CD8+ cells and CD4+ cells control the T- helper cells (Th1 & Th 2) which as a result regulate the macrophages functionality, induce Cytotoxic T cells (CTLs) and T-regulatory cells (Tregs) (d) CD81 NK receptor is blocked by HCV E2 protein, reducing release of interferon-γ and cytotoxic particles by NK cells (e) MHC class I expression is increased on affected hepatocytes by HCV core protein, hence reducing activity of NK cell against affected cells. HCV also rises the regulatory T cells in liver. (f) NK cells activity is reduced by regulatory T cell secreting IL-10 and transforming growth factor–β (TGF -β). (g) Humoral responses are activated via CD4+ cells by the release of IL-21, IL-4, IL-6 and IL-5.
Figure 2
Figure 2
Illustration of the PN model representing Effective Adaptive Immune Response against HCV. A circle represents a continuous place, signifying HCV proteins, host signalling proteins, receptor complexes and cellular enzymes. A square box represents continuous transition, demonstrating all cellular mechanisms comprising of replication, transcription, translation, activation, deactivation, endocytosis and exocytosis. A directed arc links a standard transition to a standard place and vice versa. An inhibitory edge denotes the inhibitory outcome on a biological process by an entity (Enzymes, host and viral proteins). Arcs weights are equal to 1 except stated otherwise. Green coloured circles represent important cytokines, blue coloured circles represent cells involved in immune response, while red coloured circles represent HCV and its proteins.
Figure 3
Figure 3
Comparison of relative change in expression levels of cellular entities during HCV infection and Effective Adaptive Immune Response. Y-axis represents the relative expression level of cellular entities during in Effective Adaptive Response Model as compared with baseline model, while X-axis shows time units. Black line signifies the relative activity level prior to HCV infection while red line represents the relative activity level afterward successful response to HCV.
Figure 4
Figure 4
Comparison of relative change in expression levels of cytokines response during HCV infection and Effective Adaptive Immune Response. Y-axis represents the relative expression level of cytokines during in Effective Adaptive Response Model as compared with baseline model, while X-axis shows time units. Black line signifies the relative activity level prior to HCV infection while red line represents the relative activity level afterward successful response to HCV.
Figure 5
Figure 5
Illustration of the PN model representing Failed Adaptive Immune Response against HCV infection. A circle represents a continuous place, signifying HCV proteins, host signalling proteins, receptor complexes and cellular enzymes. A square box represents continuous transition, demonstrating all cellular mechanisms comprising of replication, transcription, translation, activation, deactivation, endocytosis and exocytosis. A directed arc links a standard transition to a standard place and vice versa. An inhibitory edge denotes the inhibitory outcome on a biological process by an entity (Enzymes, host and viral proteins). Arcs weights are equal to 1 except stated otherwise. Green coloured circles represent important cytokines, blue coloured circles represent cells involved in immune response, while red coloured circles represent HCV and its proteins.
Figure 6
Figure 6
Comparison of relative change in expression levels of cellular response during HCV infection and Failed Adaptive Immune Response. Y-axis represents the relative expression level of cellular entities during in Failed Adaptive Response Model as compared with baseline model, while X-axis shows time units. Black line signifies the relative levesl prior to HCV infection while red line represents the relative levesl afterward failure of immune response to HCV.
Figure 7
Figure 7
Comparison of relative change in activity levels of cytokine responses to chronic HCV infection and Failed Adaptive Immune Response. X-axis depicts time units while the Y-axis signifies relative activity level variation in the cytokine entities during failed adaptive immune response when compared with baseline model PN (Supplementary File 1). Black line shows the relative activity level before any sort of HCV infection is present while red line shows the relative activity level after establishment of chronic HCV infcetion.
Figure 8
Figure 8
Adaptive immune response during treatment (PEGylated IFN-α/RBV). (A) Represents probable effects of PegIFN-α and RBV on adaptive responses during treatment. The treatment model was simulated and the resulting graphs are presented. x-axis represents time while y-axis depicts relative concentration levels. Black line represents the relative expression levels of the entity during chronic infection, red line represents the activity levels during resolved infection, while blue line represents the change in activity levels after treatment is introduced in the system.
Figure 9
Figure 9
Proposed immunomodulatory treatments and their effect on key cellular immune responses. (A) Factors involved in T-cell exhaustion. (B) Proposed treatment possibilities and perturbations introduced in the model. (C) Relative expression levels of key cellular responses of adaptive immunity including CD4+, CD8+, CTLs, Exhausted T cells, NK, and Tregs. Time units are presented on X-axis while relative expression levels are presented on y-axis represents. (i) The relative expression levels of key cells after IL-21 cytokine treatment. (ii) Relative expression levels of key cells after blocking of exhausted T cells inhibitory receptors. (iii) Relative expression levels of key cells after anti-IL-10 antibody treatment.
Figure 10
Figure 10
The flowchart represents basic framework of methodology followed to model HCV-induced immune responses using Petri Nets (PN).

Similar articles

Cited by

References

    1. Blach S, et al. Global prevalence and genotype distribution of hepatitis C virus infection in 2015: a modelling study. The Lancet Gastroenterology & Hepatology. 2017;2:161–176. doi: 10.1016/S2468-1253(16)30181-9. - DOI - PubMed
    1. Thimme R, Binder M, Bartenschlager R. Failure of innate and adaptive immune responses in controlling hepatitis C virus infection. FEMS microbiology reviews. 2012;36:663–683. doi: 10.1111/j.1574-6976.2011.00319.x. - DOI - PubMed
    1. Heim MH, Thimme R. Innate and adaptive immune responses in HCV infections. Journal of hepatology. 2014;61:S14–S25. doi: 10.1016/j.jhep.2014.06.035. - DOI - PubMed
    1. Horner SM, Gale M., Jr Regulation of hepatic innate immunity by hepatitis C virus. Nature medicine. 2013;19:879–888. doi: 10.1038/nm.3253. - DOI - PMC - PubMed
    1. Bowen DG, Walker CM. Adaptive immune responses in acute and chronic hepatitis C virus infection. Nature. 2005;436:946–952. doi: 10.1038/nature04079. - DOI - PubMed

Publication types

MeSH terms