. 2018 Jun 11;8(1):8898.
doi: 10.1038/s41598-018-26801-x.

Real-life speech production and perception have a shared premotor-cortical substrate

Affiliations

Real-life speech production and perception have a shared premotor-cortical substrate

Olga Glanz Iljina et al. Sci Rep. .

Abstract

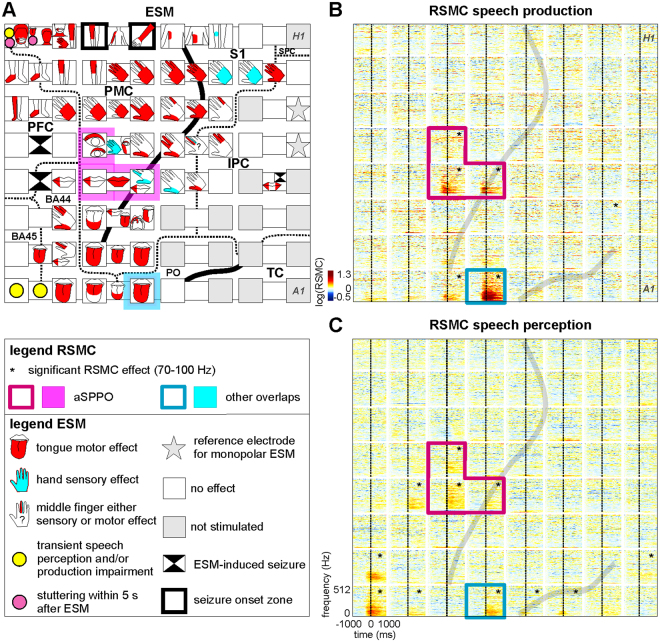
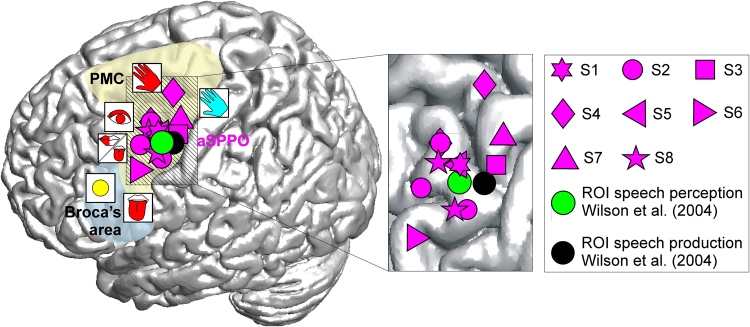
Motor-cognitive accounts assume that the articulatory cortex is involved in language comprehension, but previous studies may have observed such an involvement as an artefact of experimental procedures. Here, we employed electrocorticography (ECoG) during natural, non-experimental behavior combined with electrocortical stimulation mapping to study the neural basis of real-life human verbal communication. We took advantage of ECoG's ability to capture high-gamma activity (70-350 Hz) as a spatially and temporally precise index of cortical activation during unconstrained, naturalistic speech production and perception conditions. Our findings show that an electrostimulation-defined mouth motor region located in the superior ventral premotor cortex is consistently activated during both conditions. This region became active early relative to the onset of speech production and was recruited during speech perception regardless of acoustic background noise. Our study thus pinpoints a shared ventral premotor substrate for real-life speech production and perception with its basic properties.


Conflict of interest statement

The authors declare no competing interests.

Figures

Figure 1
Figure 1
Typical electrocortical stimulation mapping (ESM) results and relative spectral magnitude changes (RSMC) during non-experimental, real-life speech (S2). (A) ESM results are visualized with reference to the individual anatomical areas of this subject. The borders of anatomical areas are marked by dotted lines. Black solid lines indicate positions of the central and lateral sulci. BA: Brodmann area, IPC: inferior parietal cortex, PFC: prefrontal cortex, PMC: premotor cortex, PO: parietal operculum, SPC: superior parietal cortex, S1: primary somatosensory cortex, TC: temporal cortex. The magenta overlay in A and the magenta boxes in B and C highlight the electrodes lying in both anatomically and functionally defined articulatory motor cortex (see Methods). This region, located in the anatomical motor cortex and showing mouth motor effects upon ESM, will be referred to as an articulatory speech-production-perception-overlap, ‘aSPPO’. The blue overlay in A and the blue boxes in B and C highlight the electrode with significant RSMC during both speech production and perception that lay outside the aSPPO region (‘other overlaps’ in the legend). H1 to A1: electrode labels included for ease of spatial reference. (B) Time-frequency-resolved RSMC at the 8 × 8 electrode grid during speech production. Grey lines indicate the individual locations of the central (nearly vertical line in the middle part of the panel) and lateral (diagonal line in the lower right) sulci, log: natural logarithm. The black stars in the upper right corners of the individual electrodes indicate that the RSMC in the frequency range of 70–100 Hz were significant (two-tailed Wilcoxon sign test, false discovery rate (FDR)-corrected at q = 0.005) relative to a baseline period (see Methods). Other conventions as in A. (C) RSMC observed at the 8 × 8 electrode grid during real-life speech perception, all conventions as in B.
Figure 2
Figure 2
An example of typical frequency band-averaged RSMC during speech production and perception (S2, 70–100 Hz). Results of significant high-gamma RSMC (two-tailed Wilcoxon sign test, FDR-corrected at q = 0.005) for speech production (black solid curves) and perception (green solid curves) conditions are shown. Black and green dots on the curves indicate the earliest onsets of significant activation for the respective condition. Anatomical areas are color-coded, other conventions as in Fig. 1. Electrode labels (e.g., H1, A1) are included for all electrodes showing significant effects to facilitate spatial reference.
Figure 3
Figure 3
Spatial properties of neuronal activity in the aSPPO region. All electrodes overlying the aSPPO region are visualized on a standard brain based on their MNI coordinates (Suppl. Table 1). Each magenta symbol represents one electrode; different shapes depict different subjects (S1–S8, see legend). The visualized overlap between speech production and perception lies in the superior part of the ventral premotor cortex with mouth motor properties. The yellow and blue overlays schematically indicate the locations of the premotor cortex (PMC) and of Broca’s area, respectively. ESM effects in the neighborhood, visualized using the same conventions as in Fig. 1A, show that the aSPPO region lies juxtaposed between ESM-defined speech-essential, eye motor, hand motor, and hand sensory areas. Speech production and perception areas defined in an fMRI group analysis by Wilson et al. are also shown as black and green circles, respectively. The striped area on the standard brain in which the aSPPO effects took place is magnified on the right. Note that some effects have a strong spatial overlap between subjects due to the similar MNI coordinates in the x and y planes.
Figure 4
Figure 4
A comparison of the earliest time points of significant activation (A,B) of the maximum high-gamma response magnitudes between the different anatomical areas within each condition and within each anatomical area between conditions. The height of the colored vertical bars show the earliest timing (A) and the maximum high-gamma response magnitude values (B) for all frequency bands together, averaged over all electrodes with significant RSMC (Wilcoxon sign test, FDR-corrected at q = 0.005) in each anatomical area of each subject, then averaged in the respective anatomical area (color-coded, abbreviations for the anatomical areas are below the bars) over subjects (see Methods). The left panels of (A,B) show effects observed in speech production, and the right panels show effects related to speech perception. The number of subjects with significant RSMC in the respective area (those with significant effects in the given area/those with electrode coverage of the respective area) is indicated below the vertical colored bars. The whiskers at each colored bar show the standard errors of the median obtained using a bootstrapping procedure (see Methods). Note that the number of values per anatomical area was often small (2–8 subjects with effects in the given area), so one should not overestimate the importance of the bootstrapping-approximated whisker length with regard to the outcome of statistical testing. (i) Significant differences between anatomical areas within the same condition (Wilcoxon rank sum test, uncorrected) are indicated by black brackets, and (ii) significant differences within the same anatomical area between conditions (Wilcoxon rank sum test, uncorrected) are indicated by red brackets. The height of the p-values is coded by the number of (i) black and (ii) red stars, one star: p < 0.05, two stars: p < 0.01, three stars: p < 0.001.
Figure 5
Figure 5
Typical examples of cortical responses in the aSPPO region during clear (top row), noise-embedded (middle row) speech perception, and during perception of loud non-speech acoustic background noises without concurrent speech (bottom row; S1–S7). All conventions as in Fig. 1B,C, electrode names are included in brackets after the subject’s ID (cf. Suppl. Table 1).

Similar articles

Cited by

References

    1. Miller, K. Communication theories. (USA: Macgraw-Hill, 2005).
    1. Liberman AM, Cooper FS, Shankweiler DP, Studdert-Kennedy M. Perception of the speech code. Psychol Rev. 1967;74:431–461. doi: 10.1037/h0020279. - DOI - PubMed
    1. Liberman AM, Mattingly IG. The motor theory of speech perception revised. Cognition. 1985;21:1–36. doi: 10.1016/0010-0277(85)90021-6. - DOI - PubMed
    1. Tremblay P, Small SL. On the context-dependent nature of the contribution of the ventral premotor cortex to speech perception. Neuroimage. 2011;57:1561–1571. doi: 10.1016/j.neuroimage.2011.05.067. - DOI - PMC - PubMed
    1. Pulvermüller F, Fadiga L. Active perception: sensorimotor circuits as a cortical basis for language. Nat Rev Neurosci. 2010;11:351–360. doi: 10.1038/nrn2811. - DOI - PubMed

Publication types