. 2018 Jun 11;9(1):2272.
doi: 10.1038/s41467-018-04616-8.

Drivers of woody plant encroachment over Africa

Affiliations

Drivers of woody plant encroachment over Africa

Z S Venter et al. Nat Commun. .

Abstract

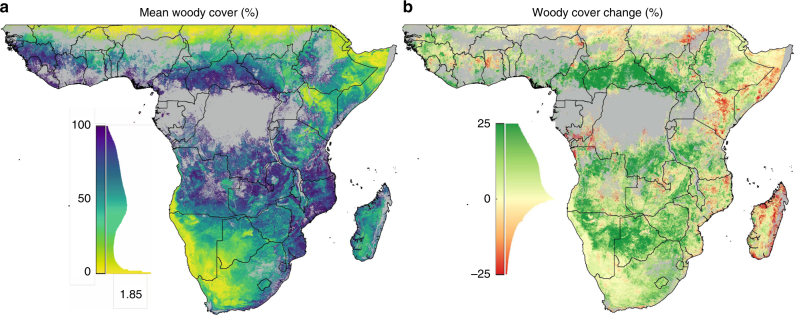
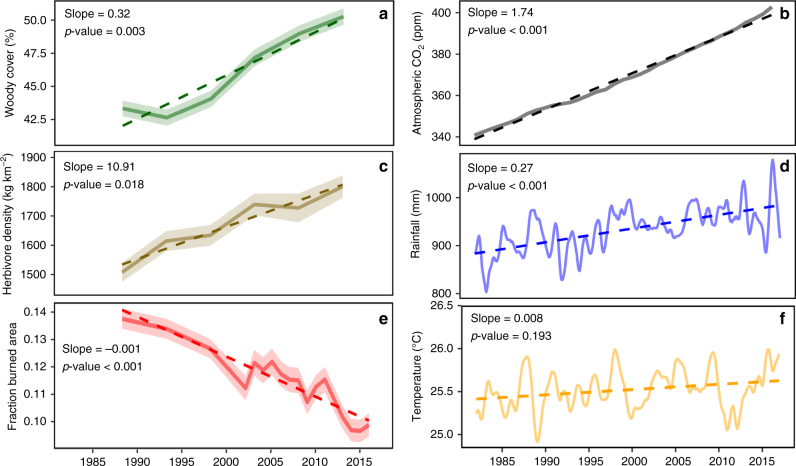
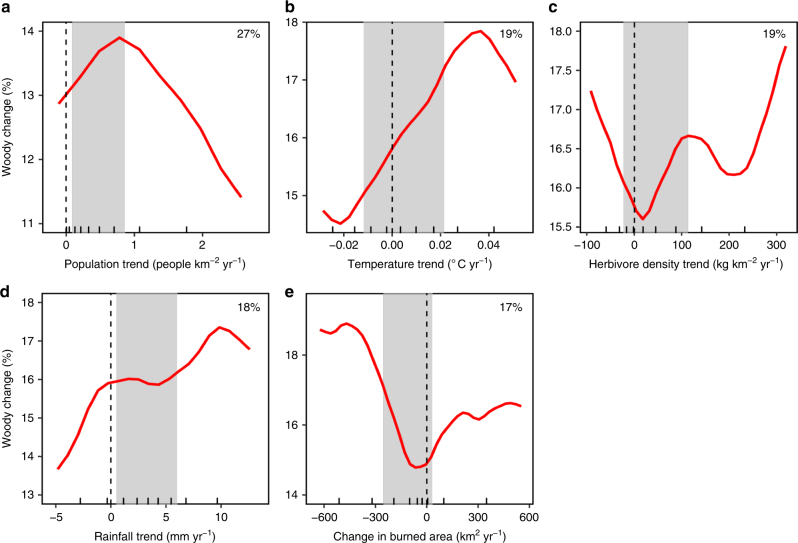
While global deforestation induced by human land use has been quantified, the drivers and extent of simultaneous woody plant encroachment (WPE) into open areas are only regionally known. WPE has important consequences for ecosystem functioning, global carbon balances and human economies. Here we report, using high-resolution satellite imagery, that woody vegetation cover over sub-Saharan Africa increased by 8% over the past three decades and that a diversity of drivers, other than CO2, were able to explain 78% of the spatial variation in this trend. A decline in burned area along with warmer, wetter climates drove WPE, although this has been mitigated in areas with high population growth rates, and high and low extremes of herbivory, specifically browsers. These results confirm global greening trends, thereby bringing into question widely held theories about declining terrestrial carbon balances and desert expansion. Importantly, while global drivers such as climate and CO2 may enhance the risk of WPE, managing fire and herbivory at the local scale provides tools to mitigate continental WPE.


Conflict of interest statement

The authors declare no competing interests.

Figures

Fig. 1
Fig. 1
Woody plant cover dynamics over sub-Saharan Africa. Satellite observations of 30 years of fractional woody plant cover (a) reveal a dominant increasing trend (derived from the slope of the linear trend line between 1986 and 2016) (b). Histograms alongside colour scales indicate data distributions. Grey areas were masked from the analysis and represent urban surfaces, wetland, cropland, and forest (areas >40% cover by trees >5 m). Maps were constructed in Google Earth Engine
Fig. 2
Fig. 2
Time-series data for woody cover and select environmental covariates averaged over Africa. Solid lines represent the mean values and linear trend lines are indicated with dashes. Using 0.5° grid cells as replicates (n = 6255), 95% confidence interval ribbons have been included in a, c and e. The slope of the trend line and p-value of the linear regression are displayed for each plot. Herbivore density and burned area have been hind- and forecast using methods outlined in the supplement. Solid lines for rainfall (d) and temperature (f) indicate inter-annual trends once seasonality has been removed, whereas this is not the case for CO2 (b). Inflection points for lines in a and c are plotted at the median timepoint for each epoch
Fig. 3
Fig. 3
Most important drivers of woody plant cover change. a-e Boosted regression tree partial dependence of fractional woody cover change on selected explanatory variables, when accounting for the average effect of all other driver variables (see Supplementary Fig. 7). The red lines are smoothed representations of the responses, with fitted values (model predictions based on the original data) for each 0.5° grid cell over sub-Saharan Africa. The trend of the line, rather than the actual values, describes the nature of the dependence between response and explanatory variables. Small bats on the x-axis represent data deciles, and grey bands indicate data between the 25th and 75th percentile. The x-axis was clipped to the 5th and 95th percentile to highlight trends in the bulk of the data. The full model explained 51% of the total deviance in woody cover change, and the relative contribution (%) of each explanatory variable is indicated

References

    1. Hansen MC, et al. High-resolution global maps of 21st-century forest cover change. Science. 2013;342:850–853. doi: 10.1126/science.1244693. - DOI - PubMed
    1. Foley JA, et al. Global consequences of land use. Science. 2005;309:570–574. doi: 10.1126/science.1111772. - DOI - PubMed
    1. Stevens N, Lehmann CE, Murphy BP, Durigan G. Savanna woody encroachment is widespread across three continents. Glob. Change Biol. 2017;23:235–244. doi: 10.1111/gcb.13409. - DOI - PubMed
    1. Archer, S. R. et al. in Rangeland Systems: Processes, Management and Challenges (ed David D. B.) 25–84 (Springer International Publishing, Switzerland, 2017).
    1. Bond WJ, Midgley GF. A proposed CO2‐controlled mechanism of woody plant invasion in grasslands and savannas. Glob. Change Biol. 2000;6:865–869. doi: 10.1046/j.1365-2486.2000.00365.x. - DOI

Publication types

LinkOut - more resources