. 2018 Jun 11;8(1):8827.
doi: 10.1038/s41598-018-27141-6.

Clinical significance of CCR7+CD8+ T cells in kidney transplant recipients with allograft rejection

Affiliations

Clinical significance of CCR7+CD8+ T cells in kidney transplant recipients with allograft rejection

Kyoung Woon Kim et al. Sci Rep. .

Abstract

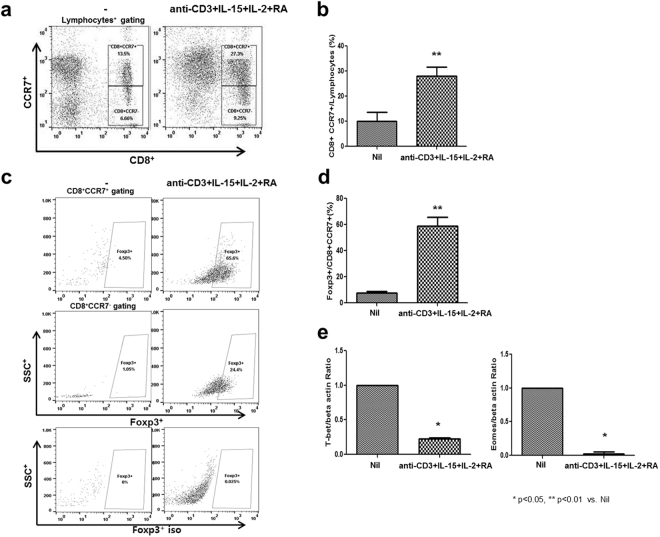
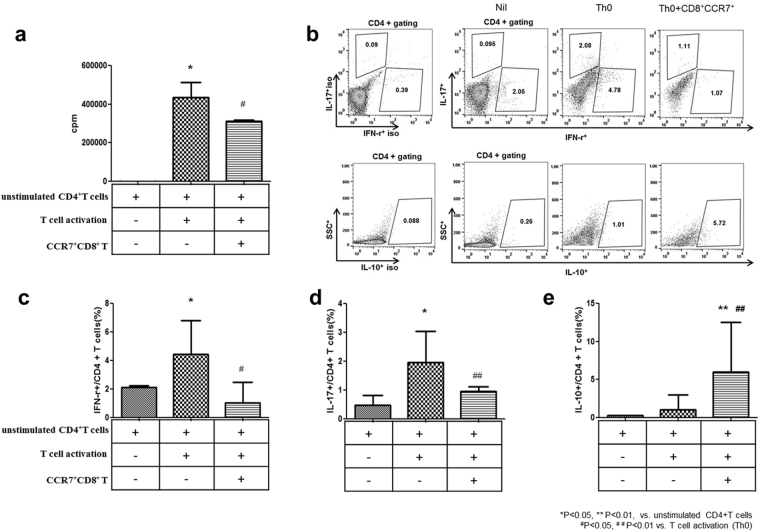
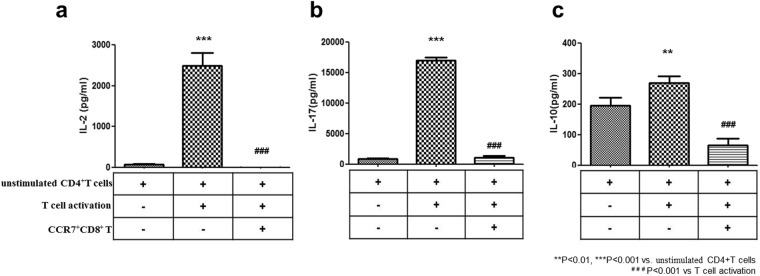
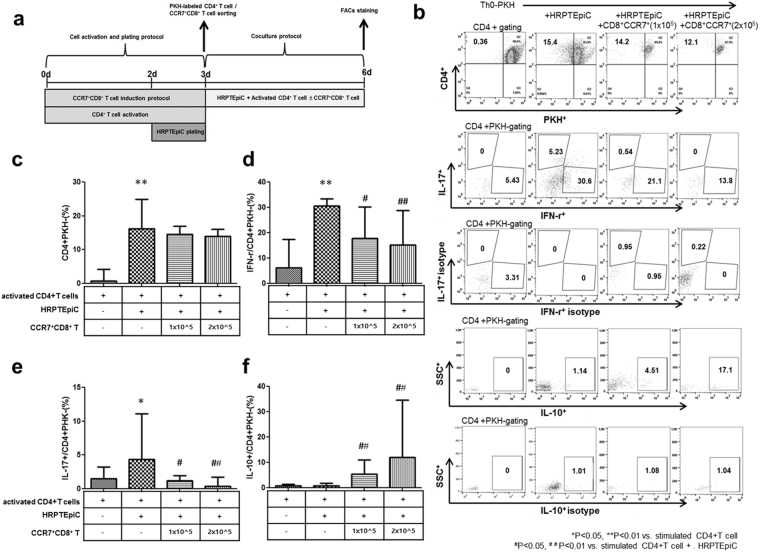
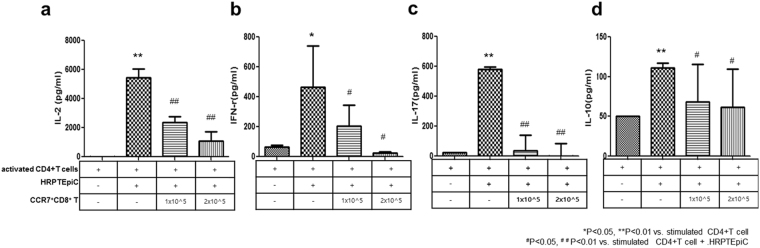
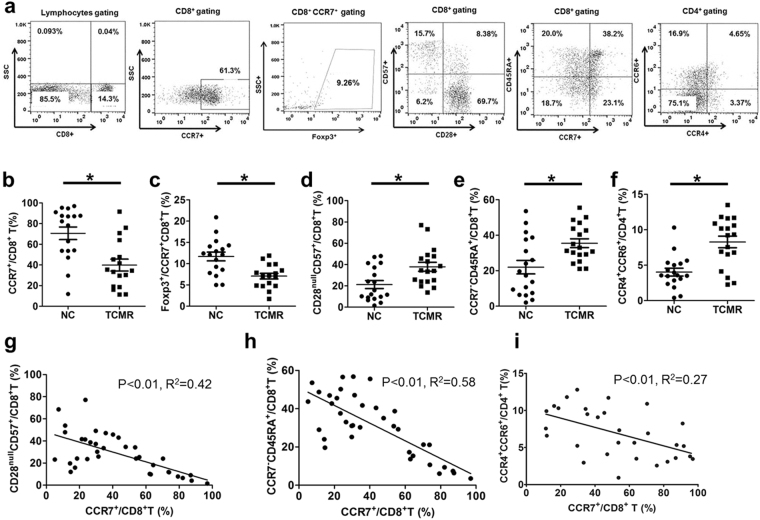
The regulatory function of CCR7+CD8+ T cells against effector T-cells involved in T-cell mediated rejection (TCMR) in kidney transplant recipients was investigated. In vitro experiments explored the ability of CCR7+CD8+ T cells to suppress T-cell proliferation under T-cell activation conditions or during coculture with human renal proximal tubular epithelial cells (HRPTEpiC). In an ex vivo experiment, the proportion of CCR7+/CD8+, FOXP3+/CCR7+CD8+ T and effector T-cell subsets were compared between the normal biopsy control (NC, n = 17) and TCMR group (n = 17). The CCR7+CD8+ T cells significantly suppressed the proliferation of CD4+ T cells and significantly decreased the proportion of IFN-γ+ and IL-17+/CD4+ T cells and inflammatory cytokine levels (all p < 0.05). After coculturing with HRPTEpiC, CCR7+CD8+ T cells also suppressed T-cell differentiation into IL-2+, IFN-γ+, and IL-17+/CD4+ T cells (all p < 0.05). The TCMR group had significantly fewer CCR7+/CD8+ and FOXP3+/CCR7+CD8+ T in comparison with the NC group, but the proportions of all three effector T-cell subsets were increased in the TCMR group (all p < 0.05). The proportion of CCR7+/CD8+ T was inversely correlated with those of effector T-cell subsets. The results indicate that CCR7+CD8+ T cells may regulate effector T-cells involved in TCMR in an in vitro and in an ex vivo transplant model.


Conflict of interest statement

The authors declare no competing interests.

Figures

Figure 1
Figure 1
Induction and expansion of CCR7+CD8+ T cells. PBMCs (n = 5) were collected from healthy individuals, plated at 2 × 105 cells per well and stimulated with anti-CD3 Abs (0.1 μg/ml), recombinant IL-15 (20 ng/ml), IL-2 (20 ng/ml), and retinoic acid (1 μg/ml). On day 3, cells were harvested, stained with antibodies specific to CD8, CCR7, and Foxp3, and analyzed by flow cytometry. The percentage of CCR7+ cells was determined using cells gated for CD8+ (a,b). The percentage of the Foxp3+ and Foxp3+ isotype was determined using cells gated for CD8+CCR7+ (c,d). (e) T-bet and Eomes mRNA expression was by real-time PCR. Bars represent the median with range. *p < 0.05, **p < 0.01 vs. Nil.
Figure 2
Figure 2
CCR7+CD8+ T cell-mediated suppression of activation of isolated CD4+ T cells from healthy donors. They were then cultured under CD4+ T-cell activation conditions with anti-CD3 and anti-CD28 for 72 hours (n = 6). (a) CCR7+CD8+ T cell-mediated suppression of the proliferation of T cells within the PBMC population isolated from healthy donors was measured using a 3H-thymidine incorporation assay. The cells were cultured for 3 days. (b) PBMCs were stained with PE-cy7-CD4, FITC-IFN-γ, PE-IL-17, and APC-IL-10. The proportion of (c) IFN-γ+ in the CD4+ T cells (%), (d) IL-17+ in the CD4+ T cells (%), and (e) IL-10+ in the CD4+ T cells (%) was performed using flow cytometry. *p < 0.05, **p < 0.01 vs. unstimulated CD4+ T cells, #p < 0.05, ##p < 0.01 vs. T cell activation (Th0 condition).
Figure 3
Figure 3
Effect of CCR7+CD8+ T cell-mediated suppression on activated CD4+ T-cell cytokine levels. To induce CD4+ T cell activation, CD4+ T cells (5 × 105) (n = 4) were incubated for 72 h with anti-CD3 and anti-CD28. To investigate the suppressive effects of CCR7+CD8+ T cells, stimulated CD4+ T cells were cultured with CCR7+CD8+ T cells. The secretion of (a) IL-2, (b) IL-17, and (c) IL-10 by stimulated CD4+ T cells was performed by ELISA of the culture supernatant. Note that addition of CCR7+CD8+ T cells significantly decrease IL-2, IL-17, and IL-10 levels that were increased by stimulated CD4+ T cells. **p < 0.01, ***p < 0.001 vs. unstimulated CD4+ T cells and ###p < 0.001 vs. stimulated CD4+T. Values are the median with range of triplicate cultures.
Figure 4
Figure 4
Effect of CCR7+CD8+ T cell-mediated suppression on T-cell proliferation by contact with HRPTEpiC. (a) The protocol for T-cell and HRPTEpiC coculturing. (b) The percentages of IFN-γ, IL-17, and IL-10+ in the CD4+T PKH cells were obtained by flow cytometry. Activated CD4+ T cells were cultured with HRPTEpiC for 72 h, and the percentage of (c) CD4+PKH, (d) IFN-γ+/CD4+PKH, (e) IL-17+/CD4+PKH, and (f) IL-10+/CD4+PKH was performed by flow cytometry (n = 6). Note that addition of CCR7+CD8+ T cells significantly decreased CD4+PKH, IFN-γ+/CD4+PKH, and IL-17+/CD4+PKH levels, which was further increased with HRPTEpiC. *p < 0.05, **p < 0.01 vs. stimulated CD4+ T cells and #p < 0.05, ##p < 0.01 vs. stimulated CD4+ T cells + HRPTEpiC. Values are the median with range of triplicate cultures.
Figure 5
Figure 5
Effect of CCR7+CD8+ T cell-mediated suppression on inflammatory cytokines production by stimulated CD4+ T cells cocultured with HRPTEpiC. (a) IL-2, (b) IFN-γ, (c) IL-17, and (d) IL-10 secretion by stimulated CD4+ T cells cocultured with/without CCR7+CD8+ T cells (as indicated) cocultured for 72 hours with HRPTEpiC (n = 6). Note that CCR7+CD8+ T cells suppressed the CD4+ T-cell production of IL-2, IFN-γ, and IL-17. *p < 0.05, **p < 0.01 vs. stimulated CD4+ T cells and #p < 0.05, ##p < 0.01 vs. stimulated CD4+ T-cell + HRPTEpiC. Values are expressed as the median with range of triplicate cultures.
Figure 6
Figure 6
Comparison of CCR7+CD8+ T and effector T cells in PBMCs from kidney transplant recipients with or without TCMR. (a) The representative figure for the flow cytometric analysis of CCR7+ CD8+, Foxp3+/CCR7+CD8+, CD28nullCD57+, CD45RA+CCR7/CD8+, and CCR4+CCR6+/CD4+ T cells. Panels (b–f) show the comparison of the distribution of (b) CCR7+/CD8+ (c) Foxp3+/CCR7+CD8+, (d) CD28nullCD57+/CD8+, (e) CD45RA+CCR7/CD8+ T (CD8+TEMRA), and (f) CCR4+CCR6+/CD4+ T within the peripheral blood mononuclear cells (PBMCs) between the NC (n = 17) and TCMR group (n = 17). (gi) shows the correlation curve between CCR7+/CD8+ T with (g) CD28nullCD57+/CD8+, (h) CD45RA+CCR7/CD8+, and (i) CCR4+CCR6+/CD4+ T cells. *p < 0.05 between NC and TCMR.

Similar articles

Cited by

References

    1. Sakaguchi S, Yamaguchi T, Nomura T, Ono M. Regulatory T cells and immune tolerance. Cell. 2008;133:775–787. doi: 10.1016/j.cell.2008.05.009. - DOI - PubMed
    1. Campbell DJ. Control of Regulatory T Cell Migration, Function, and Homeostasis. Journal of immunology. 2015;195:2507–2513. doi: 10.4049/jimmunol.1500801. - DOI - PMC - PubMed
    1. Gill RG. An orchestrated dance between differing regulatory T cell phenotypes in allograft tolerance. American journal of transplantation: official journal of the American Society of Transplantation and the American Society of Transplant Surgeons. 2013;13:1945–1946. doi: 10.1111/ajt.12336. - DOI - PubMed
    1. Safinia N, Leech J, Hernandez-Fuentes M, Lechler R, Lombardi G. Promoting transplantation tolerance; adoptive regulatory T cell therapy. Clinical and experimental immunology. 2013;172:158–168. doi: 10.1111/cei.12052. - DOI - PMC - PubMed
    1. Izawa A, et al. A novel alloantigen-specific CD8+ PD1+ regulatory T cell induced by ICOS-B7h blockade in vivo. Journal of immunology. 2007;179:786–796. doi: 10.4049/jimmunol.179.2.786. - DOI - PubMed

Publication types

MeSH terms