Comparative Study
. 2018 Jun 11;8(1):8868.
doi: 10.1038/s41598-018-27293-5.

Brain Cell Type Specific Gene Expression and Co-expression Network Architectures

Affiliations
Comparative Study

Brain Cell Type Specific Gene Expression and Co-expression Network Architectures

Andrew T McKenzie et al. Sci Rep. .

Erratum in

Abstract

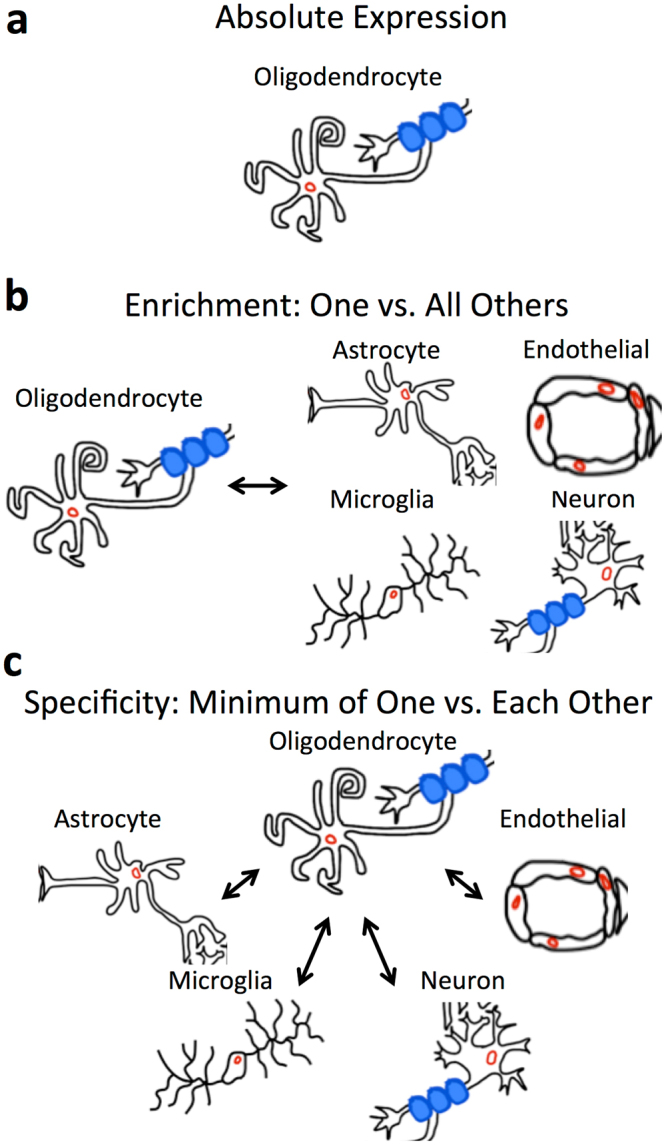
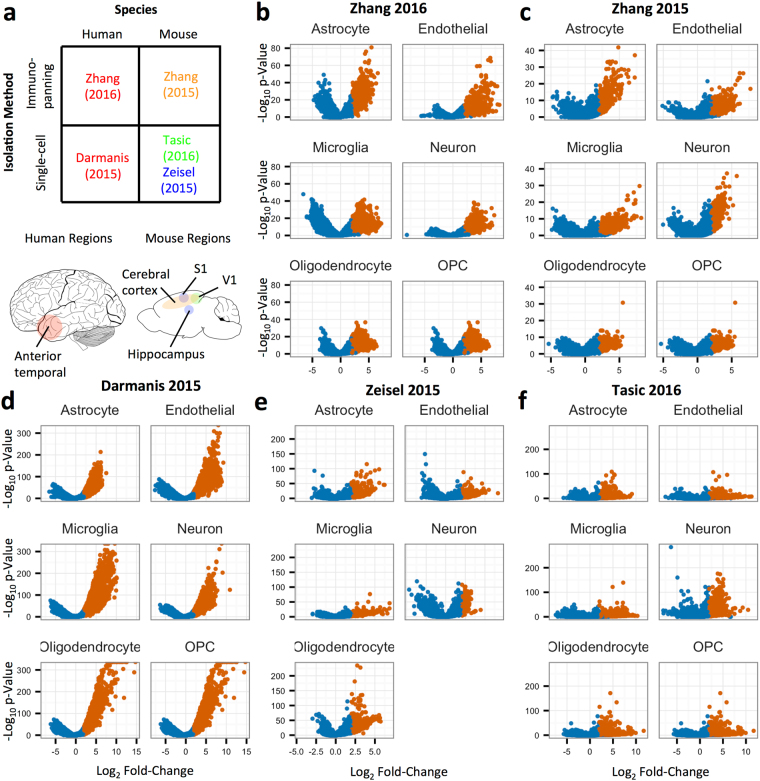
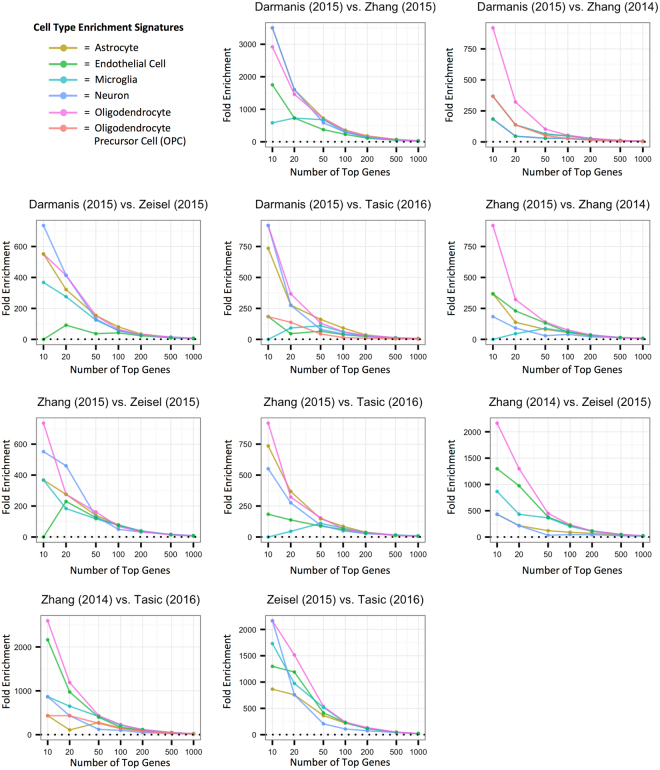
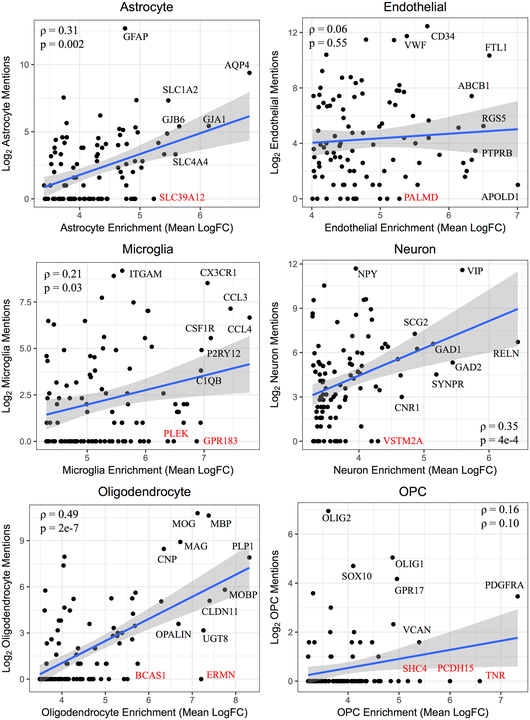
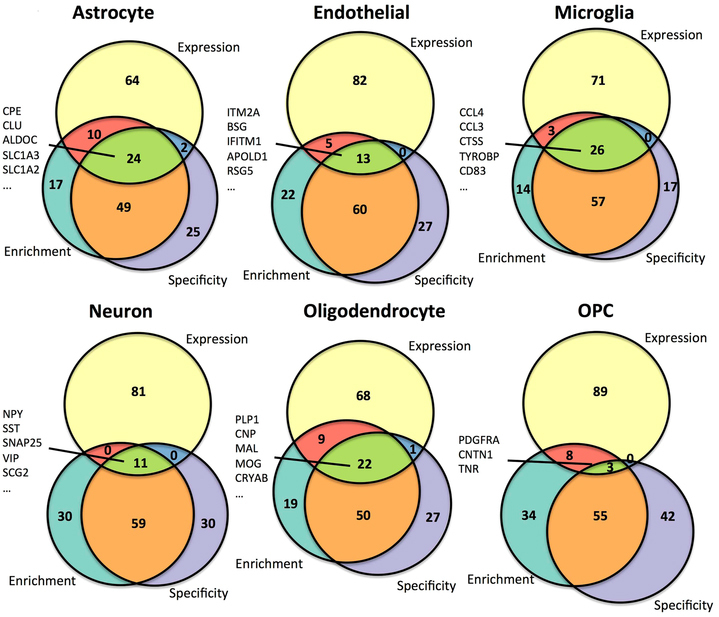
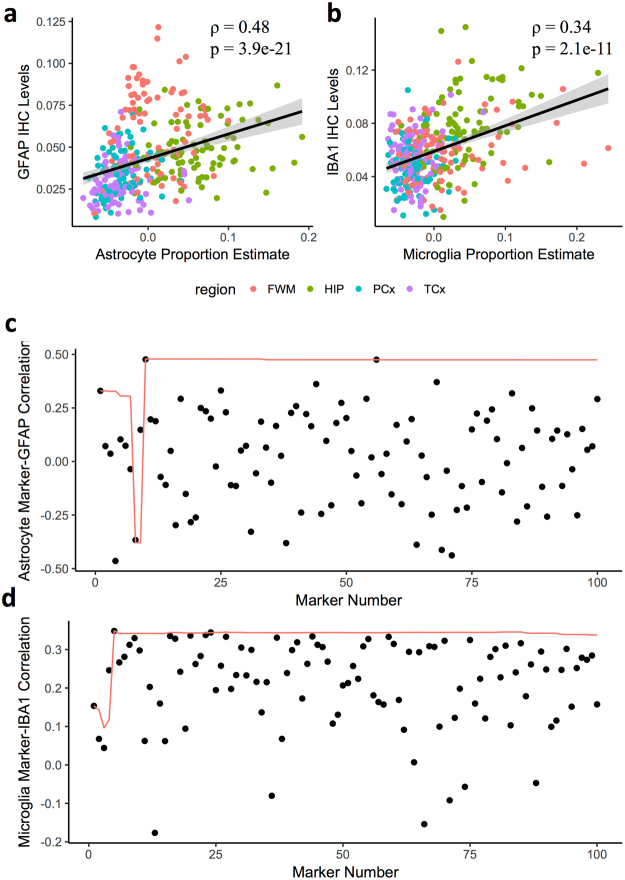
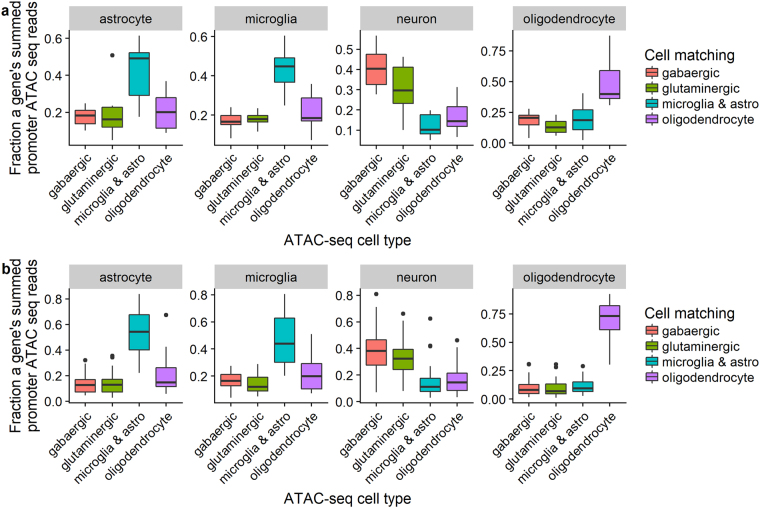
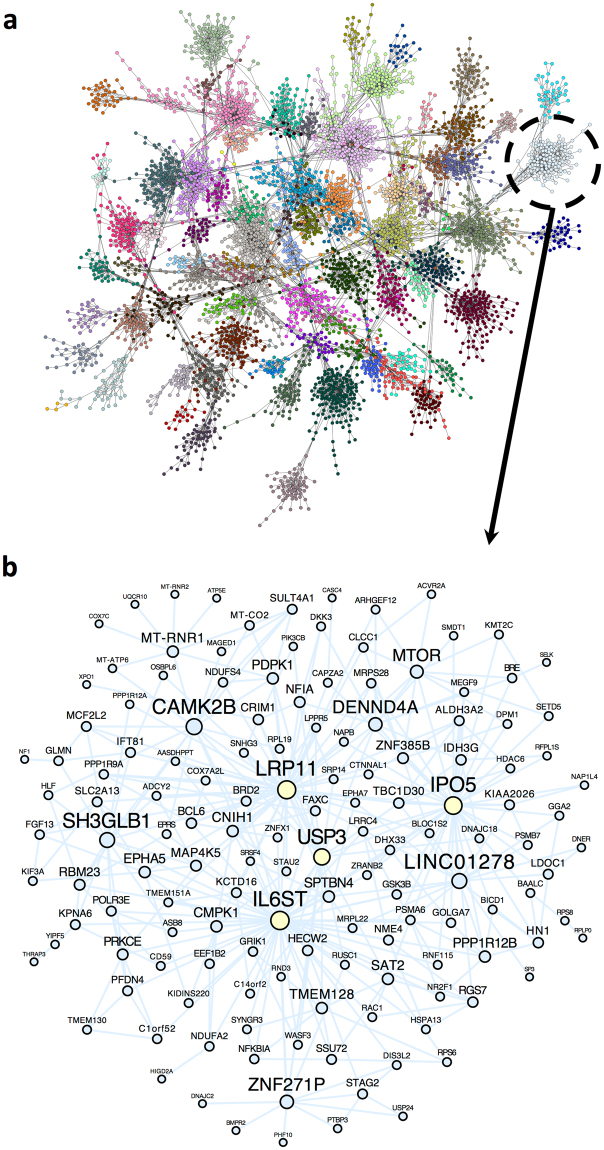
Elucidating brain cell type specific gene expression patterns is critical towards a better understanding of how cell-cell communications may influence brain functions and dysfunctions. We set out to compare and contrast five human and murine cell type-specific transcriptome-wide RNA expression data sets that were generated within the past several years. We defined three measures of brain cell type-relative expression including specificity, enrichment, and absolute expression and identified corresponding consensus brain cell "signatures," which were well conserved across data sets. We validated that the relative expression of top cell type markers are associated with proxies for cell type proportions in bulk RNA expression data from postmortem human brain samples. We further validated novel marker genes using an orthogonal ATAC-seq dataset. We performed multiscale coexpression network analysis of the single cell data sets and identified robust cell-specific gene modules. To facilitate the use of the cell type-specific genes for cell type proportion estimation and deconvolution from bulk brain gene expression data, we developed an R package, BRETIGEA. In summary, we identified a set of novel brain cell consensus signatures and robust networks from the integration of multiple datasets and therefore transcend limitations related to technical issues characteristic of each individual study.


Conflict of interest statement

The authors declare no competing interests.

Figures

Figure 1
Figure 1
Explanation of the three cell type associated measures. Diagrams showing the three cell type-associated measures used in this study. (a) Cell type absolute expression simply measures the relative expression of each gene in each cell type, irrespective of the expression of that gene in other cell types. (b) Cell type enrichment measures the expression of each gene relative to the expression of that gene in all other cell types. With this measure, a gene could have relatively high expression in two cell types, and be relatively enriched in each of them compared to all other cell types. (c) Cell type specificity measures the expression of each gene relative to the highest expression of that gene in all other cell types. This measure requires that the expression of the gene is only high in one cell type; therefore, we call it “specific.”
Figure 2
Figure 2
Differential expression volcano plots across cell types and data sets for cell type enrichment. (a) Summary of the five data sets used in this study indicating the region in which the cell types were isolated from in both the human (left) and mouse (right) brains. (b–f): Volcano plots show the cell type enrichment differential expression calculation for each cell type in each data set (b = Darmanis et al. c = Zhang et al., d = Zhang et al., e = Zeisel et al. f = Tasic et al.). In each small multiple, the x-axis refers to the log2 fold-change of the gene in the cell type of interest compared to the reference cell set, while the y-axis shows the −log10 Benjamini-Hochberg adjusted p-value of that comparison, calculated using edgeR. Genes with adjusted p-values < 0.05 and log fold-change > 2 are colored orange. OPC = Oligodendrocyte Precursor Cell.
Figure 3
Figure 3
Pairwise data set comparison of cell type enrichment rankings for each cell type. Plots of the fold-enrichment of the intersections of genes ranked in the top n genes (where n = 10, 20, 50, 100, 200, 500, 1000) between pairs of data sets for the cell type enrichment measure. The data sets were merged to only include gene symbols common to both prior to calculating the fold enrichment score. A fold enrichment of 0 indicates that no genes were found in the intersection of those two sets of top genes.
Figure 4
Figure 4
Correlation of genewise cell type enrichment measures with PubMed text mining results within cell types. For each of the six cell types, i.e. the astrocyte (a), endothelial cell (b), microglia (c), neuron (d), oligodendrocyte (e), and oligodendrocyte precursor cell (f), the top 100 gene symbols most enriched in that cell type are plotted against the number of PubMed abstracts that mention both that gene symbol as well as the corresponding cell type. The Spearman correlation between these measures was calculated. Several gene symbols were chosen for highlighting, including gene symbols that have not been mentioned in a PubMed abstract with that cell type to date (labeled red). Note that for oligodendrocyte precursor cells (OPCs), the cell type name used in the PubMed search was “oligodendrocyte precursor.”
Figure 5
Figure 5
Intersections among the top genes for three cell type associated measures consensus rankings across all cell types. The top 100 genes ranked across both mouse and human data sets for each of the cell type measures are intersected using approximately proportional Venn diagrams for each of the astrocyte (a), endothelial cell (b), microglia (c), neuron (d), oligodendrocyte (e), and oligodendrocyte precursor cell (f) signatures. The Venn diagrams were generated using the R package Vennerable (version 3.0). The 5 genes with the top expression values in each of the cell types that intersect in all three of the top 100 gene sets are listed, with the exception of OPCs, for which all 7 of the genes with intersections between the three measures are listed.
Figure 6
Figure 6
Cell type relative proportion estimates from bulk RNA expression for astrocytes and microglia are associated with IHC quantifications from the Allen Brain Atlas brain bank. (a-b) Scatter plots of the relative cell type proportion estimates, generated using a singular value decomposition (SVD) of the top 50 marker genes for astrocytes (a) or microglia (b) (x-axis) with the immunohistochemistry (IHC) protein level quantifications for the astrocyte marker GFAP (a) or the microglia IBA1 (b) (y-axis) in the same donors across the four brain regions in the Allen Brain Atlas Aging, Dementia, and TBI data set. The black line is a result of a linear model fit to the data, while the grey lines represent 95% confidence intervals. (c,d) Rho values resulting from rank correlations of the RNA expression of the top 100 marker genes individually (black dots) as well as the SVD-based estimate using the cumulative astrocyte (c) or microglia (d) marker genes up to that marker gene, inclusive (red lines), with the IHC quantifications for GFAP (c) or IBA1 (d). FWM, frontal white matter; HIP, hippocampus; PCx, parietal cortex; TCx, temporal cortex.
Figure 7
Figure 7
Relative chromatin accessibility in (a) novel and (b) known brain cell type marker genes by ATAC-seq. Relative chromatin accessibility, as measured by Assay for Transposase-Accessible Chromatin sequencing (ATAC-seq), at the promoters of novel candidate cell marker genes in four different ATAC-seq cell populations from the adult human brain. “Marker” genes were defined as top cell type-specific genes for a particular cell type. In each panel, the boxplots show the distribution of the fraction of ATAC-seq reads regarding novel markers of a particular cell type. Astro, astrocytes.
Figure 8
Figure 8
Multiscale networks identified within neurons contain neuron-specific modules. (a) Multiscale network modules identified using MEGENA in the Darmanis et al. human neuron-annotated RNA-seq samples. Dots represent genes while lines represent network connections, and dots are colored by their presence in one of several modules. (b) Zoomed-in gene-level network for the genes in Module #57, which is significantly enriched in the GO term “neurotrophin TRK receptor signaling pathway”.
Figure 9
Figure 9
More significant module intersections are found within than between cell types across human to mouse data set comparisons. The proportion (between 0 and 0.5) of modules with significant intersections between MEGENA multiscale models is plotted for the human Darmanis et al. to mouse Tasic et al. (a) and human Darmanis et al. to mouse Zeisel et al. (b) comparisons. A module-module intersection between two cell type-associated multiscale networks was counted as a significant intersection (or overlap) if its Benjamini-Hochberg-adjusted Fisher’s Exact Test p-value was < 0.05. To generate proportions for the number of overlapping modules relative to each mouse cell type module set, the overlap matrix was normalized by column.

Similar articles

Cited by

References

    1. Swanson LW, Bota M. Foundational model of structural connectivity in the nervous system with a schema for wiring diagrams, connectome, and basic plan architecture. Proceedings of the National Academy of Sciences of the United States of America. 2010;107:20610–20617. doi: 10.1073/pnas.1015128107. - DOI - PMC - PubMed
    1. Bakiri Y, Attwell D, Káradóttir R. Electrical signalling properties of oligodendrocyte precursor cells. Neuron glia biology. 2009;5:3–11. doi: 10.1017/S1740925X09990202. - DOI - PubMed
    1. Magistretti PJ. Neuron-glia metabolic coupling and plasticity. The Journal of experimental biology. 2006;209:2304–2311. doi: 10.1242/jeb.02208. - DOI - PubMed
    1. Gokhan S, et al. Combinatorial profiles of oligodendrocyte-selective classes of transcriptional regulators differentially modulate myelin basic protein gene expression. The Journal of neuroscience: the official journal of the Society for Neuroscience. 2005;25:8311–8321. doi: 10.1523/JNEUROSCI.1850-05.2005. - DOI - PMC - PubMed
    1. Lippmann ES, et al. Derivation of blood-brain barrier endothelial cells from human pluripotent stem cells. Nature biotechnology. 2012;30:783–791. doi: 10.1038/nbt.2247. - DOI - PMC - PubMed

Publication types

MeSH terms

Substances

LinkOut - more resources