. 2018 Jun 11;8(1):8841.
doi: 10.1038/s41598-018-27295-3.

Sensing Cell-Culture Assays with Low-Cost Circuitry

Affiliations

Sensing Cell-Culture Assays with Low-Cost Circuitry

Pablo Pérez et al. Sci Rep. .

Abstract

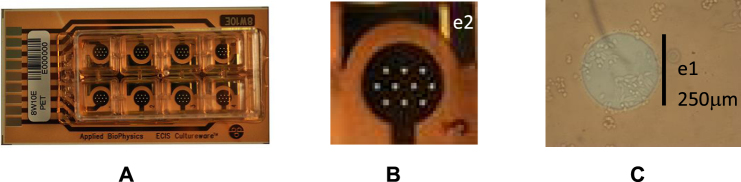
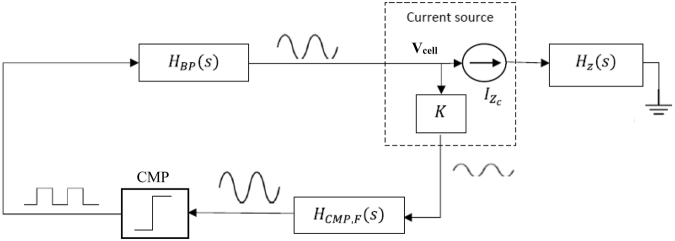
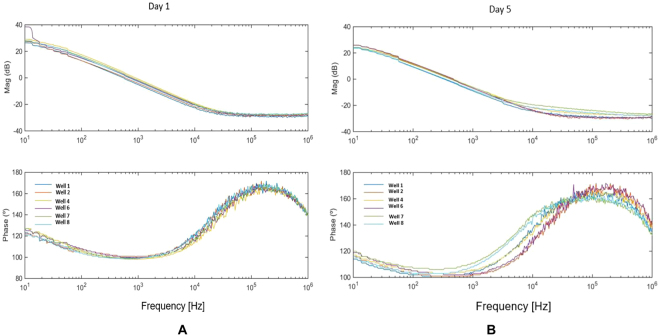
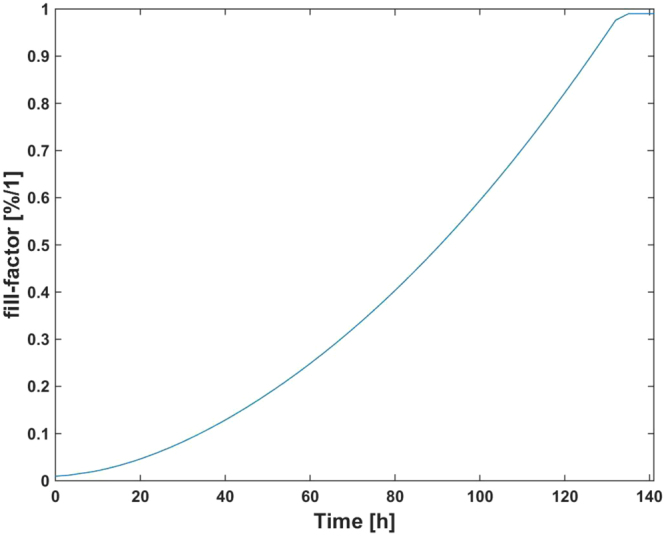
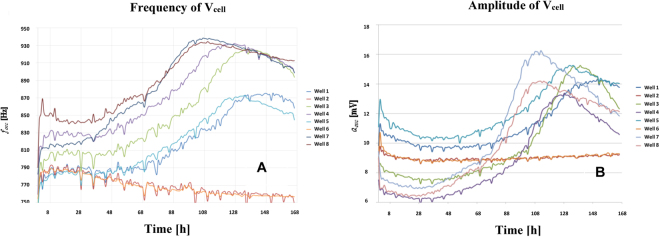
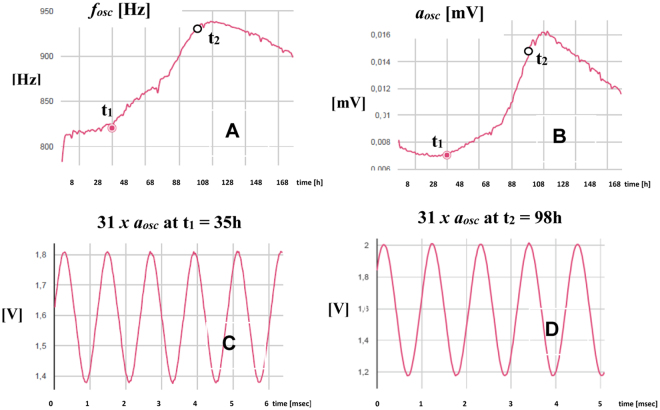
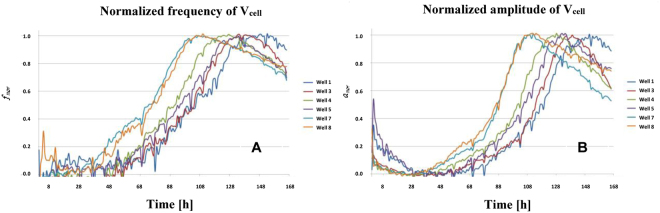
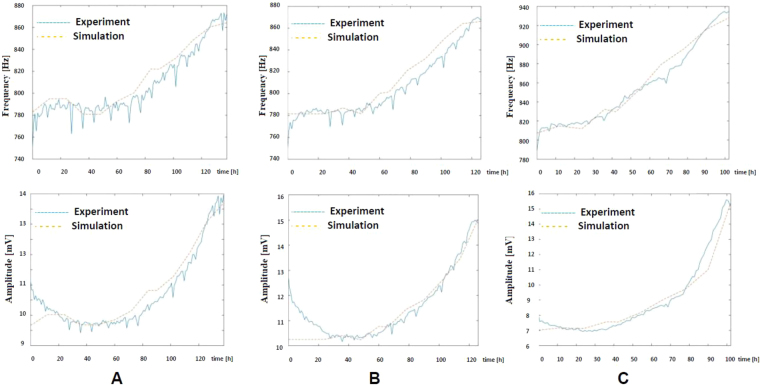
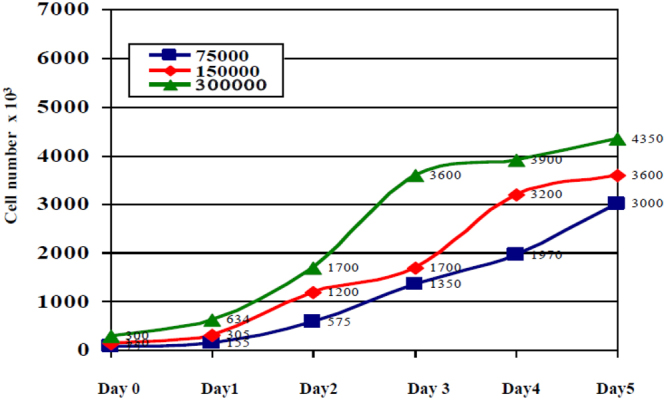
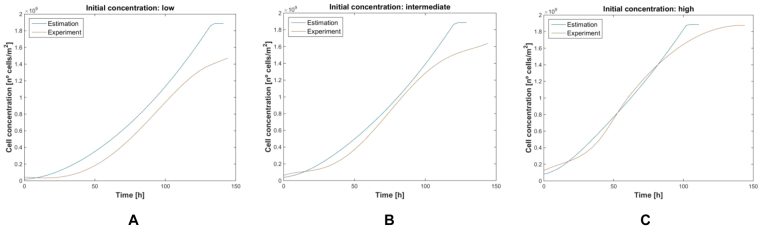
An alternative approach for cell-culture end-point protocols is proposed herein. This new technique is suitable for real-time remote sensing. It is based on Electrical Cell-substrate Impedance Spectroscopy (ECIS) and employs the Oscillation-Based Test (OBT) method. Simple and straightforward circuit blocks form the basis of the proposed measurement system. Oscillation parameters - frequency and amplitude - constitute the outcome, directly correlated with the culture status. A user can remotely track the evolution of cell cultures in real time over the complete experiment through a web tool continuously displaying the acquired data. Experiments carried out with commercial electrodes and a well-established cell line (AA8) are described, obtaining the cell number in real time from growth assays. The electrodes have been electrically characterized along the design flow in order to predict the system performance and the sensitivity curves. Curves for 1-week cell growth are reported. The obtained experimental results validate the proposed OBT for cell-culture characterization. Furthermore, the proposed electrode model provides a good approximation for the cell number and the time evolution of the studied cultures.


Conflict of interest statement

The authors declare no competing interests.

Figures

Figure 1
Figure 1
(A) Electrical model components of one electrode in contact with an ionic solution. (B) Simplified and area-normalized model in Fig. 1A without Warburg impedance. Z(ω) represents CI||Rct. (C) Proposed model for cell-electrode using a Rgap resistance – which models the current flowing in parallel through the interface between the electrode and cell, depending on the electrode-cell distance – and the fill factor parameter (ff = Ac/A). A is the electrode sensing area whereas Ac is the electrode sensing area covered by the attached cells. (D) Illustration of the Rgap effect. The current flows from electrode e1 to e2, as a response to an applied AC voltage.
Figure 2
Figure 2
(A) 8W10E PET cultureware from AB with 8 wells of 0.8 cm2. (B) Cells are measured on top of the 10 circular gold electrodes, e1 (Aelec), with total electrode area A = 10 × Aelec. The sensing area is the sum of the 10 e1 gold electrodes, (A). (C) Photomicrograph of AA8 cells partially covering the area Aelec of a circular electrode.
Figure 3
Figure 3
Simplified circuit block diagram proposed for measurement. It comprises the bio-impedance block Hz(s), including Zcell-electrode, the comparator – K, HCMP,F(s) and CMP – and the band-pass filter HBP(s).
Figure 4
Figure 4
Circuits schematics employed for (A) Band-Pass Filter (BPF), (B) Bio-impedance block and (C) Comparator.
Figure 5
Figure 5
Impedance spectrum of one 8W10E PET electrode, both with medium and cells: magnitude and phase responses, measured with the HP-8591A at day 1 (A) and day 5 (B) of the experiment, for W1: 2500 cells, W2 and W6: medium. W4: 5000 cells, W7 and W8: 10000 cells.
Figure 6
Figure 6
Expected values attained from Eq. (1) to estimate the fill factor vs. time for No = 5000 cells.
Figure 7
Figure 7
Frequency and amplitude values obtained from electrical simulations of the system in Fig. 3. The electrode parameters are experimentally extracted, whereas the ff prediction comes from Eq. (1). The values of the cell-electrode parameters are: Rct = 618 k Ω, CI = 32.2 nF, Rs = 495  Ω, and Rgap = 600  Ω. No = 5000 cells. (A) Frequency vs. fill factor. (B) Amplitude vs. fill factor. (C) Frequency vs. time. (D) Amplitude vs. time.
Figure 8
Figure 8
Measured time evolution of the oscillation frequency (A) and amplitude (B) of the voltage signal Vcell. The curves correspond to 2500 cells (W1, W3), 5000 cells (W4, W5) and 10000 cells (W7, W8), seeded at t = 0 into separate well pairs. Wells W2 and W6 contain only medium. Dips in Fig. 8 are due to noise influence. Signals (currents and voltages) on electrodes and cells must be small enough to avoid damage in cells and preserve the linear model for the electrode-solution. These facts increase the sensitivity of measurements to noise sources and, decreases the Signal-to-Noise Ratio (SNR) in measurements.
Figure 9
Figure 9
Time evolution of oscillation parameters at W7 extracted from the designed web page. Frequency (A) and amplitude (B) of the Vcell signal. Transient signals at t1 = 35 hours, fosc = 824 Hz (C) and t2 = 98 hours, fosc = 923 Hz (D). Note that a scaled factor of 31 is applied to the amplitude.
Figure 10
Figure 10
Normalized frequency (A) and amplitude (B) measured at Vcell. The curves correspond to 2500 cells (W1, W3), 5000 cells (W4, W5) and 10000 cells (W7, W8), seeded at t = 0.
Figure 11
Figure 11
Simulated frequency and amplitude, with Rs in Eq. (4), measured in wells: (A) W1, 2500 cells, (B) W5 with 5000 cells and (C) W7 with 10000 cells. Electrical simulations include the models of cell-electrode and the circuits employed for measuring the cell cultures.
Figure 12
Figure 12
Measurements from AA8 cells; initially seeded cells: 75000 (blue), 150000 (red) and 300000 (green) in Petri-plates.
Figure 13
Figure 13
Evolution of the cell density measurement using Petri plates (brown), and estimated values resulting from frequencies and amplitudes measured in wells W1, W5 and W7 with the proposed circuits (blue), then decoded with the proposed electrical models. Cell densities were calculated for: (A) 75000 (2500) cells, (B) 150000 (5000) cells and (C) 300000 (10000) cells for each Petri plate (AB wells). Values employed in Eq. (1) are rcell = 12.56 μm, and 20 hours for time division.

References

    1. Freshney, R. I. Culture of Animal Cells: A Manual of Basic Technique and Specialized Applications, 7th Edition, Wiley-Blackwell. (2016).
    1. Giaever I, Keese CR. Use of Electric Fields to Monitor the Dynamical Aspect of Cell Behaviour in Tissue Cultures. IEEE Transactions on Biomedical Engineering, vol. BME-33, no. 1986;2:242–247. doi: 10.1109/TBME.1986.325896. - DOI - PubMed
    1. Giaever I, Keese CR. Micromotion of mammalian cells measured electrically. Proc. Nail. Acad. Sci. USA Cell Biology. 1991;88:7896–7900. doi: 10.1073/pnas.88.17.7896. - DOI - PMC - PubMed
    1. Reitinger S, Wissenwasser J, Kapferer W, Heer R, Lepperdinger G. Electric impedance sensing in cell-substrates for rapid and selective multipotential differentiation capacity monitoring of human mesenchymal stem cells. Biosensors and Bioelectronics. 2012;34(no 1):63–69. doi: 10.1016/j.bios.2012.01.013. - DOI - PubMed
    1. Yeh, C., To, P. & Lin, Y. Using the micro-array electrode chip and AC signals to generate the electric field effect on cell migration. Sensors and Actuators B: Chemical (2012).

Publication types

LinkOut - more resources