. 2018 Jul;21(7):974-984.
doi: 10.1038/s41593-018-0164-7. Epub 2018 Jun 11.

Thalamic dual control of sleep and wakefulness

Affiliations

Thalamic dual control of sleep and wakefulness

Thomas C Gent et al. Nat Neurosci. 2018 Jul.

Abstract

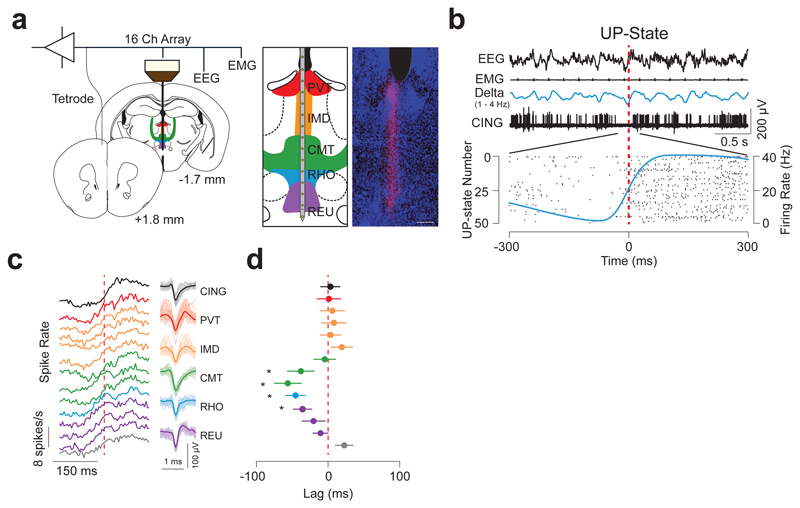
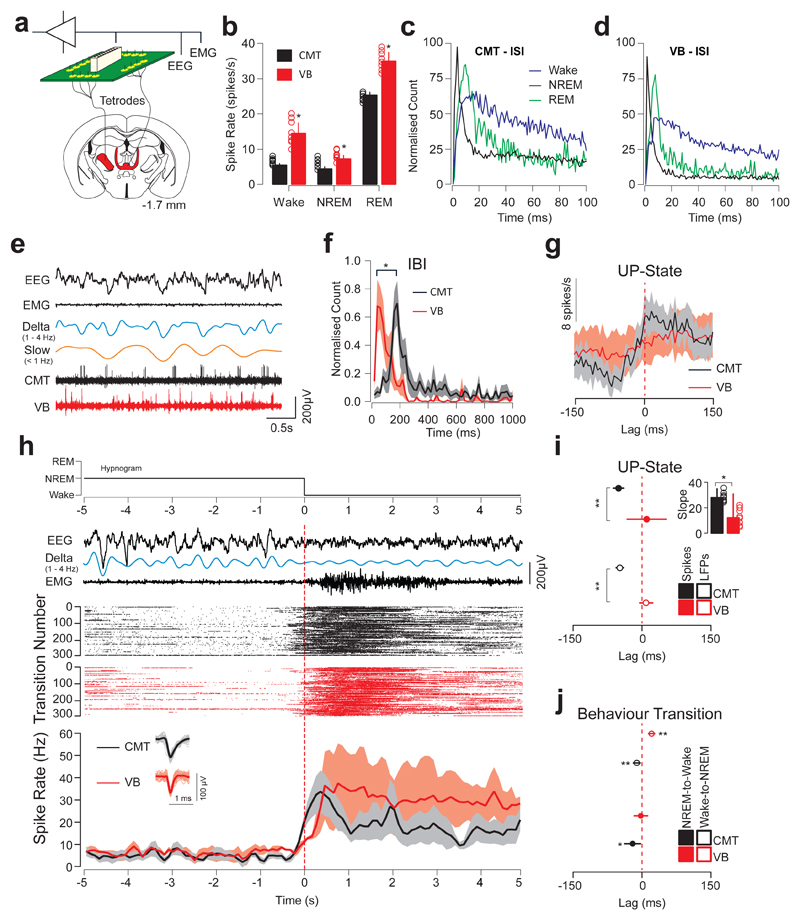
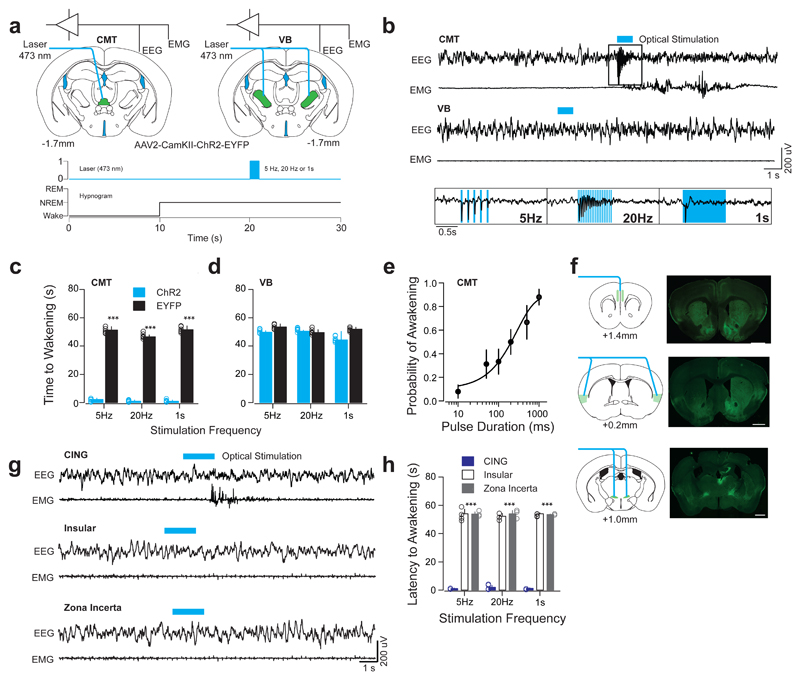
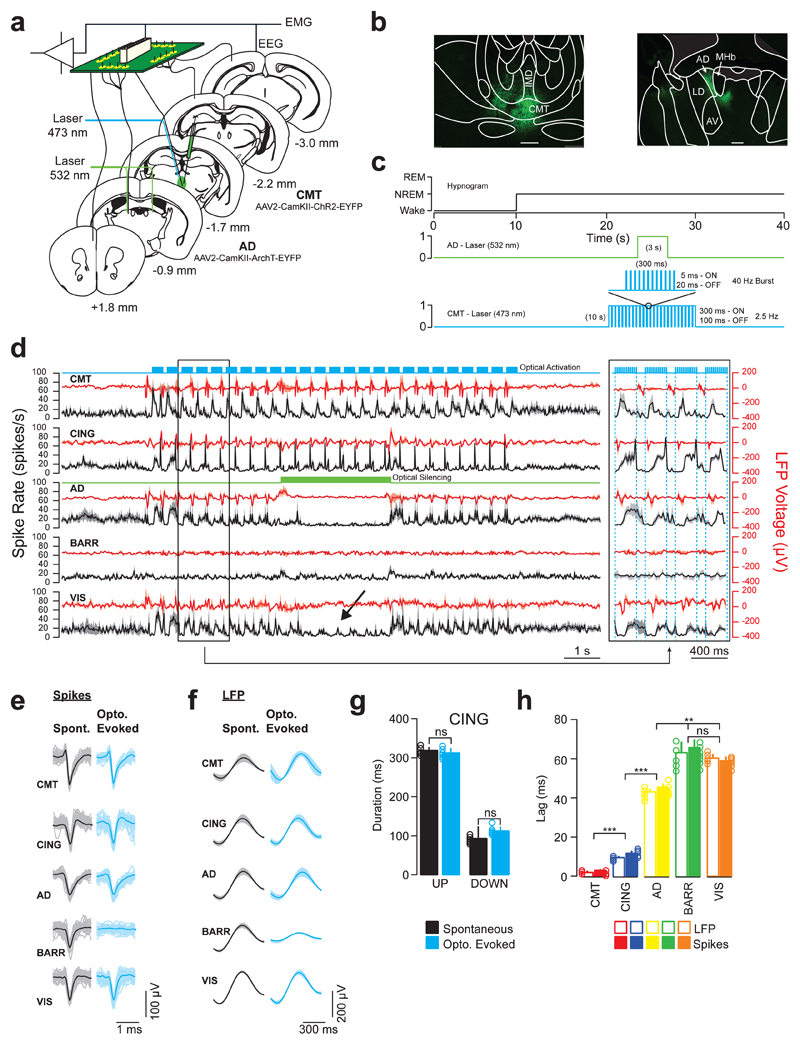
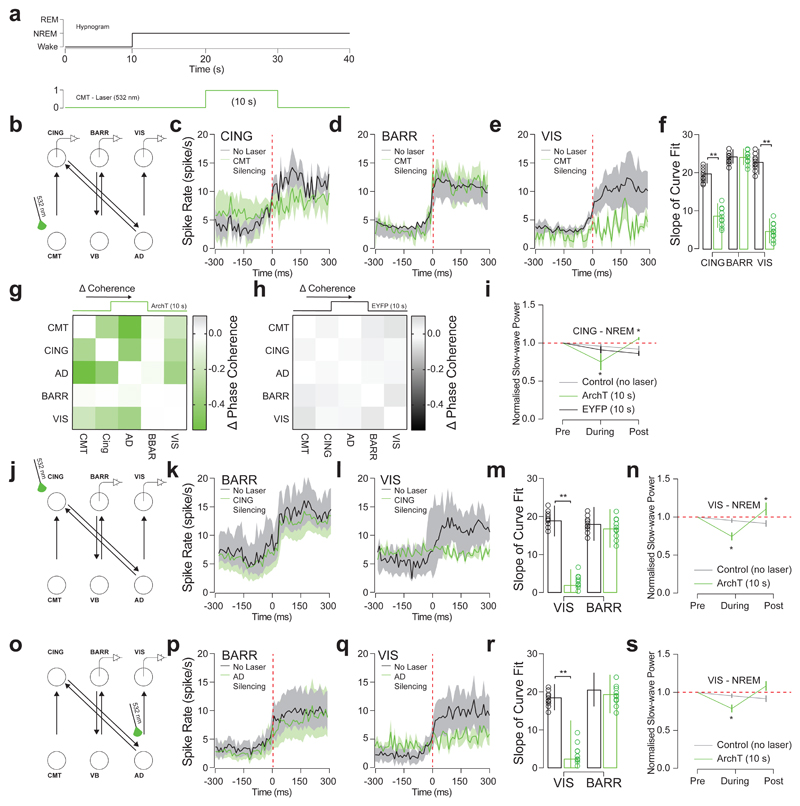
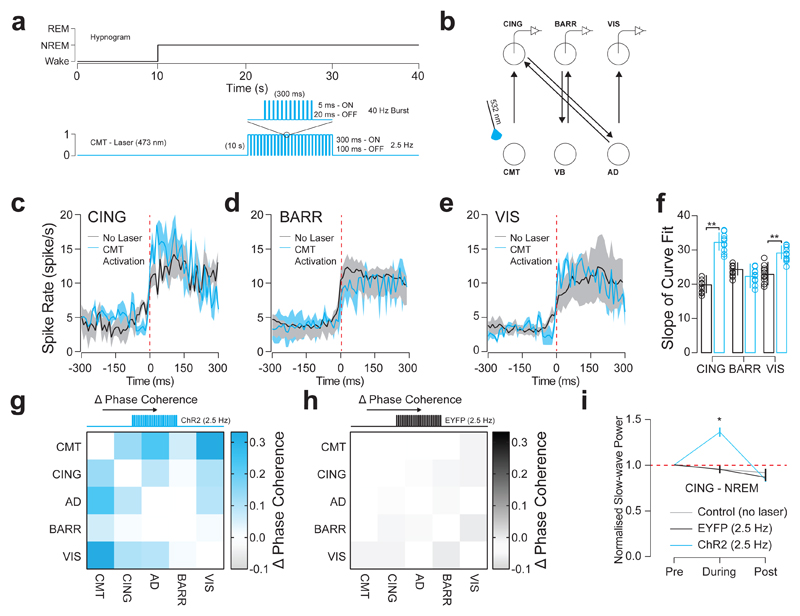
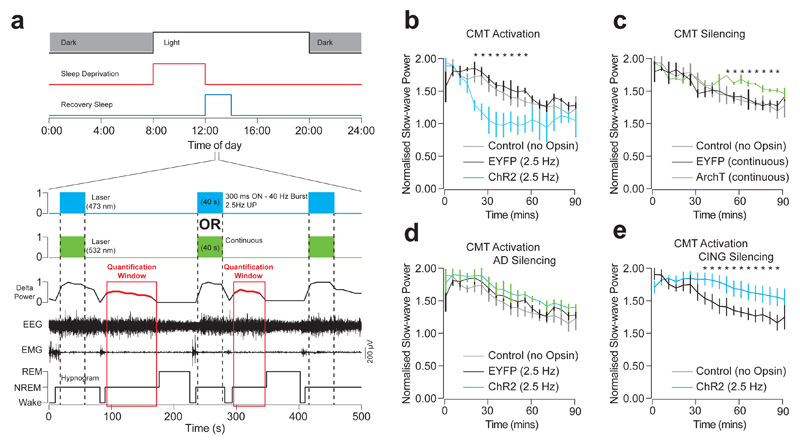
Slow waves (0.5-4 Hz) predominate in the cortical electroencephalogram during non-rapid eye movement (NREM) sleep in mammals. They reflect the synchronization of large neuronal ensembles alternating between active (UP) and quiescent (Down) states and propagating along the neocortex. The thalamic contribution to cortical UP states and sleep modulation remains unclear. Here we show that spontaneous firing of centromedial thalamus (CMT) neurons in mice is phase-advanced to global cortical UP states and NREM-wake transitions. Tonic optogenetic activation of CMT neurons induces NREM-wake transitions, whereas burst activation mimics UP states in the cingulate cortex and enhances brain-wide synchrony of cortical slow waves during sleep, through a relay in the anterodorsal thalamus. Finally, we demonstrate that CMT and anterodorsal thalamus relay neurons promote sleep recovery. These findings suggest that the tonic and/or burst firing pattern of CMT neurons can modulate brain-wide cortical activity during sleep and provides dual control of sleep-wake states.


Conflict of interest statement

The authors declare no competing financial interests.

Figures

Figure 1
Figure 1. CMT neuron spiking is phase-advanced to cortical UP-states.
a, Schematic of instrumentation (left) for chronic recording from 16-channel linear array electrode in the midline thalamus and tetrode in CING in freely-moving mice. Illustration (middle) and anatomical verification (right) of the electrode array placement across the midline thalamic nuclei are shown. Scale bar: 150 µm. b, Representative EEG, EMG, LFPs and neuron unit recordings in CING during NREM sleep. Onset of the cortical UP-state is shown by the vertical dashed line (red) which corresponds to the detection of UP-states from the EEG based on zero-crossing (see Methods). Raster plot shows spiking activity from a representative CING neuron at the onset of 50 successively detected UP-states (bottom) recorded during spontaneous NREM. Average neuronal firing rate for the neuron (based on 10 ms bins) is shown by the blue solid line. Note the sigmoidal shape. c, Averaged spiking rate traces for each recording site (n = 13, 8, 8, 6, 6, 8, 7, 7, 8, 7, 7, 8, 8, 7 cells from top to bottom; during 28390 UP-states, from n = 6 animals) at the onset of the UP-state (dashed red line) during spontaneous NREM sleep. The grey plot indicates neurons recorded ventral to the midline thalamus. Representative spike waveforms for each nucleus are shown on the right. d, Averaged lags ± S.E.M. of half times from sigmoidal fits of spiking rates at the onset of cortical UP-state. Note the CMT neuron spike rate advancement over other thalamic and neocortical neurons. (CMT vs reuniens, rhomboideus, intermediodorsal, and paraventricular, P = 0.0073; f = 4.422; d.f. = 4; n = 22, 23, 7, 28 and 8 cells, respectively, n = 6 animals; one-way ANOVA;).
Figure 2
Figure 2. CMT neuron spiking is phase-advanced to sensory thalamus and to sleep-wake transitions.
a, Schematic of instrumentation for chronic simultaneous EEG/EMG and tetrode recording in CMT and VB in freely-moving mice. b, Averaged neuron spike rates ± S.E.M. of CMT (black) and VB (red) neurons across sleep-wake states (Wake: P = 0.032; t = 3.71; d.f. = 5; NREM: P = 0.041; t = 3.00; d.f. = 5; REM: P = 0.0087; t = 4.55; d.f. = 5; n = 8 cells per nucleus from 6 animals; one-sided t-test. c, d, Averaged inter-spike intervals of CMT (c) and VB (d) neurons during wake (black), NREM (blue) and REM (green) sleep states. Note the sharp peak due to the bursting activity of thalamic neurons during NREM. e, Representative EEG/EMG traces and unit activity of CMT (black) and VB (red) neurons during NREM. Filtered delta (1 – 4 Hz) and slow oscillations (< 1 Hz) are shown. f, Inter-burst intervals (mean ± S.E.M.) of CMT (black) and VB (red) neurons during NREM. Peaks of inter-burst interval counts were significantly different for neurons in the two nuclei demonstrating the absence of phase-locking of neuron bursting in the two nuclei. (P = 0.0064; t = 8.86; d.f. = 10; two-sided t-test). g, Averaged spike rates ± S.E.M. of CMT (black) and VB (red) neurons at the onset of cortical UP-states (dashed red line) during spontaneous NREM. h, Representative Hypnogram, EEG/EMG, delta (filtered 1 – 4 Hz), CMT and VB neuronal spiking activity across NREM-to-Wake transitions. Raster plots show spiking activity for one representative cell in CMT (black) and VB (red) recorded concurrently from the same animal recorded over 300 successive NREM-to-Wake transitions during a 6-hour electrophysiological recording (ZT 3 – 9). Note that data was scored in 1-s epochs and microarousals were scored as wake events. Averaged neuronal firing rates ± S.E.M. for CMT (n = 8 cells; black) and VB (n = 8 cells; red; from n = 6 animals) neurons are shown across NREM-to-Wake transitions (bottom). Vertical lines (red dashed) indicate the onset of wakefulness. Representative spike waveforms are shown (bottom, inset). i, Averaged lags ± S.E.M. of CMT (black) and VB (red) neuron spike rate (solid) and LFP (open) at the onset of the cortical UP-states (red dashed line). Note the advancement of CMT neuron spiking to cortical UP-states compared to VB neuron spiking. (P = 0.0008; two-sided t-test; t = 9.7; d.f. = 6; one-sided t-test). Inset: slope of sigmoidal curve fits for CMT (black) and VB (red) neurons at the onset of the cortical UP-state. (P = 0.017, t = 2.40; d.f. = 14; two-sided t-test). j, Averaged lags ± S.E.M of CMT (black) and VB (red) neuron spiking rates across NREM-to-Wake and Wake-to-NREM transitions (n = 8 cells per nucleus from 6 animals). (P = 0.027; t = 6.39; d.f. = 6; two-sided t-test).
Figure 3
Figure 3. Optogenetic activation of CMT, but not VB, neurons entrains cortical UP-like states and induces arousal.
a, Schematic of a brain coronal section illustrating the AAV2-CamKII-ChR2-EYFP or AAV2-CamKII-EYFP (control) injection sites and chronic optical fiber implantation in CMT (left) and VB (right) areas. Bottom, experimental timeline showing blue optical stimulation trains (blue bar) delivered 10 s after the onset of NREM. b, Representative EEG/EMG traces from CMT (top) and VB (middle) illustrate arousal responses upon optogenetic activation. Note the high-fidelity entrainment of cortical activity upon optical activation of ChR2-EYFP-expressing CMT neurons at 5 and 20 Hz or continuous illumination (1 s, blue bar; bottom insets). c, d, Averaged latencies to awakening ± S.E.M. following optogenetic CMT (c) or VB (d) neuron activation (n = 6 animals per group). Data is based on a minimum of 10 stimulations per frequency per animal. (5 Hz: P = 0.00008; t = 26.75; d.f. = 10; 20 Hz: P = 0.00006; t = 41.68; d.f. = 10; 1 s: P = 0.00006; t = 27.23; d.f. = 10; two-sided t-test). e, Averaged probability of awakenings ± S.E.M. upon increasing durations of single-pulse optogenetic CMT neuron activation. Values represent (Boltzmann sigmoidal curve fit, based on a minimum of 10 stimulations per duration per animal). f, Schematic for optogenetic activation of CMT axon terminals (left panels) and representative photomicrographs of coronal brain sections showing of ChR2-EYFP-expressing CMT axons (right panels) in CING (top), insular cortex (middle) and ZI (bottom). Scale bar: 1 mm. g, Representative EEG/EMG traces illustrate arousal response upon optogenetic activation of ChR2-EYFP-expressing CMT axons in CING (top), insular cortex (middle) and ZI (bottom) at various frequencies (5Hz, 20Hz, or continuous, 1 s; blue bar). Note the absence of awakenings upon activation of insular cortex or ZI. h, Averaged latencies to awakening ± S.E.M. upon optical activation of ChR2-EYFP-expressing CMT axon terminals in CING, insular cortex and ZI (minimum of 10 stimulations per frequency per animal, n = 5 animals per group). Note that stimulation of CING in non-transfected control animals did not induce awakening (P = 0.00013; f = 2567; d.f. = 2; two-way ANOVA).
Figure 4
Figure 4. AD neurons relay CMT-induced UP-like states to posterior cortical areas.
a, Schematic of instrumentation for chronic implantation of multi-site tetrode recordings from CMT, CING, AD, BARR and VIS and optic fiber implants over CMT and AD (bilateral). AAV2-CamKII-ChR2-EYFP and AAV2-CamKII-ArchT-EYFP were stereotactically injected into CMT and AD (bilateral), respectively. b, Representative photomicrographs of coronal brain sections showing ChR2-EYFP-expressing CMT neurons (left) and ArchT-EYFP expressing AD neurons (right). Scale bar, 100 µm. Note the projections from CMT and AD neurons extending to the centro-lateral nucleus and internal capsule, respectively. Data repeated in n = 6 animals. c, Experimental timeline showing blue optical activation of UP-like states (5 ms pulses, 300 ms ON, 100 ms OFF, 10 s duration) in CMT neurons and green optical silencing (3 s) of AD neurons, delivered 10 s after the onset of NREM. d, Averaged traces ± S.E.M. of CMT (n = 9 cells), CING (n = 8 cells), AD (n = 9 cells), BARR (n = 9 cells) and VIS (n = 8 cells; from n = 6 animals) neuron spiking activity (black) and LFP voltage (red) during combinatorial optogenetic experiments. Note the high-fidelity of CMT-induced UP-like states travelling along the CING-AD-VIS pathway and the complete blockade of spike transfer to VIS upon AD silencing (arrow). An expanded exert of the traces illustrating the lag of entrainment is shown on the right. e, Representative spike waveforms for spontaneous (black) and CMT-evoked (blue) neuronal firing in CMT, CING, AD, BARR and VIS. f, Average waveforms ± S.E.M. of spontaneous (black) and CMT-evoked (blue) UP-states in CMT, CING, AD, BARR and VIS. (n = 8 animals). g, Average durations of spontaneous (black) and evoked (blue) UP and Down states in CING (UP: P = 0.45; t = 0.87; d.f. = 7; DOWN: P = 0.56; t = 0.66; d.f. = 7; two-sided t-test; n = 8 animals; ns = not significant). h, Averaged neuron spiking and LFP lags ± S.E.M. from CMT (red), CING (blue), AD (yellow), BARR (green) and VIS (orange) upon optical activation of ChR2-EYFP-expressing CMT neurons. (CMT-to-CING: P = 0.00009; t = 9.18; d.f. = 8; CING -to-AD: P = 0.000017; t = 22.35; d.f. = 8; AD-to-BARR: P = 0.0068; t = 3.621; d.f. = 8; AD-to-VIS: P = 0.0094; t = 7.18; d.f. = 8; BARR-to-VIS: P = 0.64; t = 0.49; d.f. = 8; one-sided t-test; ns = not significant).
Figure 5
Figure 5. CMT neuron firing is necessary for cortical UP-state synchrony
a, Experimental timeline showing optical silencing (10 s, 532 nm) of ArchT-expressing CMT neurons 10 s after the onset of NREM. b, Schematic of N-type circuit and instrumentation for chronic implantation of multi-site tetrode recordings from CING, BARR and VIS and optic fiber implants over CMT. AAV2-CamKII-ArchT-EYFP was stereotactically injected into CMT. c, d, e, Average spiking rates ± S.E.M. for CING (c; n = 9 cells), BARR (d; n = 6 cells) and VIS (e; n = 8 cells; from n = 6 animals) neurons at the onset of the cortical UP-states (red dashed line). Note that silencing of EYFP-expressing CMT neurons (control) did not significantly change spiking rates in CING (P = 0.44; t = 1.74; d.f. = 16; n = 9 cells; n = 6 animals; two-sided t-test). f, Average slope ± S.E.M. of curve fits for spiking rates at the start cortical UP-state. (CING: P = 0.008; t = 2.66; d.f. = 16; n = 9 cells; BARR: P = 0.96; t = 0.05, d.f. = 10; n = 6 cells; VIS: P = 0.002; t = 3.87; d.f. = 14; n = 8 cells; from n = 6 animals; two-sided t-test). g, h, Averaged change in phase coherence for CMT, CING, AD, BARR and VIS for optical silencing of CMT neurons expressing ArchT-EYFP (g) and EYFP (h). i, Averaged delta power ± S.E.M. of LFP signals recorded in CING 10 s before, during and 10 s after optogenetic silencing of ArchT-(green) or EYFP-(black) expressing CMT neurons compared to control conditions (grey). Delta power is normalized to the first 10 s of NREM. Note the rebound in delta activity after CMT neuron silencing (dotted red line). (P = 0.005; two-sided t-test; t = 5.02; d.f. = 5; n = 6; animals compared to normalized value 1). j, Schematic of N-type circuit and instrumentation for chronic implantation of multi-site tetrode recordings from BARR and VIS and optic fiber implants over CING. AAV2-CamKII-ArchT-EYFP was stereotactically injected into CING. k, l, Average spiking rates ± S.E.M. for BARR (k; n = 6 cells) and VIS (l; n = 6 cells; from n = 5 animals) neurons at the onset of the cortical UP-states (red dashed line). m, Average slope ± S.E.M. of curve fits for spiking rates at the start cortical UP-state. (BARR: P = 0.86; t = 1.02; VIS: P = 0.014; t = 3.99; d.f. = 4; two-sided t-test;). n, Averaged delta power ± S.E.M. in VIS 10 s before, during and 10 s after optogenetic silencing of ArchT-expressing CING neurons (green; P = 0.036; one-sided t-test; t = 3.99; d.f. = 3; one-sided t-test; from n = 5 animals) and control conditions (grey). Delta power is normalized to the first 10 s of NREM. Note the rebound in delta activity after CMT neuron silencing (dotted red line; P = 0.039; one-sided t-test; t = 3.45; d.f. = 3; one-sided t-test; compared to normalized value 1). o, Schematic of N-type circuit and instrumentation for chronic implantation of multi-site tetrode recordings from BARR and VIS and optic fiber implants over AD. AAV2-CamKII-ArchT-EYFP was stereotactically injected into AD. p, q, Average spiking rates ± S.E.M. for BARR (p; n = 9 cells) and VIS (q; n = 10 cells; from n = 6 animals) neurons at the onset of the cortical UP-states (red dashed line). r, Average slope ± S.E.M. of curve fits for spiking rates at the start cortical UP-state. BARR: P = 0.75; t = 1.73; d.f. = 7; n = 9 cells; VIS: P = 0.036; t = 6.84, d.f. = 8; n = 10 cells; n = 6 animals; two-sided t-test). s, Averaged delta power ± S.E.M. in VIS 10 s before, during and 10 s after optogenetic silencing of ArchT-expressing AD neurons (green) and control conditions (grey). Delta power is normalized to the first 10 s of NREM. Note the rebound in delta activity after CMT neuron silencing (dotted red line; P = 0.011; t = 4.63; d.f. = 4; from n = 6 animals; one-sided t-test; compared to normalized value 1).
Figure 6
Figure 6. CMT neuron firing increases synchrony of cortical UP-states
a, Experimental timeline showing optogenetic activation of UP-like states (5 ms, 300 ms ON, 100 ms OFF, 10 s duration) in CMT neurons delivered 10 s after the onset of NREM. b, Schematic of N-type circuit and instrumentation for chronic implantation of multi-site tetrode recordings from CING, BARR and VIS and optic fiber implants over CMT. AAV2-CamKII-ChR2-EYFP was stereotactically injected into CMT. c, d, e, Average spiking rates ± S.E.M. for CING (c; n = 8 cells), BARR (d; n = 6 cells) and VIS (e; n = 7 cells; from n = 6 animals) neurons at the onset of the cortical UP-states (red dashed line; spontaneous: black; evoked: blue). f, Average slope ± S.E.M. of curve fits for spiking rates at the start cortical UP-state. (CING: P = 0.004; t = 3.29; d.f. = 16; n = 8 cells; BARR: P = 0.62; t = 0.51, d.f. = 12; n = 6 cells; VIS: P = 0.013; t = 2.58; d.f. = 14; n = 7 cells; from n = 6 animals; two-sided t-test) g, h, Averaged change in phase coherence for CMT, CING, AD, BARR and VIS for blue optical activation of CMT neurons expressing ChR2-EYFP (g) and EYFP (h). i, Averaged delta power ± S.E.M. in CING 10 s before, during and 10 s after optogenetic activation of CMT neurons expressing ChR2-EYFP (blue), EYFP (black) and control conditions (grey). Delta power is normalized to the first 10 s of NREM. (P = 0.0006; t = 7.59; d.f. = 5; n = 6 animals; two-sided t-test).
Figure 7
Figure 7. CMT neuron activity promotes sleep recovery.
a, Experimental timeline showing sleep deprivation and sleep recovery protocols. ChR2-EYFP expressing CMT neurons were activated with blue light (300m ON, 100ms OFF, 40 s duration) and ArchT-EYFP expressing CMT silenced with green light (40 s continuous) during every second NREM period during recovery sleep. The rebound delta power was measured from the interleaving NREM periods. b-e, Average delta power ± S.E.M. during sleep recovery in CING during optogenetic stimulation of UP-states in CMT neurons (b: P < 0.035; t = 4.59; d.f. = 7; one-way ANOVA; n = 6 animals), optogenetic silencing of CMT neurons (c: P < 0.027; t = 3.86; d.f. = 5; one-way ANOVA; n = 6 animals), optogenetic stimulation of CMT neurons with concurrent optogenetic silencing of AD neurons (d: P = 0.25; t = 1.74; d.f. = 5; one-way ANOVA; n = 6 animals) and optogenetic silencing of CING neurons (e: P = 0.013; t = 5.68; d.f. = 4; one-way ANOVA; n = 5 animals).

References

    1. Steriade M, Nunez A, Amzica F. Intracellular analysis of relations between the slow (< 1 Hz) neocortical oscillation and other sleep rhythms of the electroencephalogram. J Neurosci. 1993;13:3266–3283. - PMC - PubMed
    1. Steriade M, Nunez A, Amzica F. A novel slow (< 1 Hz) oscillation of neocortical neurons in vivo: depolarizing and hyperpolarizing components. J Neurosci. 1993;13:3252–3265. - PMC - PubMed
    1. Nir Y, et al. Selective neuronal lapses precede human cognitive lapses following sleep deprivation. Nat Med. 2017;23:1474–1480. - PMC - PubMed
    1. Contreras D, Steriade M. Cellular basis of EEG slow rhythms: a study of dynamic corticothalamic relationships. J Neurosci. 1995;15:604–622. - PMC - PubMed
    1. Neske GT, Patrick SL, Connors BW. Contributions of diverse excitatory and inhibitory neurons to recurrent network activity in cerebral cortex. J Neurosci. 2015;35:1089–1105. - PMC - PubMed

Publication types