Review
. 2019 Feb;24(2):266-281.
doi: 10.1038/s41380-018-0098-1. Epub 2018 Jun 11.

Brain age and other bodily 'ages': implications for neuropsychiatry

Affiliations
Review

Brain age and other bodily 'ages': implications for neuropsychiatry

James H Cole et al. Mol Psychiatry. 2019 Feb.

Abstract

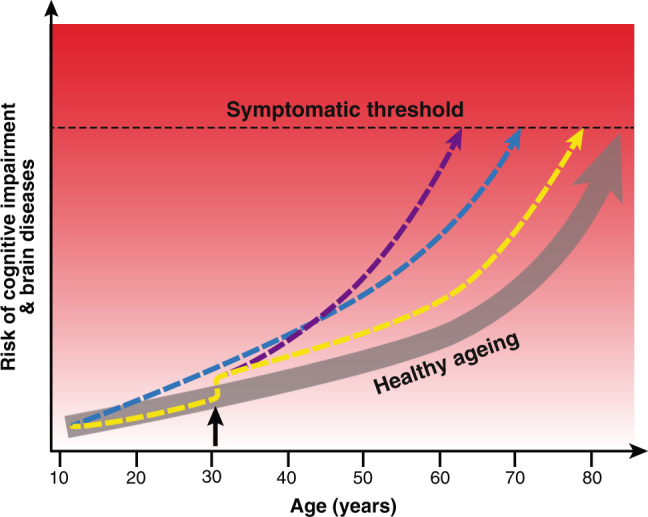
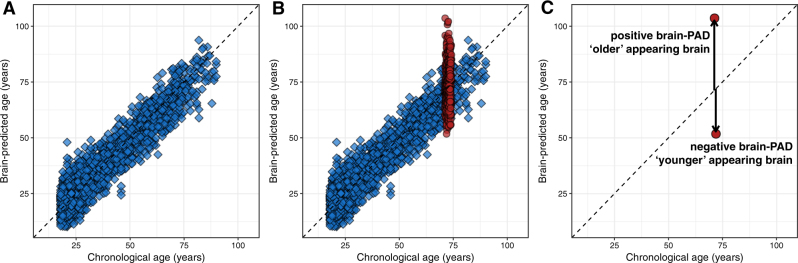
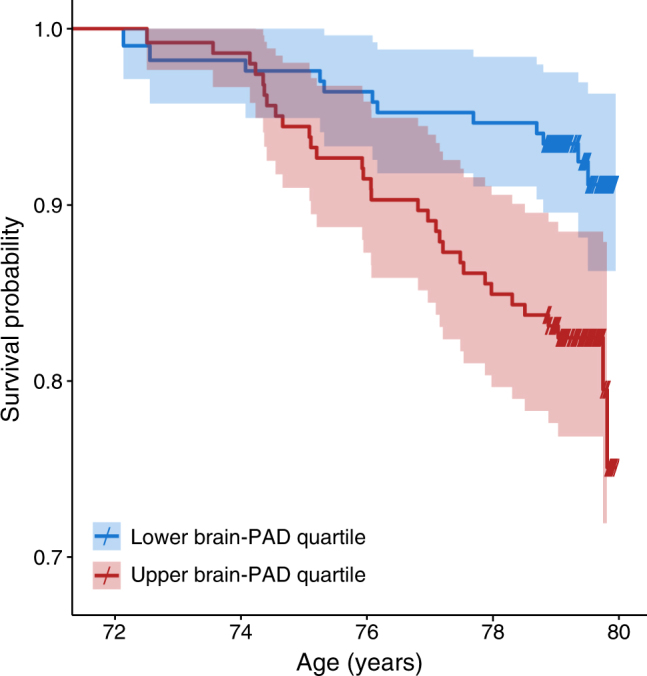
As our brains age, we tend to experience cognitive decline and are at greater risk of neurodegenerative disease and dementia. Symptoms of chronic neuropsychiatric diseases are also exacerbated during ageing. However, the ageing process does not affect people uniformly; nor, in fact, does the ageing process appear to be uniform even within an individual. Here, we outline recent neuroimaging research into brain ageing and the use of other bodily ageing biomarkers, including telomere length, the epigenetic clock, and grip strength. Some of these techniques, using statistical approaches, have the ability to predict chronological age in healthy people. Moreover, they are now being applied to neurological and psychiatric disease groups to provide insights into how these diseases interact with the ageing process and to deliver individualised predictions about future brain and body health. We discuss the importance of integrating different types of biological measurements, from both the brain and the rest of the body, to build more comprehensive models of the biological ageing process. Finally, we propose seven steps for the field of brain-ageing research to take in coming years. This will help us reach the long-term goal of developing clinically applicable statistical models of biological processes to measure, track and predict brain and body health in ageing and disease.


Conflict of interest statement

The authors declare that they have no conflict of interest.

Figures

Fig. 1
Fig. 1
Differential trajectories of brain ageing. Illustration of the concept of ageing trajectories, specifically brain ageing. With increasing age, even healthy people are at higher risk of cognitive impairment and brain diseases, eventually reaching a threshold where symptoms appear. Individuals can differ in their brain-ageing trajectories. For example, a person may have genetic or developmental environmental factors that confer a higher rate of ageing throughout life (blue line). Alternatively, someone may experience a traumatic injury or infection in adulthood (black arrow), which results in them following an accelerated (purple line) or accentuated, but stable (yellow line), trajectory of brain ageing. While the example used here is of brain ageing, the same model can be used to conceptualise biological ageing more generally
Fig. 2
Fig. 2
Brain-predicted age and brain-PAD. a The results of using Gaussian processes regression to predict chronological age using structural neuroimaging data in a sample of 2001 healthy individuals, aged 18–90 years, based on ten-fold cross validation (mean absolute error = 4.93 years, r = 0.94). b Same as a, with the brain-predicted age values for participants from the Lothian Birth Cohort 1936 overlaid in red. This demonstrates that, despite the narrow age range at time of scanning (72–74 years), these N = 669 individuals had a wide variability in brain-predicted ages. c Illustration of how brain-predicted age difference (brain-PAD) scores are calculated, highlighting the individuals from the Lothian Birth Cohort 1936 with the lowest and highest brain-predicted ages. Brain-PAD is the difference between brain-predicted age and chronological age for an individual. Positive brain-PAD suggests that the individual’s brain appears older than their chronological age, whereas a negative brain-PAD suggests that their brain appears younger
Fig. 3
Fig. 3
Survival curves based on high and low brain-PAD at age approximately 73 years. Illustration of the relationship between brain-predicted age difference (brain-PAD) and survival over 8 years after MRI scanning at a mean age of 73 years in the Lothian Birth Cohort 1936 [32]. Kaplan–Meier plot shows the survival curves for individuals grouped according to whether their brain-PAD was in the upper (red) or lower (blue) quartile of the distribution. Survival probably is observed to be lower for those with high brain-PAD. Crosses on the survival curves indicate age at last assessment (i.e., right censored data). These are for illustration only; the analyses were conducted with all-available participants’ data, and brain-PAD was entered as a continuous variable

References

    1. Lopez-Otin C, Blasco MA, Partridge L, Serrano M, Kroemer G. The hallmarks of aging. Cell. 2013;153:1194–217. - PMC - PubMed
    1. Harman D. Aging: overview. Ann N Y Acad Sci. 2001;928:1–21. - PubMed
    1. Baker GT, 3rd, Sprott RL. Biomarkers of aging. Exp Gerontol. 1988;23:223–39. - PubMed
    1. Terry RD, DeTeresa R, Hansen LA. Neocortical cell counts in normal human adult aging. Ann Neurol. 1987;21:530–9. - PubMed
    1. Fjell AM, Westlye LT, Grydeland H, Amlien I, Espeseth T, Reinvang I, et al. Accelerating cortical thinning: unique to dementia or universal in aging? Cereb Cortex. 2014;24:919–34. - PMC - PubMed

Publication types