. 2018 Jul;24(7):1047-1057.
doi: 10.1038/s41591-018-0019-5. Epub 2018 Jun 11.

Mutations in the SWI/SNF complex induce a targetable dependence on oxidative phosphorylation in lung cancer

Affiliations

Mutations in the SWI/SNF complex induce a targetable dependence on oxidative phosphorylation in lung cancer

Yonathan Lissanu Deribe et al. Nat Med. 2018 Jul.

Erratum in

Abstract

Lung cancer is a devastating disease that remains a top cause of cancer mortality. Despite improvements with targeted and immunotherapies, the majority of patients with lung cancer lack effective therapies, underscoring the need for additional treatment approaches. Genomic studies have identified frequent alterations in components of the SWI/SNF chromatin remodeling complex including SMARCA4 and ARID1A. To understand the mechanisms of tumorigenesis driven by mutations in this complex, we developed a genetically engineered mouse model of lung adenocarcinoma by ablating Smarca4 in the lung epithelium. We demonstrate that Smarca4 acts as a bona fide tumor suppressor and cooperates with p53 loss and Kras activation. Gene expression analyses revealed the signature of enhanced oxidative phosphorylation (OXPHOS) in SMARCA4 mutant tumors. We further show that SMARCA4 mutant cells have enhanced oxygen consumption and increased respiratory capacity. Importantly, SMARCA4 mutant lung cancer cell lines and xenograft tumors have marked sensitivity to inhibition of OXPHOS by a novel small molecule, IACS-010759, that is under clinical development. Mechanistically, we show that SMARCA4-deficient cells have a blunted transcriptional response to energy stress creating a therapeutically exploitable synthetic lethal interaction. These findings provide the mechanistic basis for further development of OXPHOS inhibitors as therapeutics against SWI/SNF mutant tumors.


Figures
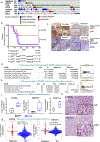
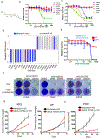
Figure 1.
Figure 1.. Smarca4 deficient GEMM tumors and SWI/SNF deficient human lung adenocarcinoma have enrichment of OXPHOS pathway.
a, Oncoprint plot showing the genomic profiles of SMARCA4, ARID1A and other lung cancer relevant genes, data compiled from the cBioportal, based on original data from TCGA lung adenocarcinoma project. b, Kaplan-Meier survival curve of GEM models showing increased penetrance of KPS model (KrasLSLG12D/WT, p53fl/fl, Smarca4fl/fl) compared to KP model (KrasLSLG12D/WT, p53fl/fl), 95% CI 1.03 to 7.33 and the non-tumorigenic Smarca4fl/fl cohort, 95% CI 0.0028 to 0.0638. p-values calculated using Log-rank (Mantel-Cox test). Both male and female mice are used. c, Immunohistochemistry of KP and KPS tumors indicating positive staining for pro-surfactant protein C (pro-Spc) in both KP and KPS. While heterogenous, SMARCA4 signal is primarily lost in KPS tumors. Scale bar represents 500μM in primary images and 100 μM in insets. Experiments repeated four times on independent tumor tissues. d, Top enriched pathways in KPS tumors compared to KP tumors based on gene-set enrichment analysis (GSEA) on RNA-seq data generated (n=4 independent tumors for each cohort). e, Top enriched pathways in ARID1A and SMARCA4 mutated human lung adenocarcinoma tumors revealed by GSEA analysis of TCGA RNA-seq data. n=445 for “WT” and n=70 for ARID1A and SMARCA4 mutated tumors. f, log2 normalized expression data showing representative OXPHOS genes, ATP5L, GSTO7 and PGC1α elevated in KPS tumors. Box-plots representation: from top to bottom: maximum value, 75th percentile, median, 25th percentile and minimum values. n=4 independent tumors. g, log2 normalized RNA-Seq data show ATP5L and GSTO1 are elevated in SWI/SNF mutant human lung adenocarcinoma tumors. WT, n= 445, SWI/SNF mutated n= 70 independent tumors. p-values computed using two-sided Wilcoxon rank-sum test and adjusted for multiple hypothesis testing. Box-plots representation: from top to bottom: maximum value, 75th percentile, median, 25th percentile and minimum values. h, Immunohistochemical staining on tumor tissues using PGC1α antibody indicates elevated levels in KPS tumors. Scale bar represents 100μM in primary images and 20μM in insets. Experiments repeated three times on independent tumor tissues.
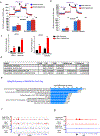
Figure 2:
Figure 2:. SMARCA4 deficient cells have increased mitochondrial respiration.
a, PGC1α is selectively required for growth of SMARCA4 deficient cells (left panel) as demonstrated by knockdown using two shRNAs (right panel) and rescue by SMARCA4 expression but not by GFP. Experiment repeated three times. b, Plot of mitochondrial DNA content comparison between SWI/SNF deficient and proficient TCGA lung adenocarcinoma tumors based on mitochondrial DNA content across 12 tumor types. p-values computed using two-sided Wilcoxon rank-sum test. Box-plots representation: from top to bottom: maximum value, 75th percentile, median, 25th percentile and minimum values. c, mitochondrial DNA content in KPS and KP tumors (each n=5 independent tumors). Genomic DNA qRT-PCR based quantification of mitochondrial genome using beta-actin as a control for nuclear genome abundance. Bar graphs show mean and error bars denote s.d, p-value computed using a two-tailed Student’s t-test. ** denotes significant p-value (p=0.0036). d, Cropped immunoblot showing inducible expression of SMARCA4 in SMARCA4 deficient human lung cancer cell lines by administration of doxycycline (0.5μg/ml) with GFP as control. Experiment repeated three times and uncropped images available in Supplementary Fig. 11–1. e, Oxygen consumption rate (OCR) and extracellular media acidification rate (ECAR) were measured for each of the cell lines using the XF-96 analyzer and ratio computed. Plots show mean values from 8-wells (from 2 experiments) compared by two-sided Student’s t-test. *** indicate p-values <0.0001. f, A representative trace of OCR values (mean +/− s.d) from a mitochondrial stress test using XF-96 analyzer showing KP-derived cell line (red) and KPS-derived cell line (blue) from which g, basal respiration and spare respiratory capacity were computed. A two-sided Student’s t-test computed. *** indicate p-values <0.0001. Graphs indicate mean and error bars denote s.d from 8 wells (from 2 experiments). h, proton leak and ATP production were computed from f and two-sided Student’s t-test computed. *** indicate p-values <0.0001, ** indicates p-value=0.0073. Graphs indicate mean and error bars denote s.d from 8 wells (from 2 experiments). i, A representative trace of OCR values (mean +/− s.d) of mitochondrial stress test using XF-96 analyzer showing H1299 parental (blue) and H1299 cell line reconstituted with SMARCA4 (red) from which j, basal respiration and spare respiratory capacity were computed. A two-sided Student’s t-test computed. *** indicate p-values <0.0001 and ** indicates p=0.02 Graphs indicate mean and error bars denote s.d from 8 wells (from 2 experiments). k, proton leak and ATP production were computed from i. Graphs indicate mean and error bars denote s.d. from 8 wells (from 2 experiments). A two-sided Student’s t-test computed. *** indicate p-values <0.0001
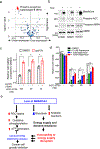
Figure 3.
Figure 3.. SWI/SNF mutant lung cancer cells are sensitive to inhibition of OXPHOS
a, Chemical structure of IACS-010759. b & c, CellTitre-Glo viability assays 3 days after administration of DMSO control or the indicated 8 doses of IACS-010759 across two different cohorts of 20 lung cancer cell lines repeated twice. Plots show mean and s.d. of three technical replicates. d, Waterfall plot of scaled GI50 values of 20 lung cancer cell lines to inhibition by IACS-010759 showing significantly more SWI/SNF mutants (blue) are sensitive than SWI/SNF wild type cells (gray), two-sided Student’s t-test for difference of means p=0.0059 e, CellTitre-Glo 4-day viability assay after administration of indicated 8 doses of IACS-010759 and DMSO control in KPS and KP-derived murine cell lines showing dramatic sensitivity of KPS cells (n=3 independent experiments for each). Plots represent mean and s.d at each data point. f, Cell viability rescue experiment with A549, H1299 and H2030 that were reconstituted with SMARCA4 in an inducible manner by addition of doxycycline in growth media (0.5μg/ml). IACS-010759 (10 or 100nM) or control DMSO was added to confluent plates, cells were incubated for 24–48 hours, fixed and were stained with crystal violet. Experiment was repeated two times. g, In vivo anti-tumor efficacy of IACS-010759 was assessed by treating Ncr-nude mice (n=15 mice per cohort) subcutaneously implanted with 100, 000 cells derived from KPS or KP tumors. IACS-010759 was administered by oral gavage at 7.5mg/kg in methylcellulose carrier once daily for for a total of three weeks. Tumor volume was monitored three times per week and plotted as mean +/− s.e.m. Vehicle is methylcellulose carrier alone. h, In vivo anti-tumor efficacy of IACS-010759 was assessed by treating NSG mice (n=10 mice per cohort) subcutaneously implanted with PDX model TC388. IACS-010759 was administered by oral gavage at 7.5mg/kg in methylcellulose carrier once daily for 7 days for a total of three weeks. Tumor volume was monitored three times per week and plotted as mean +/− s.e.m. Vehicle is methylcellulose carrier alone.
Figure 4.
Figure 4.. SMARCA4 is required for efficient transcriptional response to energy stress.
a, A representative trace of ECAR values (mean+/− s.d) from a glycolytic stress test using XF-96 analyzer and quantification showing reduced glycolysis and glycolytic capacity in SMARCA4 deficient H1299 cells. Bar graphs indicate mean and error bars denote s.d. from 8 wells (from 2 experiments). A two-sided Student’s t-test computed. *** indicate p-values <0.0001 b, A representative trace of ECAR values (mean+/− s.d) from a glycolytic stress test using XF-96 analyzer and quantification showing reduced glycolysis and glycolytic capacity in SMARCA4 deficient A549 cells. Bar graphs indicate mean and error bars denote s.d. from 8 wells (from 2 experiments). A two-sided Student’s t-test computed. *** indicate p-values <0.0001 and ** indicates p=0.0011 c, Left panel: mRNA expression of Hif2a by qPCR in H1299 parental and SMARCA4 reconstituted cell lines grown under regular growth media (RPMI-1640 with 1500mg/ml glucose, 10% FBS) or no glucose added media (RPMI-1640 -Glucose, 10% FBS). Results show significantly higher basal as well as induced Hif2a by glucose deprivation upon SMARCA4 expression. Graph shows mean +/− s.d, of HIF2A mRNA first normalized to GAPDH and then compared between the SMARCA4 deficient and proficient groups. ** P-value < 0.0001 by two-sided Student’s t-test, n=3 independent experiments. Right panel: mRNA expression of Hif2a by qPCR in H1299 parental and SMARCA4 reconstituted cell lines treated with DMSO control or 100nM IACS-010759 for 24 hours. Results show significantly higher basal as well as induced Hif2a by IACS-010759 upon SMARCA4 expression. ** P-value < 0.0001 by two-sided Student’s t-test. Graph shows mean +/− s.d, of HIF2A mRNA normalized to GAPDH. n=3 independent experiments d, GSEA analysis of microarray transcriptomic profiling revealed response to hypoxia and glycolysis as top pathways enriched in response to IACS-010759 treatment in SMARCA4 reconstituted cells, n=2 independently cell culture grown cells were profiled by microarray for each treatment condition (-Dox, +Dox each with DMSO control or IACS-010759 treatment) e, GREAT (Genomic Regions Enrichment of Annotations Tool) was used to perform gene set enrichment analysis on genomic regions occupied by SMARCA4 in H1299 cells stably expressing doxycycline inducible SMARCA4 vector. Cells were treated (+Dox) or not (-Dox) with doxycycline (0.5μg/ml) for 5 days to induce SMARCA4 expression and with 100nM IACS-10759 for 24 hours to induce energy stress, n=6,072 genomic regions were used to generate enrichment plot. f, Representative integrative genome viewer tracks of views of SMARCA4 ChIP-Seq peak on the HIF2A genomic locus and g, hexokinase 2 genomic locus in H1299 cells re-expressing SMARCA4. ChIP-Seq experiment was done once for the –Dox and +Dox pair independently.
Figure 5.
Figure 5.. SMARCA4 deficient cells and tumors have elevated bioenergetic requirement
a, Enrichment plot of reverse phase protein array (RPPA) data showing significantly reduced expression of pACC Ser79 (red arrow) in SWI/SNF mutant lung adenocarcinoma tumors (TCGA). Data compiled by cBioportal, n=181 independent tumors. Two-side t-test performed to derive the p-value. b, Cropped immunoblot showing markedly reduced phospho-ACC S79 signal from total cell lysates of control and SMARCA4 inducibly expressing H1299, H2030 and H2023 cells (induction of SMARCA4 expression by 0.5μg/ml of doxycycline). Experiment repeated three times and uncropped images available in Supplementary Fig.11–2. c, Viability assay of H1299 parental and SMARCA4 reconstituted cells treated with different doses of IACS-010759 (100, 30 or 10nM) alone or in combination with the fatty acid synthesis inhibitor Cpd-10V (10μM). Results were compared to DMSO control treated cells (set at 100%) and show partial rescue of growth inhibition at each dose by Cpd-10v. Graph represents mean +/− s.d, of n=4 independent cell culture grown and treated cells, Two-sided Student’s t-test used to derive p values. **p=0.0007, **p=0.0004 and **p=0.0011 for 100, 30 and 10nM groups respectively d, Viability assay of H1299 parental and SMARCA4 reconstituted cells treated with different doses of IACS-010759 (100, 30 or 10nM) alone or in combination with the mTOR inhibitor rapamycin (0.1, 1 or 10nM). Results were compared to DMSO treated cells (first black bar, set at 100%) and show significant rescue of growth inhibition in a dose dependent manner by rapamycin. Rapamycin alone did not affect cell growth compared to DMSO. Graph represents mean +/− s.d, of n=3 independent cell culture grown and treated cells, Two-sided Student’s t-test used to derive p values. ** for 10nM IACS-10759 group p<0.0001, p=0.007 and p<0.0001 for 0.1, 1 and 10nM rapamycin treated cells respectively. ** for 30nM IACS-10759 group p=0.06, p=0.0002 and p=0.0045 for 0.1, 1 and 10nM rapamycin treated cells respectively. ** for 100nM IACS-10759 group p<0.0001, p<0.0001 and p=0.0005 for 0.1, 1 and 10nM rapamycin treated cells respectively. e, A working model: SMARCA4 deficient tumors have an energy imbalance resulting from increased OXPHOS, decreased glycolysis and increased anabolic processes. The cumulative result is energy stress that creates an attractive therapeutic window to target OXPHOS.

References

    1. Cancer Genome Atlas Research, N. Comprehensive molecular profiling of lung adenocarcinoma. Nature 511, 543–550 (2014). - PMC - PubMed
    1. Kadoch C, et al. Proteomic and bioinformatic analysis of mammalian SWI/SNF complexes identifies extensive roles in human malignancy. Nat Genet 45, 592–601 (2013). - PMC - PubMed
    1. Wilson BG & Roberts CW SWI/SNF nucleosome remodellers and cancer. Nat Rev Cancer 11, 481–492 (2011). - PubMed
    1. Wilson BG, et al. Epigenetic antagonism between polycomb and SWI/SNF complexes during oncogenic transformation. Cancer Cell 18, 316–328 (2010). - PMC - PubMed
    1. Stanton BZ, et al. Smarca4 ATPase mutations disrupt direct eviction of PRC1 from chromatin. Nat Genet (2016). - PMC - PubMed

Publication types

MeSH terms

Substances