. 2018 Aug;24(8):1234-1245.
doi: 10.1038/s41591-018-0059-x. Epub 2018 Jun 11.

The human heart contains distinct macrophage subsets with divergent origins and functions

Affiliations

The human heart contains distinct macrophage subsets with divergent origins and functions

Geetika Bajpai et al. Nat Med. 2018 Aug.

Abstract

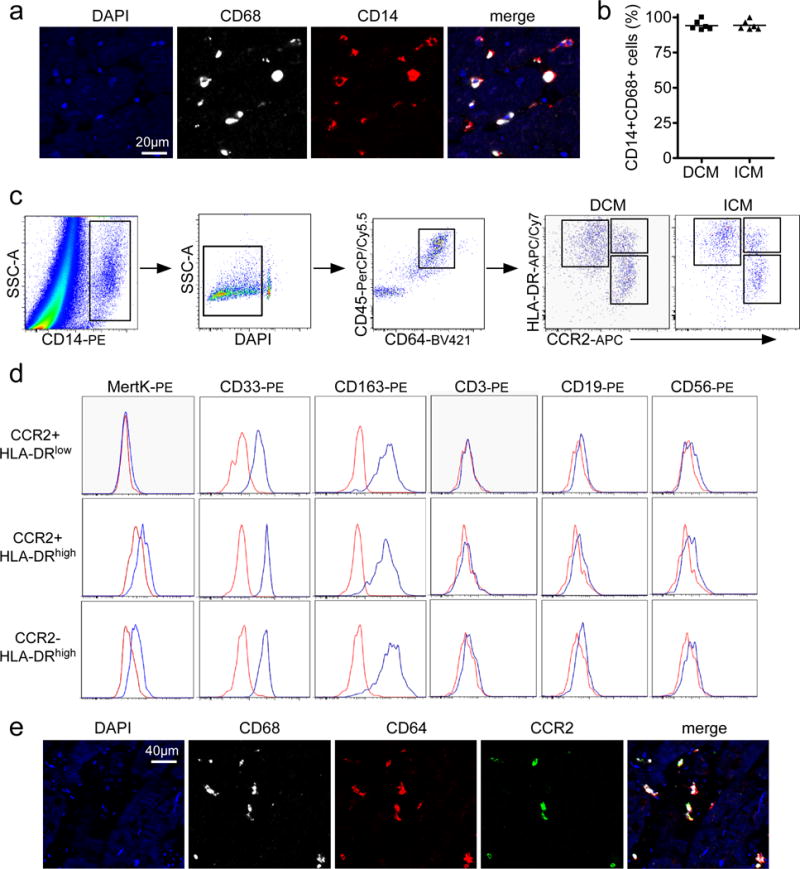
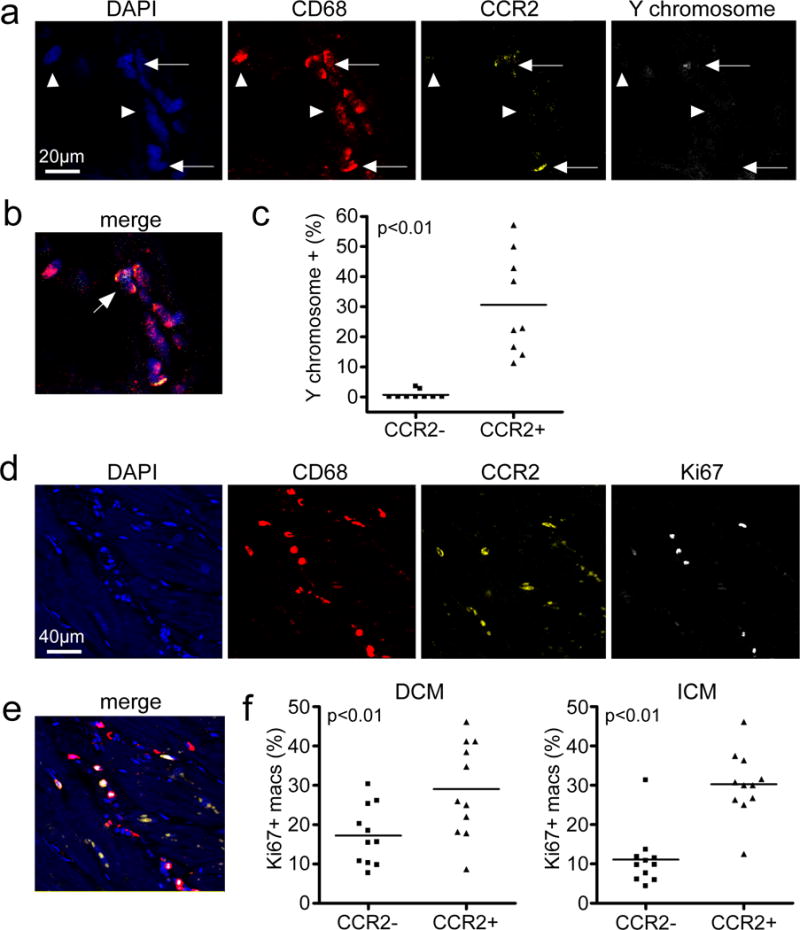
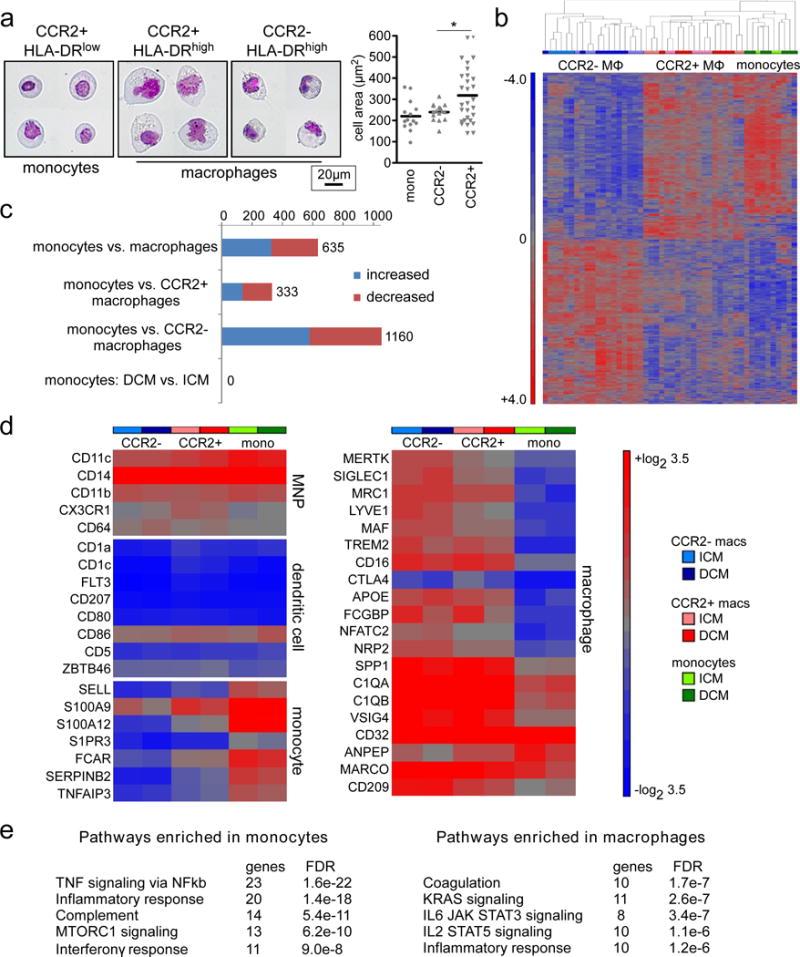
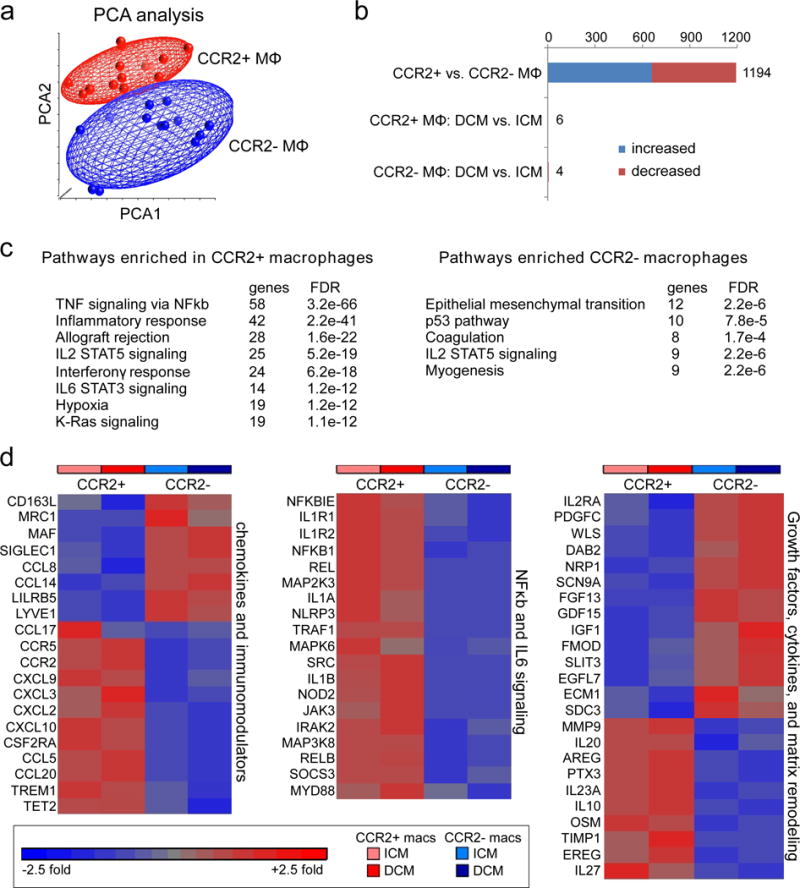
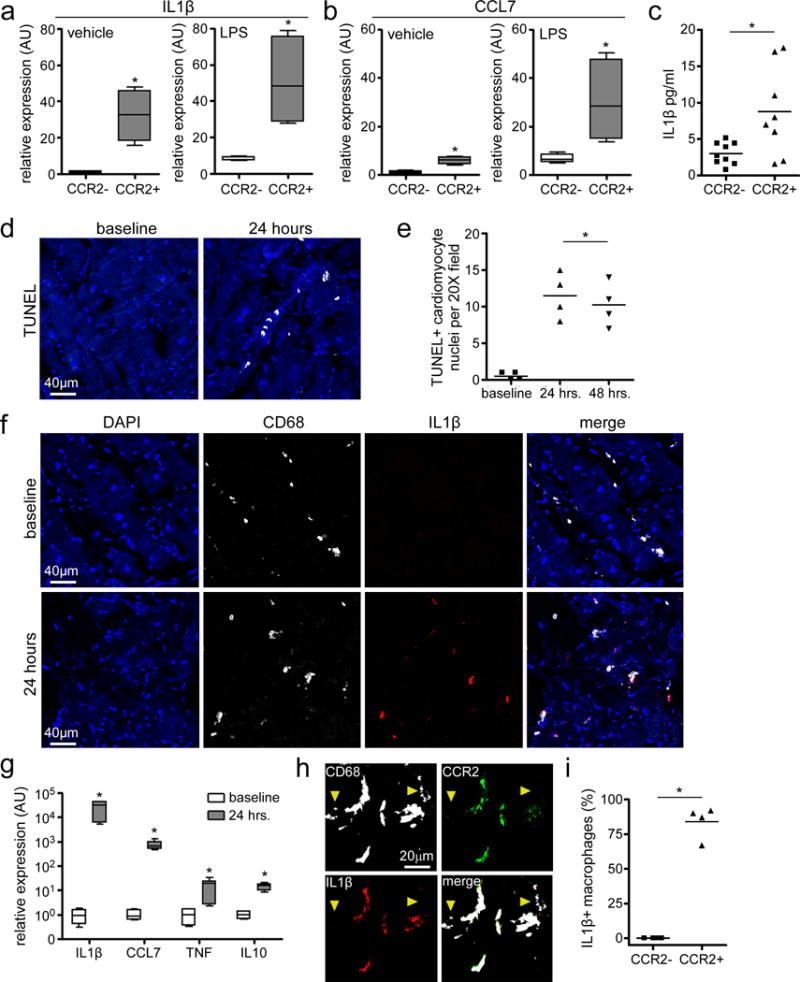
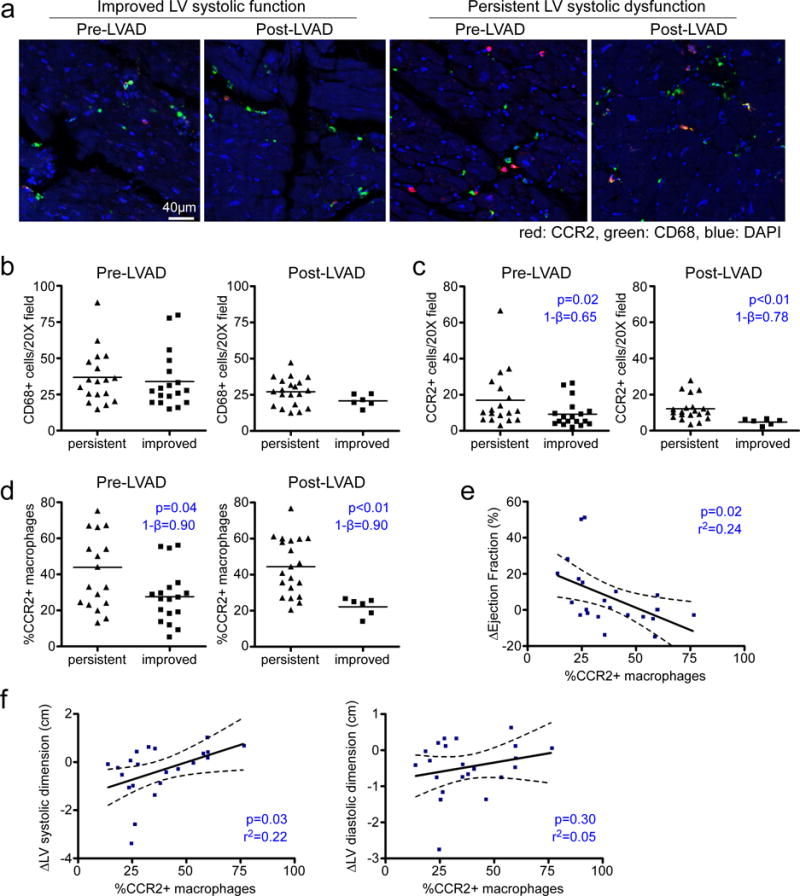
Paradigm-shifting studies in the mouse have identified tissue macrophage heterogeneity as a critical determinant of immune responses. In contrast, surprisingly little is known regarding macrophage heterogeneity in humans. Macrophages within the mouse heart are partitioned into CCR2- and CCR2+ subsets with divergent origins, repopulation mechanisms, and functions. Here, we demonstrate that the human myocardium also contains distinct subsets of CCR2- and CCR2+ macrophages. Analysis of sex-mismatched heart transplant recipients revealed that CCR2- macrophages are a tissue-resident population exclusively replenished through local proliferation, whereas CCR2+ macrophages are maintained through monocyte recruitment and proliferation. Moreover, CCR2- and CCR2+ macrophages have distinct functional properties, analogous to reparative CCR2- and inflammatory CCR2+ macrophages in the mouse heart. Clinically, CCR2+ macrophage abundance is associated with left ventricular remodeling and systolic function in heart failure patients. Collectively, these observations provide initial evidence for the functional importance of macrophage heterogeneity in the human heart.


Conflict of interest statement

Competing financial interests

The authors have no competing financial interests to disclose.

Figures

Figure 1
Figure 1. The human heart contains distinct populations of CCR2- and CCR2+ macrophages
a, Immunostaining of human cardiac macrophages (CD68, white) for CD14 (red). Blue: DAPI. b, Percentage of CD14+CD68+ cells in specimens obtained from patients with dilated (DCM) and ischemic (ICM) cardiomyopathy. Each data point (n=6) represents a biologically independent heart failure sample. The line indicates the mean value. c, Flow cytometry gating scheme utilized to identify and characterize cardiac macrophage populations. d, Flow cytometry plots showing expression of MertK (macrophage marker), CD33 and CD163 (monocyte/macrophage markers), CD3 (T-cell marker), CD19 (B-cell marker), and CD56 (NK cell marker) in CCR2+HLA-DRlow, CCR2-HLA-DRhigh, and CCR2+HLA-DRhigh cells. Red: isotype control, Blue: indicated antibody. e, Immunostaining for CD68 (white), CD64 (red), and CCR2 (green) indicates that both CCR2- and CCR2+ macrophages are present within the left ventricular myocardium. These experiments were independently repeated 3 times with similar results. Blue: DAPI. a: 400X magnification, e: 200X magnification.
Figure 2
Figure 2. CCR2- and CCR2+ cardiac macrophage populations are maintained through distinct mechanisms
a, In situ hybridization and immunostaining of endomyocardial biopsy specimens obtained from recipients of sex mismatch heart transplants (n=9). All specimens were obtained from male patients who had received a heart from a female donor >1 year prior to biopsy. DAPI (blue), CD68 (red), CCR2 (yellow), and Y chromosome (white). Arrows: CCR2+ macrophages, arrowheads: CCR2- macrophages. b, Merged image from a. 400X magnification. Arrow denotes CCR2+ macrophage containing a Y chromosome. c, Percentages of CCR2- and CCR2+ macrophages that contain a Y chromosome (n=9). Each data point represents a biologically independent biopsy specimen and the line refers to the mean value. Mann Whitney test (two-sided), p<0.0001. d, Cell proliferation of CCR2- and CCR2+ macrophages, as assessed by immunostaining for CD68 (red), CCR2 (yellow), and Ki67 (white). Each data point represents a biologically independent heart failure specimen and the line refers to the mean value. Mann Whitney test (two-sided): DCM, p=0.0036 and ICM, p=0.006. e, Merged image from d. 200X magnification. f, Percentage of CCR2- and CCR2+ macrophages (macs) staining for Ki67 in hearts from DCM (n=11) and ICM (n=11) patients.
Figure 3
Figure 3. Microarray gene expression profiling of CCR2+ monocytes, CCR2- macrophages, and CCR2+ macrophages in the failing human heart
a, Left, representative images of CCR2+HLA-DRlow monocytes (n=14), CCR2+HLA-DRhigh macrophages (n=16), and CCR2-HLA-DRhigh macrophages (n=29) isolated from 4 biologically independent failing hearts (ICM and DCM) using FACS. Wright staining, 800X magnification. Right, quantification of cell area. Asterisks denotes p<0.05. Each data point represents an individual cell and the line represents the median value. Mann Whitney test (two-sided) p=0.025. b, Hierarchical clustering highlighting the relationships among CCR2+ monocytes (n=10), CCR2- macrophages (n=19) and CCR2+ macrophages (n=19) in the failing heart (DCM, n=8 and ICM, n=11). Sample color scheme is identical to the legend in d. MΦ: macrophages. c, Bar graph displaying the number of differentially regulated genes, using a threshold of 2X fold change and FDR<0.05. Comparisons include both DCM and ICM samples except when otherwise indicated. Blue: increased expression, Red: decreased expression. d, Heat maps showing the absolute expression values of genes that are associated with human mononuclear phagocytes (MNPs), dendritic cells, monocytes, and macrophages. Data are shown for CCR2+ monocytes, CCR2- macrophages and CCR2+ macrophages obtained from specimens of patients with ICM or DCM and the results are displayed as average expression values. e, GSEA pathway analysis revealing pathways enriched in cardiac monocytes versus macrophages. Analysis combines ICM and DCM specimens. Statistical significance was evaluated using false discovery rate (FDR).
Figure 4
Figure 4. CCR2- and CCR2+ macrophages display distinct gene expression profiles
a, Principal component analysis of CCR2- (n=19) and CCR2+ (n=19) cardiac macrophages (ICM and DCM). Red: CCR2+ macrophages, Blue: CCR2- macrophages. b, Bar graph displaying the number of genes that were differentially expressed between all CCR2- and CCR2+ macrophages (DCM and ICM) and the number of genes that were differentially expressed in CCR2- and CCR2+ macrophages stratified by DCM and ICM designation using a threshold of 1.4X fold change and FDR<0.05. Blue: increased expression, Red: decreased expression. c, GSEA pathway analysis revealing pathways enriched in cardiac CCR2+ versus CCR2- macrophages (ICM and DCM). Statistical significance was evaluated using false discovery rate (FDR). d, Heat maps showing relative fold changes in genes associated with chemokine and immunomodulatory signaling, NFκb and IL6 signaling, as well as selected growth factors, cytokines, and extracellular matrix remodeling factors. Data are shown for CCR2+ and CCR2- macrophages obtained from specimens of patients with ICM or DCM and the results are displayed as average expression values. All genes displayed on the heat maps were differentially expressed (FDR<0.05) between CCR2+ and CCR2- macrophages.
Figure 5
Figure 5. CCR2+ cardiac macrophages represent an inflammatory population
a-b, IL1β (a) and CCL7/MCP3 (b) expression in CCR2- and CCR2+ macrophages treated with vehicle or LPS, as assessed by quantitative RT-PCR. Asterisks denote p<0.05 (Mann Whitney test, 2-sided) compared to CCR2- macrophages. n=3 independent experiments from 4 biologically independent heart failure specimens (DCM and ICM). Data displayed as box and whisker plots. The box denotes the 25th and 75th percentiles, the line indicates the median value, and the whiskers reflect the minimum and maximum values. c, IL1β secretion by cultured CCR2- and CCR2+ macrophages, as assessed by ELISA. Each data point represents a biologically independent replicate derived from 4 individual heart failure specimens (DCM and ICM). Line indicates the mean values. Asterisks denote p<0.05 (Mann Whitney test, 2-sided). d-e, Cardiomyocyte cell death in the human myocardial slice culture system. d, Representative images of TUNEL staining showing evidence of cardiomyocyte cell death after 24 hours of slice culture. e, Quantification of TUNEL staining at 24 and 48 hours of slice culture. Baseline refers to examination of myocardial tissue immediately after slice preparation. Asterisks denote p<0.05 (ANOVA) compared to baseline. Each data point (n=4) is derived from a biologically independent heart failure specimen (DCM and ICM) and lines denote mean values. f, Immunostaining for CD68 (white) and IL1β (red) showing induction of IL1β expression in macrophages after 24 hours of slice culture. g, IL1β, CCL7/MCP3, TNF, and IL10 mRNA expression after 24 hours of slice culture. Data displayed as box and whisker plots. The box denotes the 25th and 75th percentiles, the line indicates the median value, and the whiskers reflect the minimum and maximum values. Asterisks denote p<0.05 (Mann Whitney test) compared to baseline. n=3 independent experiments. h, Immunostaining for CD68 (white), CCR2 (green), and IL1b (red) indicates that IL1β is preferentially expressed in CCR2+ macrophages. Yellow arrowheads, CCR2- macrophages. i, Percentages of CCR2- and CCR2+ macrophages with detectable IL1β antibody staining. Each symbol refers to data derived from a biologically independent heart failure specimen and lines indicate mean values. Asterisks denotes p<0.05 (Mann Whitney test) d, f: 200X magnification. h: 400X magnification. Blue: DAPI.
Figure 6
Figure 6. Macrophage subpopulations are associated with outcome following mechanical unloading
a, Immunostaining for CD68 (green) and CCR2 (red) in myocardial tissue specimens obtained from heart failure patients at the time of left ventricular assist device placement (pre-LVAD) and at the time of transplant (post-LVAD). Patients were stratified into those who displayed persistent LV systolic dysfunction (n=17) and those who displayed improved LV systolic function (n=18). Blue: DAPI, 200X magnification. b-c, Numbers of total (CD68+) (b) and CCR2+ (c) macrophages in pre-LVAD and post-LVAD specimens. Mann Whitney test (two-sided): CD68+ pre-LVAD, p=0.40 and CD68+ post-LVAD, p=0.16. d, Percentage of CCR2+ macrophages in pre-LVAD and post-LVAD. All data points represent biologically independent specimens and the lines indicate mean values. Asterisks indicate statistically significant p-values using Matt Whitney test (two-sided). e-f, Linear regression analysis for the association of the percentage of CCR2 macrophages and absolute changes in EF (e) and LV systolic dimension (f) over time. Dashed lines indicate 95% confidence intervals. Asterisks denotes p<0.05. 1-β denotes statistical power. Each data point (n=22) represents a biologically independent sample.

Comment in

References

    1. Van Furth R, Cohn ZA. The origin and kinetics of mononuclear phagocytes. J Exp Med. 1968;128:415–435. - PMC - PubMed
    1. Volkman A, Chang NC, Strausbauch PH, Morahan PS. Differential effects of chronic monocyte depletion on macrophage populations. Lab Invest. 1983;49:291–298. - PubMed
    1. Sawyer RT, Strausbauch PH, Volkman A. Resident macrophage proliferation in mice depleted of blood monocytes by strontium-89. Lab Invest. 1982;46:165–170. - PubMed
    1. Ginhoux F, et al. Fate mapping analysis reveals that adult microglia derive from primitive macrophages. Science. 2010;330:841–845. - PMC - PubMed
    1. Schulz C, et al. A lineage of myeloid cells independent of Myb and hematopoietic stem cells. Science. 2012;336:86–90. - PubMed

Publication types

Substances