. 2018 Jul;24(7):931-938.
doi: 10.1038/s41591-018-0051-5. Epub 2018 Jun 11.

Block of A1 astrocyte conversion by microglia is neuroprotective in models of Parkinson's disease

Affiliations

Block of A1 astrocyte conversion by microglia is neuroprotective in models of Parkinson's disease

Seung Pil Yun et al. Nat Med. 2018 Jul.

Abstract

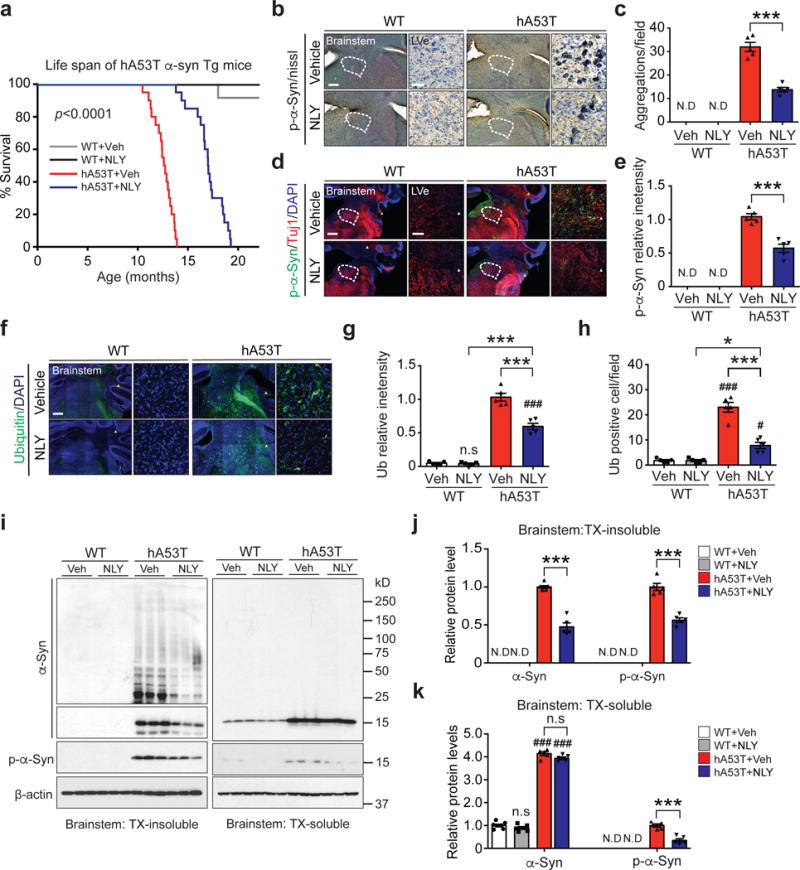
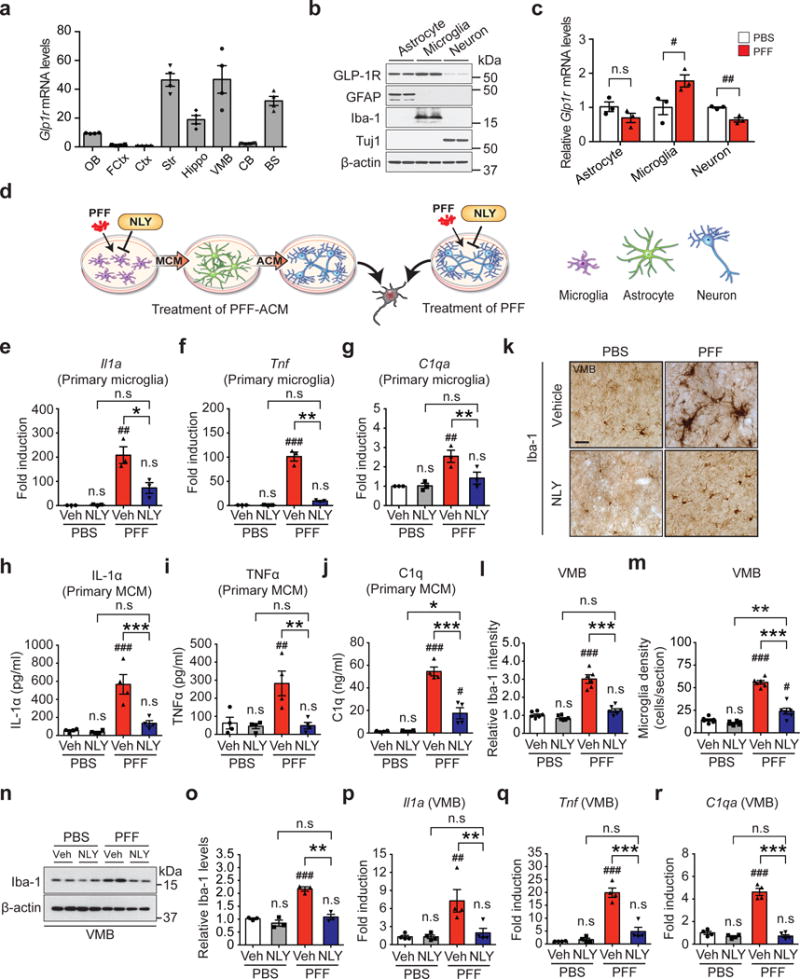
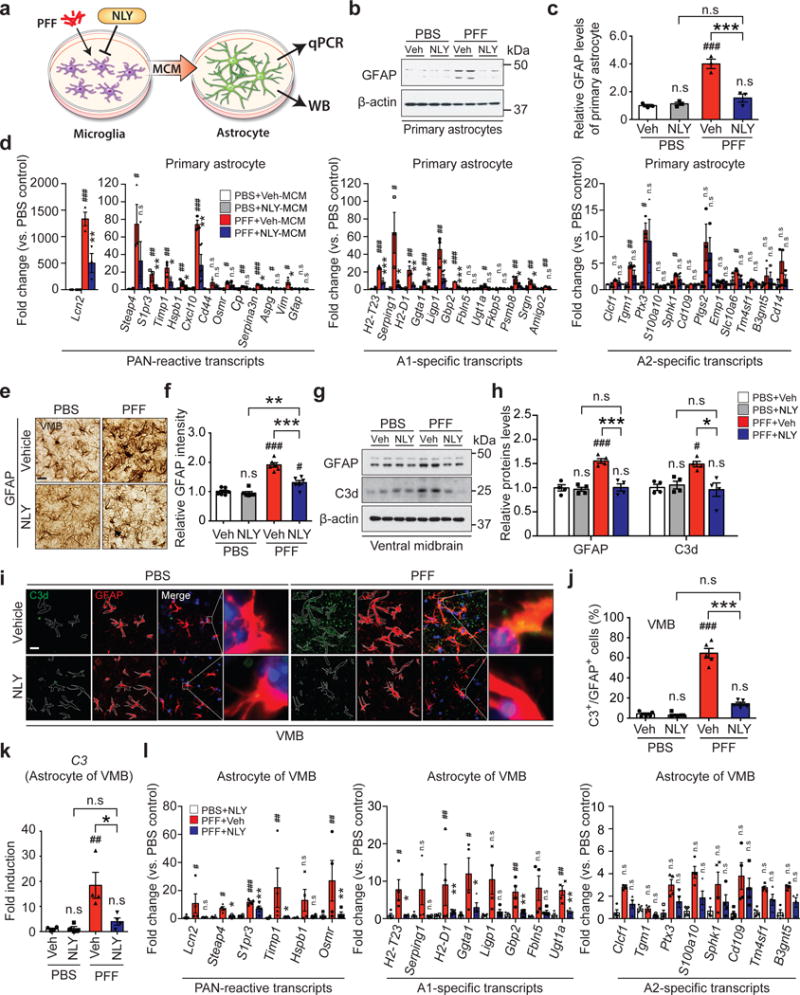
Activation of microglia by classical inflammatory mediators can convert astrocytes into a neurotoxic A1 phenotype in a variety of neurological diseases1,2. Development of agents that could inhibit the formation of A1 reactive astrocytes could be used to treat these diseases for which there are no disease-modifying therapies. Glucagon-like peptide-1 receptor (GLP1R) agonists have been indicated as potential neuroprotective agents for neurologic disorders such as Alzheimer's disease and Parkinson's disease3-13. The mechanisms by which GLP1R agonists are neuroprotective are not known. Here we show that a potent, brain-penetrant long-acting GLP1R agonist, NLY01, protects against the loss of dopaminergic neurons and behavioral deficits in the α-synuclein preformed fibril (α-syn PFF) mouse model of sporadic Parkinson's disease14,15. NLY01 also prolongs the life and reduces the behavioral deficits and neuropathological abnormalities in the human A53T α-synuclein (hA53T) transgenic mouse model of α-synucleinopathy-induced neurodegeneration16. We found that NLY01 is a potent GLP1R agonist with favorable properties that is neuroprotective through the direct prevention of microglial-mediated conversion of astrocytes to an A1 neurotoxic phenotype. In light of its favorable properties, NLY01 should be evaluated in the treatment of Parkinson's disease and related neurologic disorders characterized by microglial activation.


Conflict of interest statement

Competing financial Interests Statement

Z.M., V.L.D., S.L., T.M.D., H.S.K are co-founders of Neuraly Inc. and hold ownership equity in the company. This arrangement has been reviewed and approved by the Johns Hopkins University in accordance with its conflict of interest policies. V.V.R. is the CSO of Neuraly Inc.

Figures

Figure 1
Figure 1
α-syn PFF-induced PD like pathology is rescued by NLY01. (a) Schematic diagram of the α-syn PFF experimental design. (b) Representative double-immunostaining for p-α-synser129 (p-α-syn) (green) and TH (red) in the SNpc. White arrows point to DA neuron loss. Low power images were generated by the tile scan algorithm in the Zen software (n=6, biologically independent animals). Scale bar, 100 μm or 10 μm, respectively. (c) Percentage of TH neurons with p-α-synser129 positive inclusion in the SNpc region. Error bars represent the mean ± S.E.M. (n=6, biologically independent animals, p value = 0.0007). Unpaired two-tailed Student’s test were used for statistical analysis. (d) Representative photomicrographs from coronal mesencephalon sections containing TH-positive neurons in the SNpc region (n=10, biologically independent animals). Scale bar, 500 μm. (e) Unbiased stereologic counts of TH and (f) Nissl-positive neurons in the SNpc region. Error bars represent the mean ± S.E.M. (n=10, biologically independent animals). (g) HPLC assessment of DA concentrations in the striatum of PBS and α-syn PFF stereotaxic injected mice that were treated with vehicle or NLY01. Error bars represent the mean ± S.E.M. (n=5, biologically independent animals). (h-i) Behavioral tests after PBS or α-syn PFF stereotaxic intrastriatal injection at six-months in vehicle or NLY01 treated mice. (h) Amphetamine rotation test, and (i) pole test. Error bars represent the mean ± S.E.M. (n=12 PBS with vehicle, n=13 PBS with NLY01, n=14 α-syn PFF with vehicle, and n=11 α-syn PFF with NLY01, biologically independent animals). Two-way ANOVA was used for statistical analysis followed by Tukey’s multiple comparisons test. #P < 0.05, ##P < 0.01, ###P < 0.001 vs. PBS stereotaxic injected mice with vehicle; *P < 0.05, **P < 0.01, ***P < 0.001 vs. α-syn PFF stereotaxic injected mice with NLY01. Maximum time to climb down the pole was limited to 60 sec.
Figure 2
Figure 2
NLY01 reduces the pathology in the hA53T α-syn transgenic mice. (a) Kaplan-Meier survival curves of littermate wild type (WT) and hA53T α-syn Tg mice treated with vehicle or NLY01 (3 mg/kg, n=20, biologically independent animals, p value < 0.0001). Statistical analysis for the survival curves were performed by Log-rank (Mantel-Cox) test. (b, d) Representative p-α-synser129 (p-α-syn) immunohistochemistry and immunostaining (red) in the lateral vestibular nucleus (LVe) of the brainstem (n=5, biologically independent animals). Low power images were generated by the tile scan algorithm in the Zen software. White arrow head (tile image line). Scale bar, 200 μm or 25 μm, respectively. (c, e) Quantification of LVe neurons containing p-α-synser129 positive-immunoreactivity inclusions. Error bars represent the mean ± S.E.M. (n=5, biologically independent animals, p value < 0.0001 for panel c and p value = 0.0003 for panel e). (f) Representative ubiquitin immunostaining (green) in the LVe (n=5, biologically independent animals). Scale bar, 200 μm or 25 μm. (g, h) Quantification of LVe neurons that are ubiquitin-positive. Error bars represent the mean ± S.E.M (n=5, biologically independent animals). (i) Representative immunoblots of α-syn, p-α-synser129 and β-actin in detergent (Triton-X100) insoluble fractions and detergent soluble fractions of the brainstem from ten-month-old WT and hA53T α-syn Tg mice treated with vehicle or NLY01 for four months (cropped blot images are shown, see Supplementary Fig. 21 for full immunoblots). (j) Quantification of α-syn monomer, aggregation, and p-α-synser129 protein levels in detergent insoluble fractions normalized to β-actin. Error bars represent the mean ± S.E.M. (n=5, biologically independent animals, p value < 0.0001). (k) Quantification of α-syn monomer and p-α-synser129 protein levels in detergent soluble fractions normalized to β-actin. Error bars represent the mean ± S.E.M. (n=5, biologically independent animals, α-syn, p value < 0.0001 and p-α-syn, p value = 0.0002). Unpaired two-tailed Student’s test or two-way ANOVA was used for statistical analysis followed by Tukey’s multiple comparisons test. #P < 0.05, ###P < 0.001 vs. WT with vehicle; *P < 0.05, ***P < 0.001 vs. hA53T α-syn Tg with NLY01.
Figure 3
Figure 3
Inhibition of α-syn PFF-induced microglial activation by NLY01. (a) Glp1r mRNA expression was analyzed in various mouse brain regions. OB, olfactory bulb; FCtx, frontal cortex; Ctx, cerebral cortex; Str, striatum; Hippo, hippocampus; VMB, ventral midbrain; CB, cerebellum; BS, brainstem. Error bars represent the mean ± S.E.M. (n=4, biologically independent animals). (b) Predominant expression of GLP-1R in astrocytes and microglia. Mouse primary astrocytes (GFAP), microglia (Iba-1) and cortical neurons (Tuj1) were subjected to western blotting using GLP-1R antibody (cropped blot images are shown, see Supplementary Fig. 21 for full immunoblots). β-actin is provided as a loading control (n=3, biologically independent primary cells). (c) The Glp1r mRNA expression in α-syn PFF-activated primary cultured astrocyte, microglia, and neurons was analyzed by real-time RT-PCR. Bars represent the mean ± S.E.M. (n=3, biologically independent primary cells, primary microglia, p value = 0.0475 and primary cortical neuron, p value = 0.0045). (d) Schematic diagram showing treatment of α-syn PFF-astrocyte conditioned medium (ACM) or direct treatment of α-syn PFF into neurons. (e-g) Quantitative PCR analysis of NLY01 (1 μM) pretreatment on α-syn PFF-induced (1 μg/ml) microglial activation markers, (e) Il1a, (f), Tnfα, and (g) C1qa. Bars represent the mean ± S.E.M. (n=3, biologically independent primary microglia). (h-j) Cytokine analysis of α-syn PFF-activated microglia-conditioned medium (MCM) 18 hrs after α-syn PFF treatment by ELISA. NLY01 (1 μM) pretreatment prevented the increase of (h) IL-1α, (i) TNFα, and (j) C1q. Bars represent the mean ± S.E.M. (n=4, biologically independent primary microglia-conditioned medium). (k-m) Inhibition of α-syn PFF-induced microglial activation by NLY01 in vivo. (k) Representative immunohistochemical images of Iba-1. Scale bar, 50 μm. (l) Intensity of Iba-1 positive signals in the SNpc, (m) Quantification of Iba-1 positive cell number in the SNpc. Bars represent the mean ± S.E.M. (n=6, biologically independent animals). (n) Representative immunoblots of Iba-1 and β-actin in the ventral midbrain of PBS and α-syn PFF injected mice treated with vehicle or NLY01 (cropped blot images are shown, see Supplementary Fig. 21 for full immunoblots). (o) Quantification of Iba-1 levels in ventral midbrain normalized to β-actin. Bars represent the mean ± S.E.M. (n=3, biologically independent animals). (p-r) Quantitative PCR for (p) Il1a (q) Tnfα, and (r) C1qa in the ventral midbrain of α-syn PFF injected mice. Bars represent the mean ± S.E.M. (n=4, biologically independent animals). Unpaired two-tailed Student’s test or two-way ANOVA was used for statistical analysis followed by Tukey’s multiple comparisons test. #P < 0.05, ##P < 0.01, ###P < 0.001 vs. PBS with vehicle; *P < 0.05, **P < 0.01, ***P < 0.001 vs. or α-syn PFF with NLY01.
Figure 4
Figure 4
Inhibition of α-syn PFF-induced A1 reactive astrocytes by NLY01. (a) Schematic diagram showing the collection of astrocyte samples after treatment with MCM of α-syn PFF with or without NLY01 treated microglia. (b) Representative immunoblots of GFAP in primary astrocytes treated with α-syn PFF-MCM with vehicle or NLY01 (1 μM) (cropped blot images are shown, see Supplementary Fig. 21 for full immunoblots). (c) Quantification of GFAP levels. Bars represent the mean ± S.E.M. (n=3, biologically independent primary astrocytes). (d) Inhibition of α-syn PFF-induced A1 reactive astrocytes by NLY01 in purified primary astrocytes. Bars represent the mean ± S.E.M. (n=3, biologically independent primary astrocytes). (e, f) Inhibition of α-syn PFF-induced A1 reactive astrocytes by NLY01 in vivo. (e) Representative images of immunohistochemistry and (f) quantification of GFAP. Bars represent the mean ± S.E.M. (n=6, biologically independent animals). Scale bar, 50 μm. (g) Representative immunoblots of GFAP in the ventral midbrain region (cropped blot images are shown, see Supplementary Fig. 21 for full immunoblots). (h) Quantification of GFAP levels. Bars represent the mean ± S.E.M (n=4, biologically independent animals). (i) Co-localization of C3d and GFAP as assessed by confocal microscopy. Scale bar, 10 μm. (j) Percentage of GFAP positive cells that are C3d positive in the SNpc region. Bars represent the mean ± S.E.M. (n=5, biologically independent animals). (k) Increase in expression of C3 transcripts, which is prevented by NLY01 treatment in α-syn PFF injected mice. Bars represent the mean ± S.E.M. (n=4, biologically independent animals). (l) Quantitative PCR analysis of purified astrocytes from the ventral midbrain of α-syn PFF injected mice with vehicle or NLY01. Bars represent the mean ± S.E.M. (n=4, biologically independent animals). Two-way ANOVA was used for statistical analysis followed by Tukey’s multiple comparisons test. #P < 0.05, ##P < 0.01, ###P < 0.001 vs. PBS with vehicle; *P < 0.05, **P < 0.01, ***P < 0.001 vs. α-syn PFF with NLY01 or with Veh. n.s, not significant.

Comment in

References

    1. Liddelow SA, Barres BA. Reactive Astrocytes: Production, Function, and Therapeutic Potential. Immunity. 2017;46:957–967. - PubMed
    1. Liddelow SA, et al. Neurotoxic reactive astrocytes are induced by activated microglia. Nature. 2017;541:481–487. - PMC - PubMed
    1. Athauda D, Foltynie T. The glucagon-like peptide 1 (GLP) receptor as a therapeutic target in Parkinson’s disease: mechanisms of action. Drug Discov Today. 2016;21:802–818. - PubMed
    1. Aviles-Olmos I, et al. Exenatide and the treatment of patients with Parkinson’s disease. J Clin Invest. 2013;123:2730–2736. - PMC - PubMed
    1. Chen S, et al. Glucagon-like peptide-1 protects hippocampal neurons against advanced glycation end product-induced tau hyperphosphorylation. Neuroscience. 2014;256:137–146. - PubMed

Publication types

LinkOut - more resources