. 2018 Aug;24(8):1225-1233.
doi: 10.1038/s41591-018-0046-2. Epub 2018 Jun 11.

Suppression of detyrosinated microtubules improves cardiomyocyte function in human heart failure

Affiliations

Suppression of detyrosinated microtubules improves cardiomyocyte function in human heart failure

Christina Yingxian Chen et al. Nat Med. 2018 Aug.

Abstract

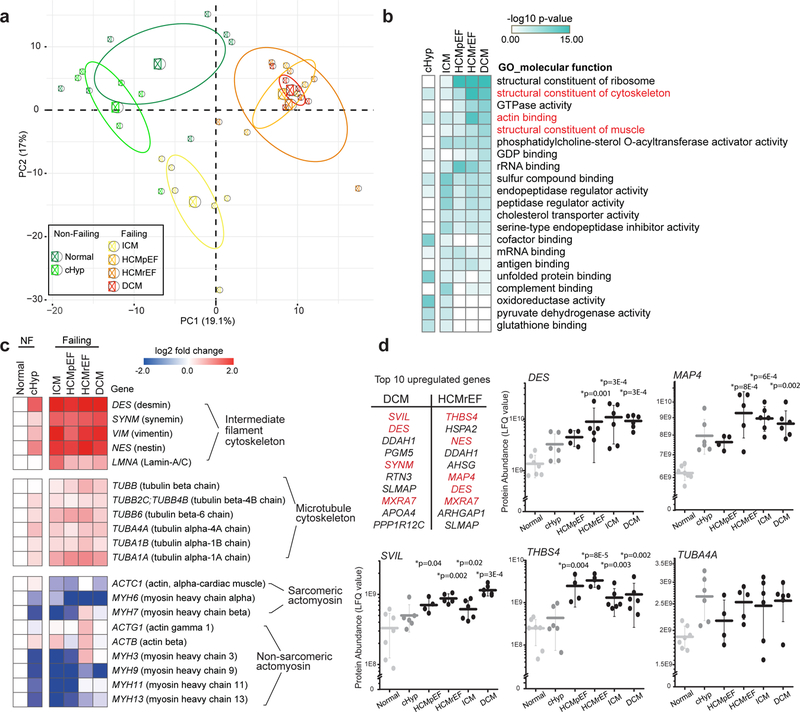
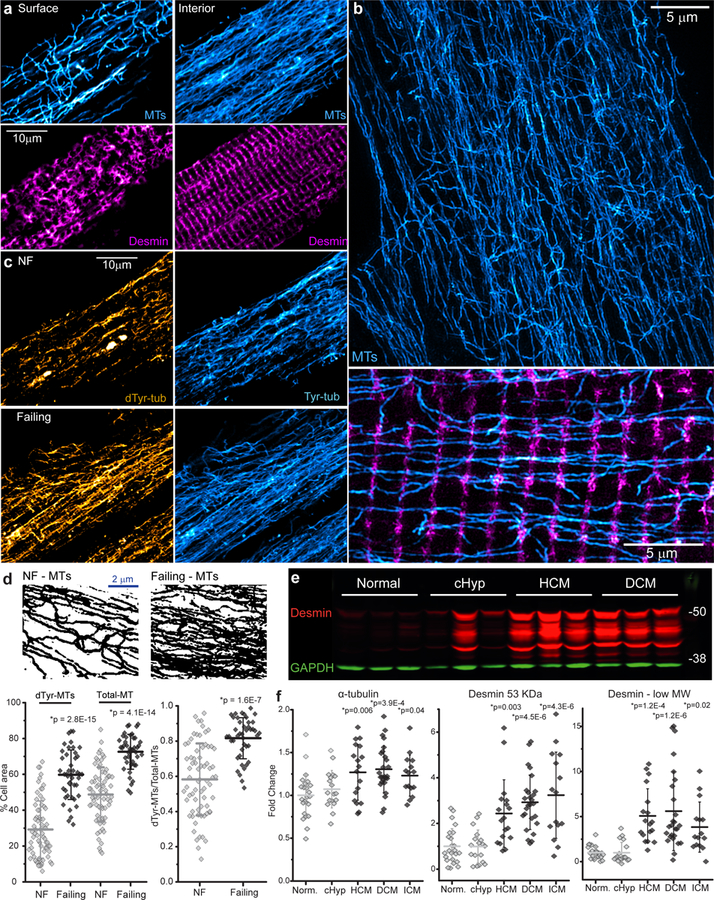
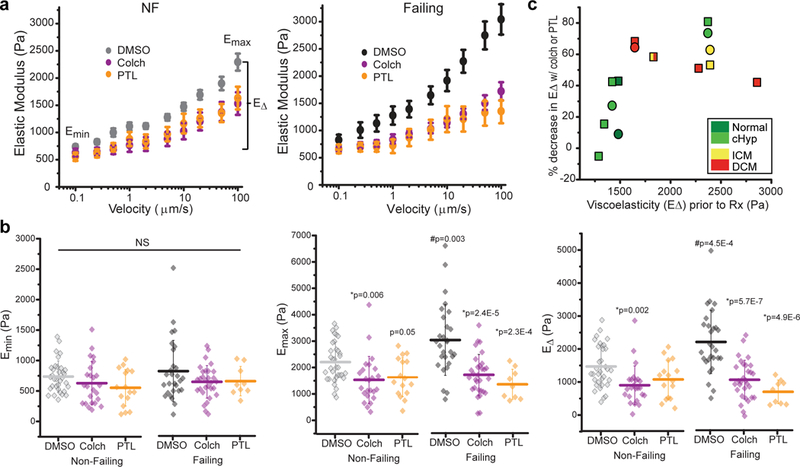
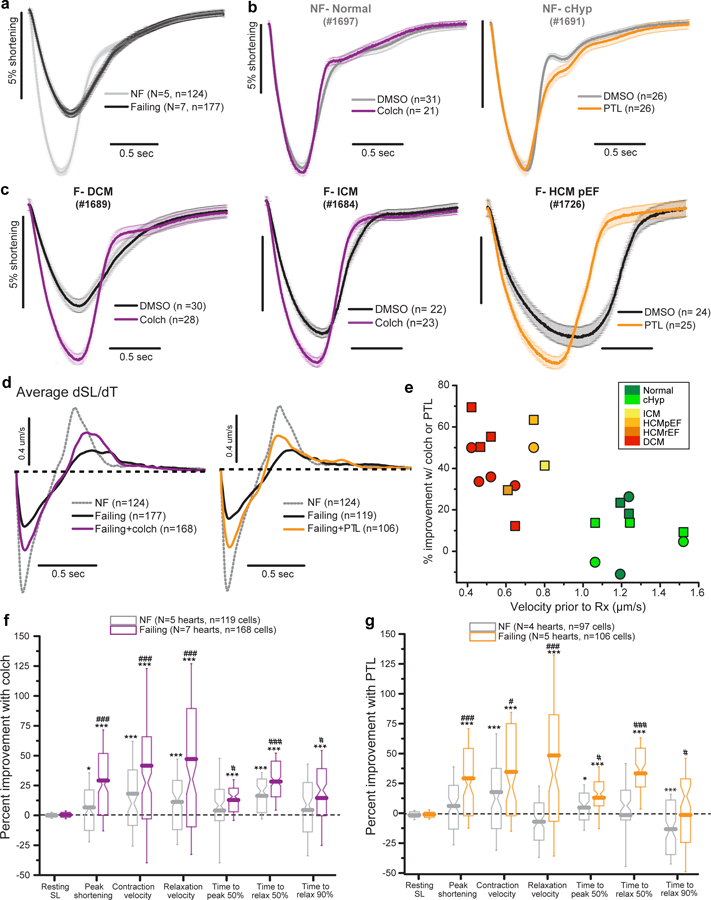
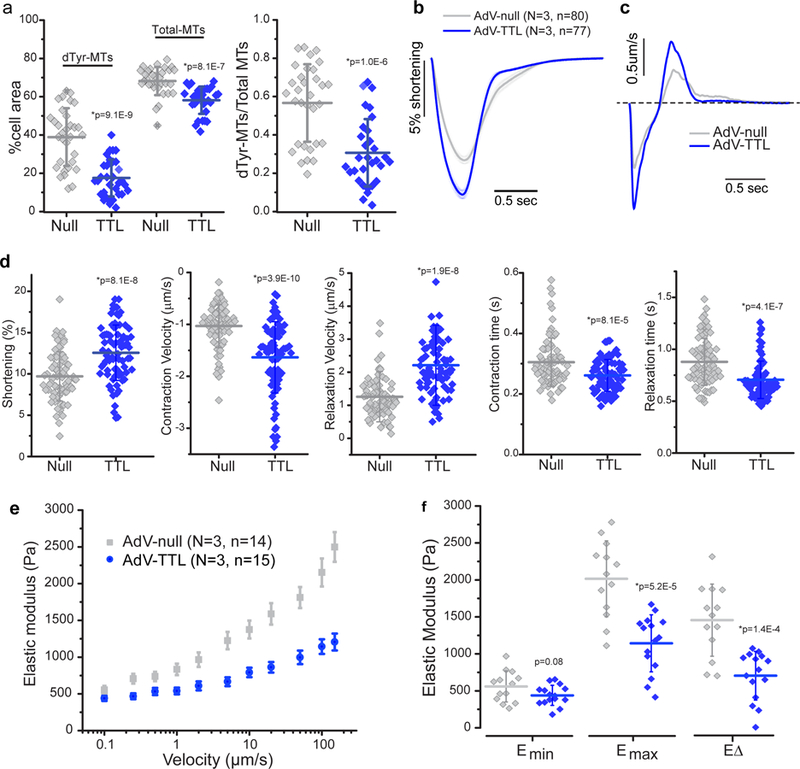
Detyrosinated microtubules provide mechanical resistance that can impede the motion of contracting cardiomyocytes. However, the functional effects of microtubule detyrosination in heart failure or in human hearts have not previously been studied. Here, we utilize mass spectrometry and single-myocyte mechanical assays to characterize changes to the cardiomyocyte cytoskeleton and their functional consequences in human heart failure. Proteomic analysis of left ventricle tissue reveals a consistent upregulation and stabilization of intermediate filaments and microtubules in failing human hearts. As revealed by super-resolution imaging, failing cardiomyocytes are characterized by a dense, heavily detyrosinated microtubule network, which is associated with increased myocyte stiffness and impaired contractility. Pharmacological suppression of detyrosinated microtubules lowers the viscoelasticity of failing myocytes and restores 40-50% of lost contractile function; reduction of microtubule detyrosination using a genetic approach also softens cardiomyocytes and improves contractile kinetics. Together, these data demonstrate that a modified cytoskeletal network impedes contractile function in cardiomyocytes from failing human hearts and that targeting detyrosinated microtubules could represent a new inotropic strategy for improving cardiac function.


Conflict of interest statement

COMPETING FINANCIAL INTERESTS

The authors declare no competing financial interests.

Figures

Fig. 1
Fig. 1. Proteomic analysis of human left ventricular tissues of varying disease severity and etiology.
(a) Principal component analysis (PCA) of tandem MS data (500 most variable proteins) to visualize similarities and differences among samples. Small circles represent the projections of individual hearts onto principal component (PC) 1 and 2, with the percentage of total variance listed in parentheses; large circles and ellipses represent the group mean and 95% confidence intervals, respectively. For a-d, Normal N=7, cHyp N=6, ICM N=6, HCMpEF N=4, HCMrEF N=5, DCM N=6 biologically independent hearts. (b) Heat map displaying the molecular function GO groups enriched in each group when compared to normal, color-coded by significance (determined by Toppfun analysis, see Statistics and Reproducibility) and sorted by most increased in DCM. Cytoskeleton-related GO groups are highlighted in red. Statistical details of GO group and protein domain enrichment analysis are available in Supplementary Tables 3, 4. (c) Heat map depicting the expression levels (log2 fold change) of individual proteins in the major cytoskeletal sub-groups. NF, Non-failing. (d) Table, top 10 upregulated genes as obtained from differential gene expression analysis in HCMrEF and DCM (compared to normal). Cytoskeletal genes are highlighted in red. Dot plots, abundance of specific proteins of interest measured as LFQ value from MS data. Each data point represents one heart, with mean line and whiskers representing standard deviation (SD). Statistical significance was determined via differential gene expression analysis compared to normal hearts, in which a linear model adjusting for age and sex in the R package LIMMA was used. P values were adjusted for multiple testing using the Benjamini-Hochberg procedure.
Fig. 2
Fig. 2. Characterization of MTs and desmin in NF and failing human myocytes.
(a) Immunofluorescent imaging of surface and interior MTs (cyan) and desmin (magenta) in a failing human myocyte. (b) Structured illumination microscopy (SIM) of NF human myocyte. Top, MTs (cyan). Bottom, a higher magnification image of transverse desmin elements (magenta) and longitudinal MTs (cyan). (c) Representative dTyr- and Tyr-MT networks in NF and failing myocytes. (d) Top, immunofluorescent images were converted to binary images to quantify MT network density. Bottom, the percentage of cell area covered by polymerized MTs (left) and the ratio of dTyr-MT/total MT (right). The total MT network density was calculated from the overlay of dTyr-MT and Tyr-MT binary images. For a, c, d - NF, n=68 images from 68 myocytes from N=3 biologically independent hearts; failing, n=42 images from 42 myocytes from N=2 biologically independent hearts. Each dot represents an individual myocyte with mean line and SD. Statistical significance in d determined via two-sided T-test with post-hoc Bonferroni correction, *p vs. NF. (e, f) Representative western blot of desmin (e) and quantification of the levels of α-tubulin and the 53 kD and low MW forms of desmin (f). GAPDH was used as a loading control. Each dot represents individual heart with mean line and SD (Normal N=24, cHyp N=18, HCM N=19, DCM N=26, ICM N=15 biologically independent hearts). Statistical significance in f determined via two-sided T-test with post-hoc Bonferroni correction, *p vs. normal. A representative α-tubulin blot and additional image quantification of MTs and desmin in myocytes and myocardium are presented in Supplementary Figs. 2, 3. Full-length western blots are presented in Supplementary Fig. 6.
Fig. 3
Fig. 3. MT-dependent viscoelasticity of human myocytes measured via nanoindentation.
(a) Viscoelasticity data are plotted as stiffness (elastic modulus) vs. velocity of indentation and is pooled from cardiomyocytes from NF and failing hearts treated with DMSO, colchicine (colch, a MT depolymerizer) or PTL (inhibits detyrosination) (NF hearts: DMSO, N =6 hearts, n =34 cardiomyocytes; colch, N=5, n=26; PTL, N=3, n=16; Failing hearts: DMSO, N=5, n=26; colch, N=5, n=30; PTL, N=2, n=9). Data are presented as myocyte mean ± standard error. (b) Quantification of viscoelasticity measurements Emin (minimum stiffness at low rate), Emax (maximum stiffness at high rate), and EΔ (difference between Emin and Emax, an indicator of viscoelasticity). Each data point represents a single myocyte with mean line and whiskers as SD. Detailed measurements from each heart are available in Supplementary Table 5. Statistical significance determined via One-Way ANOVA with post-hoc Tukey test, *p vs. DMSO; #p vs. NF. (c) Correlation between the initial viscoelasticity (E∆) of each heart and the percentage decreases in viscoelasticity after colch (square) and PTL (circle) treatment. Each data point represents the mean E∆ from all cells in a particular heart, which are color coded by group.
Fig. 4
Fig. 4. Suppression of detyrosinated MTs improves contractility in failing human cardiomyocytes.
(a) Average sarcomere shortening from DMSO-treated myocytes from failing (black) and non-failing (gray) hearts. Shortening is shown normalized to resting length; the negative deflection represents contraction in response to electrical stimulation followed by relaxation back to the resting length. (b, c) Effects of colchicine or PTL on the contractility of myocytes from representative NF (b) and failing (c) hearts. (d) Average velocity traces from all NF, failing, and treated failing myocytes. (e) Correlation between initial velocity in untreated myocytes and percentage improvement in velocity after treatment with colch (square) or PTL (circle). Each data point represents the mean contraction and relaxation velocity from all cells in a particular heart color coded by group. (f, g) Pooled data showing percentage improvement in the indicated contractile parameters following treatment of NF or failing hearts with colch (f) or PTL (g), as compared to vehicle-treated cells. For colchicine treatment, NF n = 119 myocytes from N = 5 biologically independent hearts, failing n = 168 myocytes from N = 7 biologically independent hearts. For PTL, NF n = 97 myocytes from N = 4 biologically independent hearts, failing n = 106 myocytes from N = 5 biologically independent hearts. Boxes show 25th-75th percentile, whiskers are SD, with median notch and mean line calculated from n myocytes. Relax, relaxation; SL, sarcomere length. Detailed contractility measurements from each heart are available in Supplementary Table 6. Statistical significance determined via two-sided T tests, *p<0.05, **p < 0.01, ***p < 0.001 vs. DMSO; #p<0.05, ##p<0.01, ###p<0.001 vs. NF.
Fig. 5
Fig. 5. Genetic modification of tubulin tyrosination reduces stiffness and improves contractility.
(a) Quantification of MT network density and dTyr-MT/total MT ratio (as described in Fig. 2d) following adenoviral-mediated overexpression of TTL (TTL) in cultured human cardiomyocytes, compared to myocytes infected with a null encoding adenovirus (Null). Null, n = 32 myocytes from N = 2 biologically independent hearts; TTL, n = 31 myocytes from N = 2 biologically independent hearts. (b) Average traces of sarcomere shortening in AdV-Null and AdV-TTL overexpressing cardiomyocytes. (c) Average contractile velocities of AdV-Null and AdV-TTL overexpressing cardiomyocytes (first derivative of (c)). (d) Quantification of contractile parameters. Each data point represents a single cardiomyocyte infected with AdV-null (n=80) or AdV-TTL (n=77) from N = 3 biologically independent hearts. (e) Viscoelasticity data (presented as mean +/− SE) and (f) quantification of viscoelasticity measurements on AdV-TTL and AdV-null expressing myocytes, presented as and quantified as described in Fig. 3. For a, b, d, and f, each data point represents a single myocyte, with mean line and whiskers as SD. Statistical significance determined via two-sided T-test with post-hoc Bonferroni correction, *p vs. AdV-null.

Comment in

Similar articles

Cited by

References

    1. Tsutsui H, Ishihara K & Cooper G Cytoskeletal role in the contractile dysfunction of hypertrophied myocardium. Science 260, 682–687 (1993). - PubMed
    1. Collins JF et al. The role of the cytoskeleton in left ventricular pressure overload hypertrophy and failure. J. Mol. Cell. Cardiol 28, 1435–1443 (1996). - PubMed
    1. Tagawa H et al. Cytoskeletal role in the transition from compensated to decompensated hypertrophy during adult canine left ventricular pressure overloading. Cir. Res 82, 751–761 (1998). - PubMed
    1. Ishibashi Y et al. Role of microtubules in myocyte contractile dysfunction during cardiac hypertrophy in the rat. Am. J. Physiol 271, H1978–87 (1996). - PubMed
    1. Bailey BA, Dipla K, Li S & Houser SR Cellular basis of contractile derangements of hypertrophied feline ventricular myocytes. J. Mol. Cell. Cardiol 29, 1823–1835 (1997). - PubMed

Publication types