. 2018 Jun 11;8(1):8889.
doi: 10.1038/s41598-018-26853-z.

Impaired hippocampal representation of place in the Fmr1-knockout mouse model of fragile X syndrome

Affiliations

Impaired hippocampal representation of place in the Fmr1-knockout mouse model of fragile X syndrome

Tara Arbab et al. Sci Rep. .

Abstract

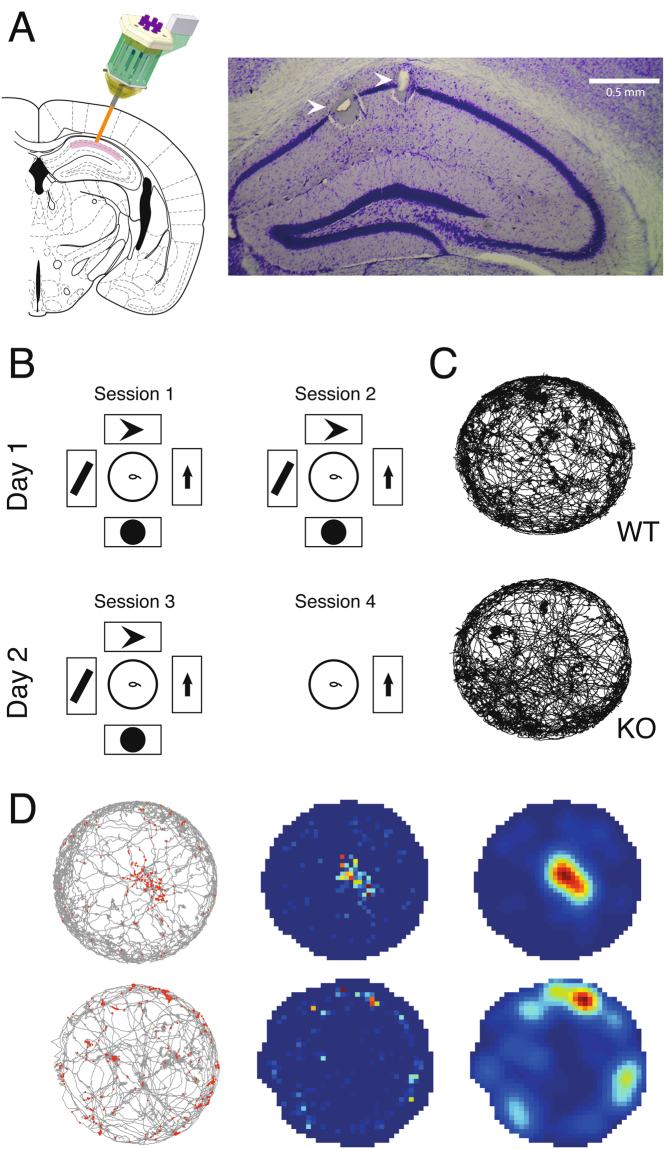
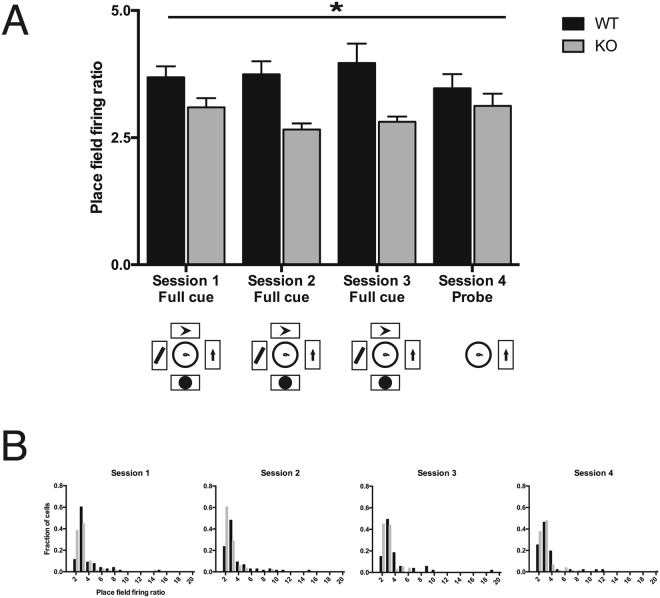
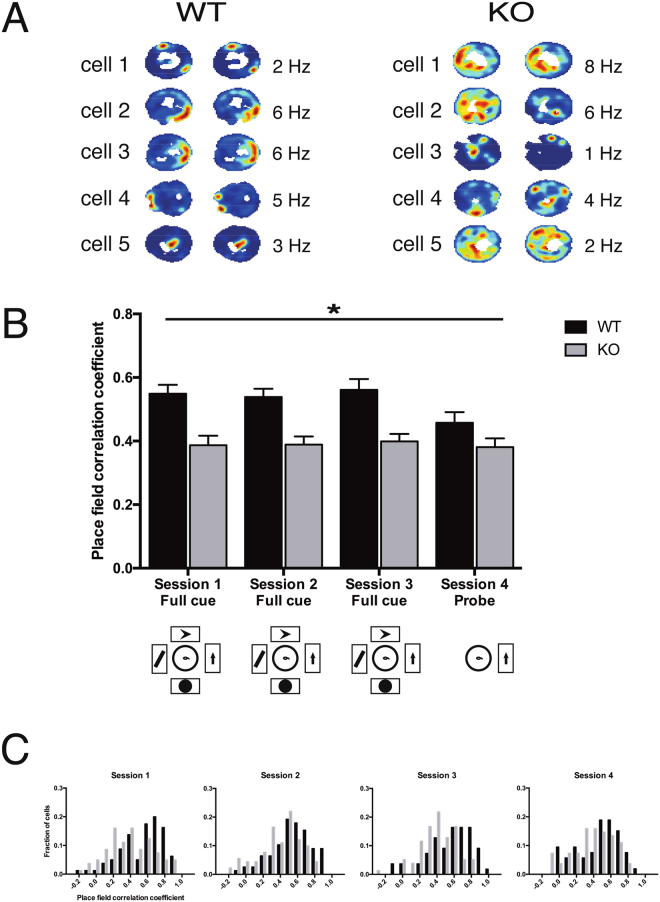
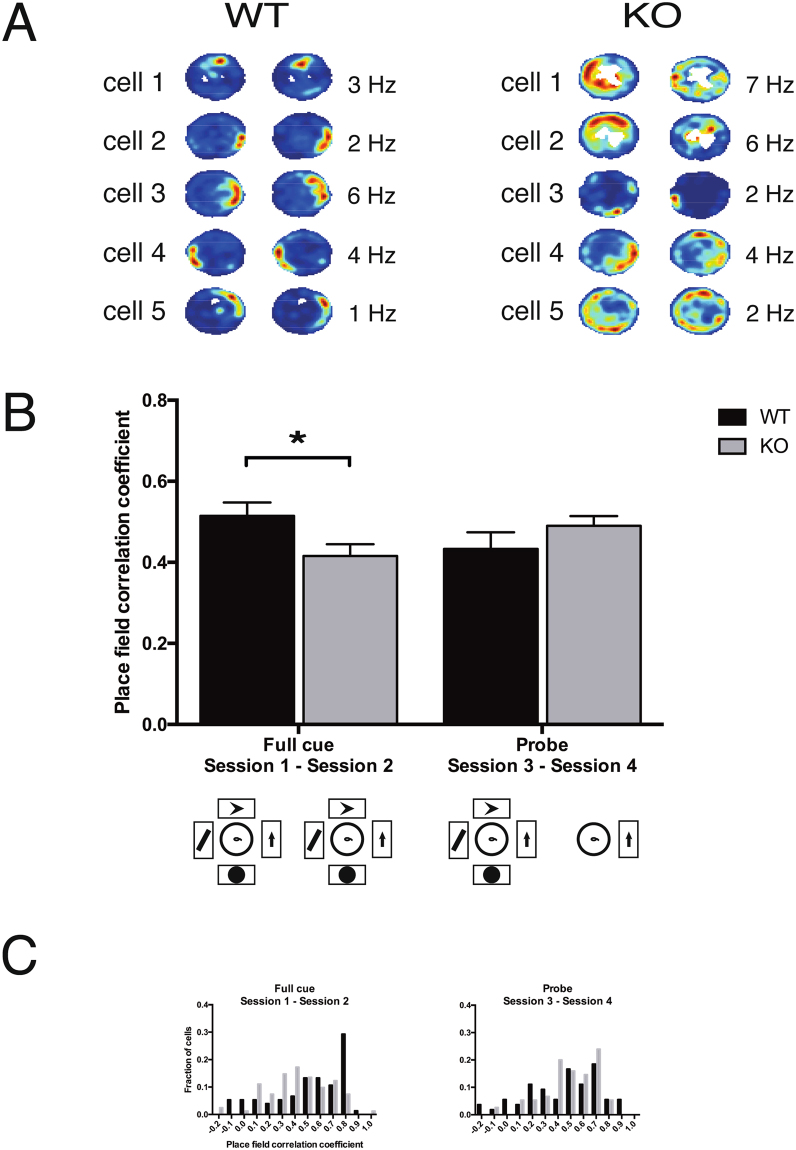
Fragile X syndrome (FXS) is an X-chromosome linked intellectual disability and the most common known inherited single gene cause of autism spectrum disorder (ASD). Building upon demonstrated deficits in neuronal plasticity and spatial memory in FXS, we investigated how spatial information processing is affected in vivo in an FXS mouse model (Fmr1-KO). Healthy hippocampal neurons (so-called place cells) exhibit place-related activity during spatial exploration, and their firing fields tend to remain stable over time. In contrast, we find impaired stability and reduced specificity of Fmr1-KO spatial representations. This is a potential biomarker for the cognitive dysfunction observed in FXS, informative on the ability to integrate sensory information into an abstract representation and successfully retain this conceptual memory. Our results provide key insight into the biological mechanisms underlying cognitive disabilities in FXS and ASD, paving the way for a targeted approach to remedy these.


Conflict of interest statement

The authors declare no competing interests.

Figures

Figure 1
Figure 1
Experimental Setup. (A) Histology. Left, schematic of microdrive implantation target, modified from. Right, coronal section showing the recording locations of two tetrodes in dorsal hippocampus CA1 (arrowheads). (B) Schematic of the behavioral protocol. On two consecutive days, in two sessions per day, animals freely explored a circular open field arena (middle). The arena was surrounded by four posters of geometric figures in the first three sessions, and only one poster in the fourth session. (C) Behavior. Accumulated trajectories of a WT and a KO animal exploring the arena during an example session. (D) Illustration of the three steps of firing map construction, for an example WT place cell (top row) and an example KO place cell (bottom row). Left, accumulated trajectory of animal exploration during the session, with spikes recorded from a single pyramidal cell superimposed in red. Middle, heat map of these spikes created by binning and normalizing this data. Right, smoothed heat map of these binned and normalized spikes.
Figure 2
Figure 2
Spatial specificity of place cells per session. (A) Place field firing rate increase of WT (black) and Fmr1-KO (gray) pyramidal cells within their respective fields, relative to the firing rate of each cell outside its field (the place field firing ratio). Data are represented as mean ± SEM. Session 1: WT 80 cells, mean = 3.69, SEM = 0.22; KO 81 cells, mean = 3.09, SEM = 0.18. Session 2: WT 77 cells, mean = 3.75, SEM = 0.25; KO 91 cells, mean = 2.66, SEM = 0.12. Session 3: WT 55 cells, mean = 3.97, SEM = 0.38; KO 78 cells, mean = 2.81, SEM = 0.10. Session 4: WT 52 cells, mean = 3.47, SEM = 0.28; KO 80 cells, mean = 3.12, SEM = 0.24. (B) Distributions of place field firing rate increase of WT (black) and Fmr1-KO (gray) pyramidal cells within their respective fields, relative to the firing rate of each cell outside its field (the place field firing ratio). *P < 0.0001 main effect of genotype (two-way genotype x session ANOVA: F1,586 = 25.55). There was no effect of session and no interaction effect.
Figure 3
Figure 3
Stability of firing rate maps within sessions. (A) Example WT and KO firing rate maps (selected across all mice and sessions), split between the first (left panels) and second (right panels) halves of each recording session, to illustrate the stability of each map. Each heat map is scaled by the maximum firing rate (indicated in Hz) of the cell within that session. Areas of the arena that were not visited during the recording session are marked in white. (B) Correlation of WT (black) and Fmr1-KO (gray) firing rate maps. Data are represented as mean ± SEM. Session 1: WT 80 fields, mean = 0.55, SEM = 0.028; KO 81 fields, mean = 0.39, SEM = 0.03. Session 2: WT 78 fields, mean = 0.54, SEM = 0.03; KO 91 fields, mean = 0.39, SEM = 0.03. Session 3: WT 55 fields, mean = 0.56, SEM = 0.03; KO 78 fields, mean = 0.40, SEM = 0.02. Session 4: WT 53 fields, mean = 0.46, SEM = 0.03; KO 82 fields, mean = 0.38, SEM = 0.03. (C) Distributions of the stability of WT (black) and Fmr1-KO (gray) pyramidal cells. *P < 0.0001 main effect of genotype (two-way genotype x session ANOVA: F1,590 = 46.34). There was no effect of session and no interaction effect.
Figure 4
Figure 4
Stability of firing rate maps between sessions. (A) Example WT and KO firing rate maps (selected across all mice and sessions), split between the first (left panels) and second (right panels) daily recording sessions, to illustrate the stability of each map. Each heat map is scaled by the maximum firing rate (indicated in Hz) of the cell within that session. Areas of the arena that were not visited during the recording session are marked in white. (B) Correlation of WT (black) and Fmr1-KO (gray) firing rate maps. Data are represented as mean ± SEM. Full cue session: WT 75 fields, mean = 0.51, SEM = 0.03; KO 81 fields, mean = 0.42, SEM = 0.03. Probe session: WT 54 fields, mean = 0.43, SEM = 0.04; KO 75 fields, mean = 0.49, SEM = 0.02. (C) Distributions of the stability of WT (black) and Fmr1-KO (gray) pyramidal cells. *P < 0.05 (Bonferroni’s multiple comparisons test).

References

    1. Belmonte MK, Bourgeron T. Fragile X syndrome and autism at the intersection of genetic and neural networks. Nat Neurosci. 2006;9:1221–1225. doi: 10.1038/nn1765. - DOI - PubMed
    1. Budimirovic DB, Kaufmann WE. What can we learn about autism from studying fragile X syndrome? Dev Neurosci. 2011;33:379–394. doi: 10.1159/000330213. - DOI - PMC - PubMed
    1. Pilpel Y, et al. Synaptic ionotropic glutamate receptors and plasticity are developmentally altered in the CA1 field of Fmr1 knockout mice. J Physiol. 2009;587:787–804. doi: 10.1113/jphysiol.2008.160929. - DOI - PMC - PubMed
    1. Santos AR, Kanellopoulos AK, Bagni C. Learning and behavioral deficits associated with the absence of the fragile X mental retardation protein: what a fly and mouse model can teach us. Learn Mem. 2014;21:543–555. doi: 10.1101/lm.035956.114. - DOI - PMC - PubMed
    1. Fung LK, Reiss AL. Moving Toward Integrative, Multidimensional Research in Modern Psychiatry: Lessons Learned From Fragile X Syndrome. Biol Psychiatry. 2016;80:100–111. doi: 10.1016/j.biopsych.2015.12.015. - DOI - PMC - PubMed

Publication types

Substances