

Decorrelation Signal of Diabetic Hyperreflective Foci on Optical Coherence Tomography Angiography
- PMID: 29892079
- PMCID: PMC5995832
- DOI: 10.1038/s41598-018-27192-9
Decorrelation Signal of Diabetic Hyperreflective Foci on Optical Coherence Tomography Angiography
Abstract
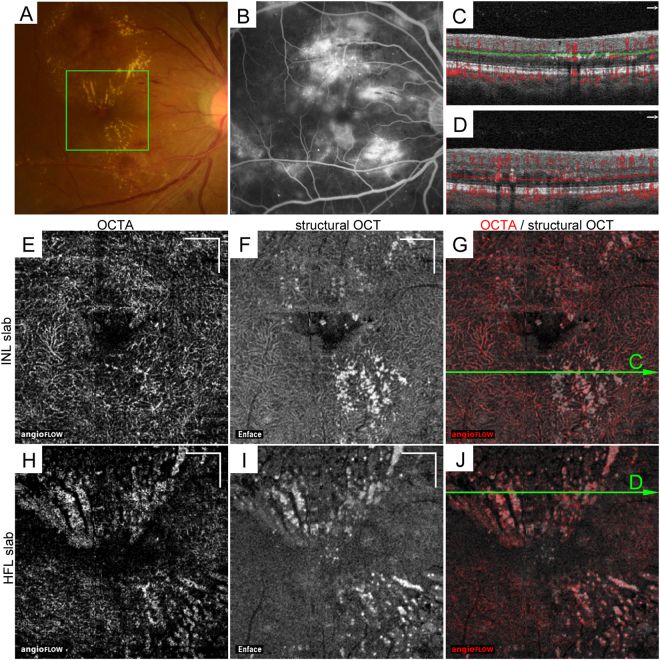
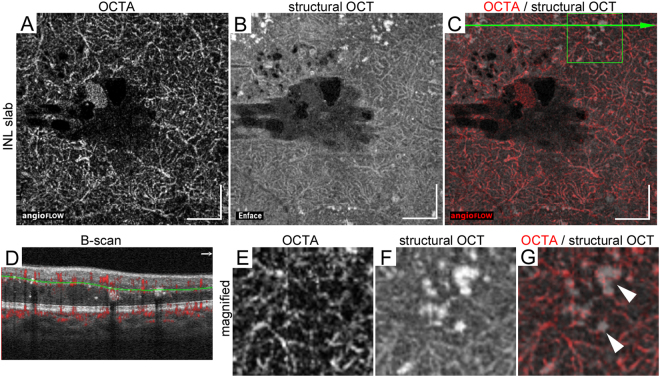
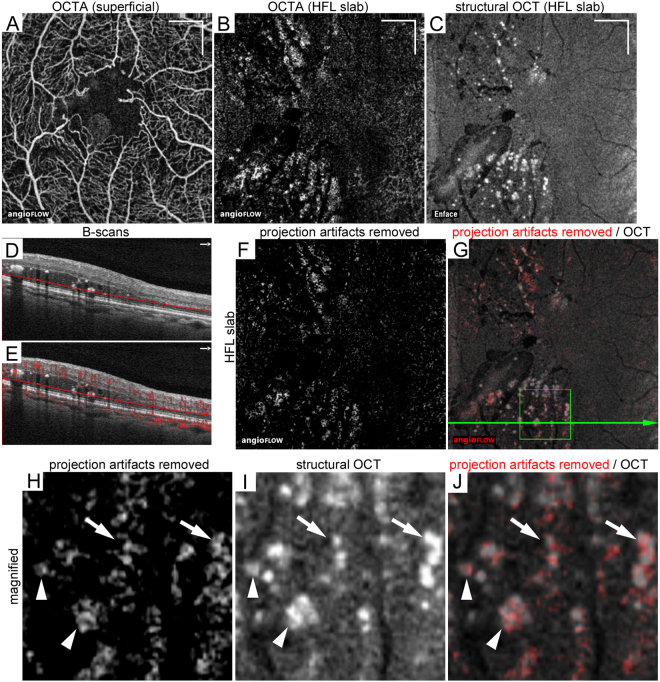
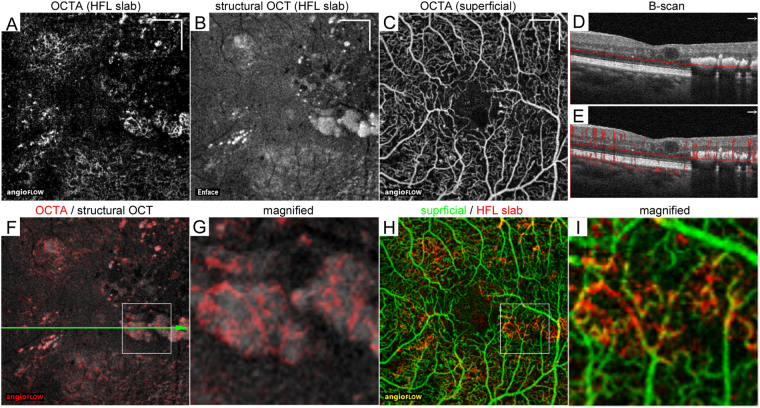
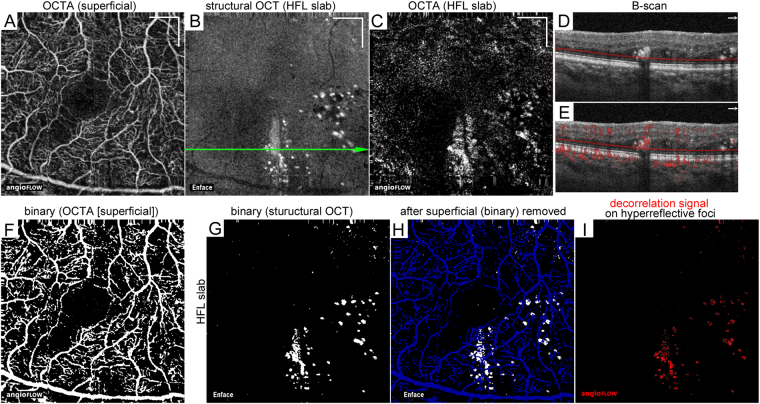
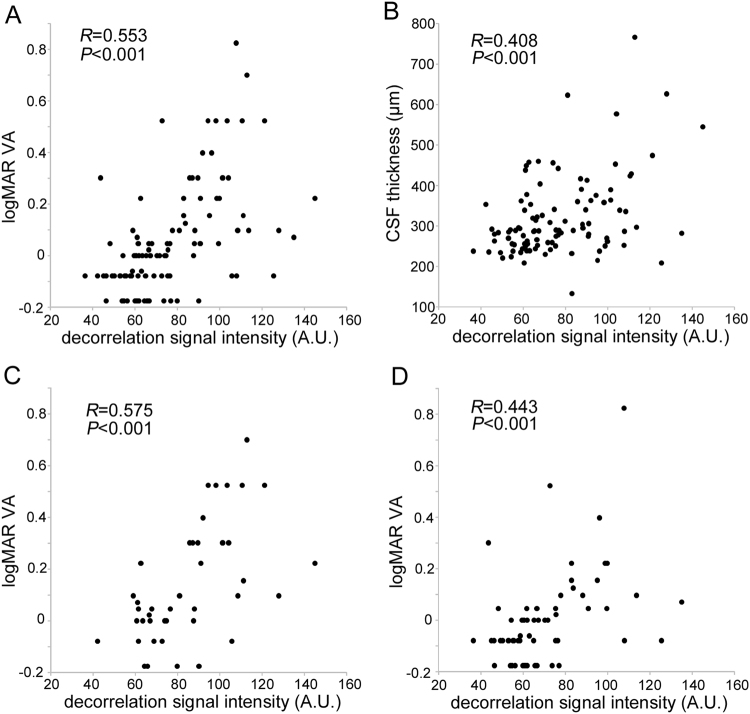
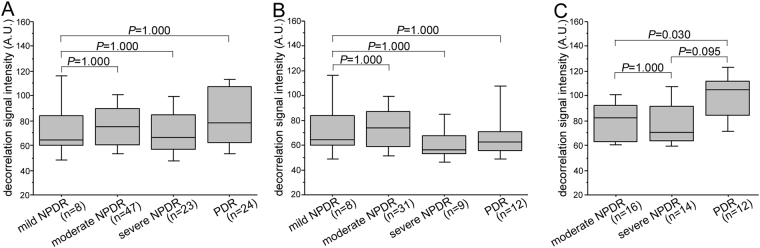
Diabetic hyperreflective foci in the outer retinal layers are a clinically relevant finding on optical coherence tomography (OCT) images, although their characteristics remain to be elucidated. Here we investigated the decorrelation signal around hyperreflective foci on OCT angiography (OCTA) images in diabetic retinopathy (DR). We retrospectively reviewed sufficient quality OCTA images from 102 eyes of 66 patients that were obtained using split-spectrum amplitude-decorrelation angiography algorithm. Most confluent hyperreflective foci were randomly deposited or appeared in a radiating array on the en-face structural OCT images in the inner nuclear layer (INL) or Henle's fiber layer (HFL), respectively. Within the INL, hyperreflective foci were not accompanied by decorrelation signals and attached to capillaries on OCTA images. Decorrelation signals were sometimes delineated in hyperreflective foci in the HFL and other times appeared to be pseudopod-like or wrapping around hyperreflective foci, referred to as reflectance-decorrelated foci. The decorrelation signal intensity of hyperreflective foci in the HFL was associated with logMAR VA (R = 0.553, P < 0.001) and central subfield thickness (R = 0.408, P < 0.001) but not with DR severity. These data suggest that reflectance-decorrelated foci on OCTA images are clinically relevant as well as shed lights on the properties in diabetic hyperreflective foci.
Conflict of interest statement
The authors declare no competing interests.
Figures
Similar articles
-
Characteristics of Diabetic Capillary Nonperfusion in Macular and Extramacular White Spots on Optical Coherence Tomography Angiography.Invest Ophthalmol Vis Sci. 2019 Apr 1;60(5):1595-1603. doi: 10.1167/iovs.18-26534. Invest Ophthalmol Vis Sci. 2019. PMID: 30995316
-
Relationship between Functional and Structural Changes in Diabetic Vessels in Optical Coherence Tomography Angiography.Sci Rep. 2016 Jun 28;6:29064. doi: 10.1038/srep29064. Sci Rep. 2016. PMID: 27350562 Free PMC article.
-
Association between hyperreflective foci in the outer retina, status of photoreceptor layer, and visual acuity in diabetic macular edema.Am J Ophthalmol. 2012 Apr;153(4):710-7, 717.e1. doi: 10.1016/j.ajo.2011.08.041. Epub 2011 Dec 3. Am J Ophthalmol. 2012. PMID: 22137207
-
The application of optical coherence tomography angiography in retinal diseases.Surv Ophthalmol. 2017 Nov-Dec;62(6):838-866. doi: 10.1016/j.survophthal.2017.05.006. Epub 2017 Jun 1. Surv Ophthalmol. 2017. PMID: 28579550 Review.
-
New Findings in Diabetic Maculopathy and Proliferative Disease by Swept-Source Optical Coherence Tomography Angiography.Dev Ophthalmol. 2016;56:113-21. doi: 10.1159/000442802. Epub 2016 Mar 15. Dev Ophthalmol. 2016. PMID: 27023703 Review.
Cited by
-
Behavior of SD-OCT Detectable Hyperreflective Foci in Diabetic Macular Edema Patients after Therapy with Anti-VEGF Agents and Dexamethasone Implants.J Diabetes Res. 2021 Apr 13;2021:8820216. doi: 10.1155/2021/8820216. eCollection 2021. J Diabetes Res. 2021. PMID: 33937416 Free PMC article.
-
Hyperreflective Retinal Foci (HRF): Definition and Role of an Invaluable OCT Sign.J Clin Med. 2025 Apr 27;14(9):3021. doi: 10.3390/jcm14093021. J Clin Med. 2025. PMID: 40364054 Free PMC article.
-
Topographic associations of hyperreflective materials in diabetic retinopathy: a multimodal correlation with microvascular pathology, structural remodeling and systemic metabolic dysregulation.Front Med (Lausanne). 2025 Jul 16;12:1619819. doi: 10.3389/fmed.2025.1619819. eCollection 2025. Front Med (Lausanne). 2025. PMID: 40740946 Free PMC article.
-
Clinical Implications of Suspended Scattering Particles in Motion Observed by Optical Coherence Tomography Angiography.Sci Rep. 2020 Jan 8;10(1):15. doi: 10.1038/s41598-019-55606-9. Sci Rep. 2020. PMID: 31913306 Free PMC article.
-
Significance of Hyperreflective Foci as an Optical Coherence Tomography Biomarker in Retinal Diseases: Characterization and Clinical Implications.J Ophthalmol. 2021 Dec 17;2021:6096017. doi: 10.1155/2021/6096017. eCollection 2021. J Ophthalmol. 2021. PMID: 34956669 Free PMC article. Review.
References
Publication types
MeSH terms
LinkOut - more resources
Full Text Sources
Other Literature Sources
Medical
Research Materials
