. 2018 Jul;14(7):706-714.
doi: 10.1038/s41589-018-0055-y. Epub 2018 Jun 11.

Plasticity in binding confers selectivity in ligand-induced protein degradation

Affiliations

Plasticity in binding confers selectivity in ligand-induced protein degradation

Radosław P Nowak et al. Nat Chem Biol. 2018 Jul.

Abstract

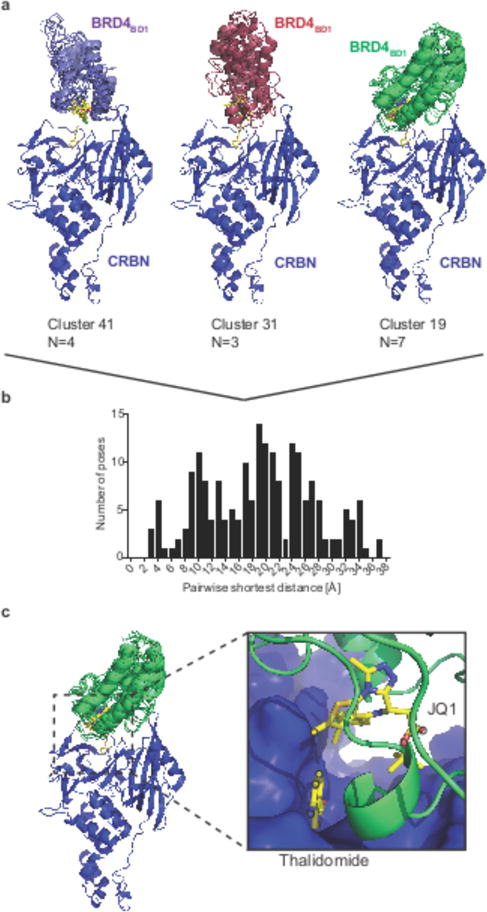
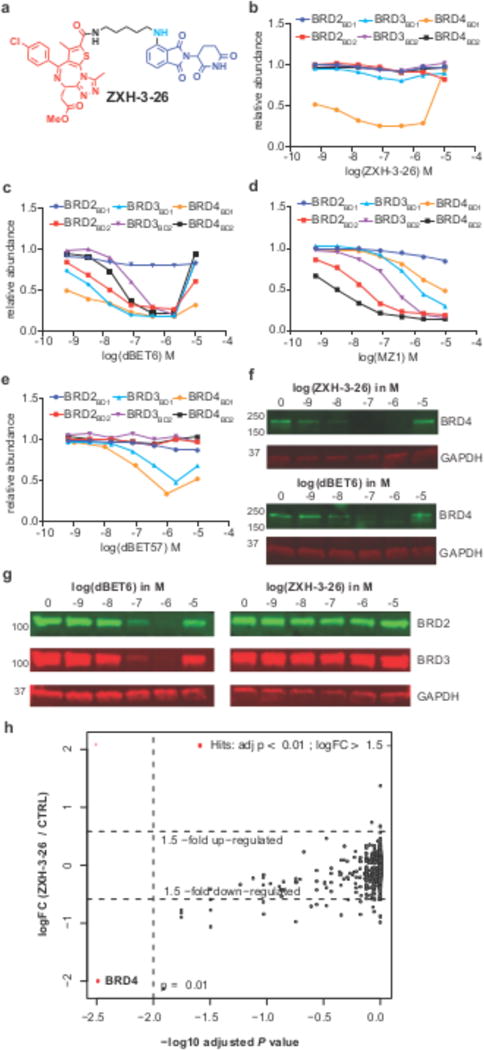
Heterobifunctional small-molecule degraders that induce protein degradation through ligase-mediated ubiquitination have shown considerable promise as a new pharmacological modality. However, we currently lack a detailed understanding of the molecular basis for target recruitment and selectivity, which is critically required to enable rational design of degraders. Here we utilize a comprehensive characterization of the ligand-dependent CRBN-BRD4 interaction to demonstrate that binding between proteins that have not evolved to interact is plastic. Multiple X-ray crystal structures show that plasticity results in several distinct low-energy binding conformations that are selectively bound by ligands. We demonstrate that computational protein-protein docking can reveal the underlying interprotein contacts and inform the design of a BRD4 selective degrader that can discriminate between highly homologous BET bromodomains. Our findings that plastic interprotein contacts confer selectivity for ligand-induced protein dimerization provide a conceptual framework for the development of heterobifunctional ligands.


Conflict of interest statement

Competing Financial Interest Statement:

E.S.F. is a member of the scientific advisory board of C4 Therapeutics and a consultant to Novartis Pharmaceuticals. N.S.G. is a founder and scientific advisory board member of C4 Therapeutics. J.E.B. is an executive and shareholder of Novartis Pharmaceuticals.

Figures

Figure 1
Figure 1. Structure of the DDB1ΔB-CRBN-dBET23-BRD4BD1 complex
(a) The chemical structure of dBET23 is depicted with the target-moiety in red, the linker in black and cyan, and the E3-moiety in blue. (b) Cartoon representation of DDB1ΔB-CRBN-dBET23-BRD4BD1: DDB1 highlighting domains BPA (red), BPC (orange) and DDB1-CTD (grey); CRBN with domains NTD (blue), HBD (cyan) and CTD (green); BRD4BD1 (magenta). The Zn2+-ion is drawn as a grey sphere and dBET23 as sticks representation in yellow. The FO-FC map is shown as green mesh for dBET23 contoured at 3.0σ. (c) Superposition of DDB1ΔB-CRBN-dBET23-BRD4BD1 with CRBN bound to lenalidomide (pdb: 4tz4) and BRD4BD1 bound to JQ1-(S) (pdb: 3mxf). Surface representation for CRBN and BRD4BD1 are shown in gray and magenta, respectively. dBET23 is shown in yellow, JQ1 in green, and thalidomide in cyan. (d) Side-chain interactions between BRD4BD1, CRBN, and dBET23. Residues of BRD4BD1 mutated in this study are highlighted in cyan.
Figure 2
Figure 2. Degrader mediated BRD4 recruitment is governed by negative cooperativity
(a) TR-FRET. dBET23 titrated to DDB1ΔB-CRBNSPY-BODIPY, Terbium-Streptavidin and various BRD4BD1-biotin wild type and mutant proteins. The mean peak heights for dose response curves of three independent replicates are shown as dot-plot. Data in this figure is presented as means ± s.d. (n=3). (b) Competitive binding assay for dBET1 binding to DDB1ΔB-CRBN. Increasing concentrations of dBET1 titrated to preformed DDB1ΔB-CRBN-lenalidomideAtto565 complex in presence or absence of BRD4BD1 or BRD4BD2. (c) As in b but using dBET6, (d) dBET23, or (e) dBET57. All data in this figure are independent replicates presented as means ± s.d. (n=3).
Figure 3
Figure 3. Quantitative assessment of cellular degradation for BRD4BD1 and BRD4BD2
(a) Quantitative assessment of cellular degradation using a BRD4BD1-EGFP reporter assay. Cells stably expressing BRD4BD1-EGFP and mCherry were treated with increasing concentrations of dBET1, dBET6, dBET23, dBET55, dBET57, dBET70, MZ1 and lenalidomide and the EGFP and mCherry signals followed using flow cytometry analysis. (b) as in a but using cells that express a BRD4BD2-EGFP reporter along with mCherry. Data in a and b are EGFP and mCherry signals quantified using flow cytometry analysis. Data of independent cell culture replicates is presented as the means ± s.d. (n=3 for MZ1, dBET6, 23, 55; n=4 for dBET1, 57, 70; n=6 for lenalidomide).
Figure 4
Figure 4. Plasticity of CRBN-substrate interactions
(a) TR-FRET. dBET23 titrated to BRD4BD1-SPYCATCHER-BODIPY, Terbium-antiHis antibody and various His6-DDB1ΔB-CRBN wild type and His6-DDB1-CRBN mutant proteins. The mean peak heights for dose response curves of three independent replicates are shown as dot-plot. TR-FRET data in this figure is presented as means ± s.d. (b) surface representation of CRBN highlighting the residues involved in dBET23 mediated BRD4BD1 binding in orange (residues Y59, L60, Q86, Q100, F102, H103, P104, D149, F150, G151, I152, I154, K156, P352, H353, E377, H378). CRBN interface residues mutated for biochemical assays are indicated. (c) TR-FRET. dBET23 titrated to DDB1ΔB-CRBNSPYCATCHER-BODIPY, Terbium-Streptavidin and various BRD4BD1-biotin wild type and mutant proteins. The mean peak heights for dose response curves of three independent replicates are shown as dot-plot. TR-FRET data in this figure is presented as means ± s.d. (d) as in a but titrating dBET57. (e) surface representation of CRBN highlighting the BRD4BD1 interacting residues for the dBET57 mediated recruitment in orange (residues: Q325, H353, Y355, H357, I371, G372, R373, E377, V388, Q390, C394, A395, S396, H397, T418, S420). CRBN interface residues mutated for biochemical assays are indicated. (f) as in b but titrating dBET57. (g) Cartoon representation of DDB1ΔB-CRBN-dBET57-BRD4BD1: DDB1 highlighting domains BPA (red), BPC (orange) and DDB1-CTD (grey); CRBN with domains NTD (blue), HBD (cyan) and CTD (green); BRD4BD1 (magenta). The Zn2+-ion is drawn as a grey sphere. dBET57 was not modelled in this structure but instead superpositions of lenalidomide (from pdb: 5fqd) and JQ1 (from pdb: 3mxf) are shown in yellow sticks. (h) Superposition of CRBN and BRD4BD1 for the dBET23 and dBET57 containing complexes. Superposition was carried out over the CRBN-CTD (residues 320 – 400). (i) The chemical structures of dBET57 is depicted with the target-moiety in red, the linker in black and cyan, and the E3-moiety in blue.
Figure 5
Figure 5. In silico docking to design degrader molecules
(a) Cartoon representations for representative clusters obtained by k-means clustering of the top 200 global docking poses between CRBN (pdb: 4tz4) and BRD4BD1 (pdb: 3mxf). (b) Histogram of the pairwise shortest distances for the top 200 docking poses. (c) Close-up view on the proximity of the JQ1 thiophene and lenalidomide that provided the rationale for synthesizing ZXH-2-147 and ZXH-3-26. Atoms used for calculation of the pairwise shortest distances between JQ1 and lenalidomide are highlighted in black circles.
Figure 6
Figure 6. Selective degradation of BRD4
(a) Chemical structure of ZXH-3-26. (b) Quantitative assessment of cellular degradation using a EGFP/mCherry reporter assay. Cells stably expressing BRD4BD1-EGFP (or constructs harboring BRD2BD1, BRD2BD2, BRD3BD1, BRD3BD2, BRD4BD2) and mCherry were treated with increasing concentrations of ZXH-3-26 and the EGFP and mCherry signals followed using flow cytometry analysis (c) As in b but for dBET6, MZ1 (d), and dBET57 (e). Data in b-e are representative experiments out of at least three experiments. (f) Cellular degradation of endogenous BRD4. HEK293T cells were treated with increasing concentrations of ZXH-3-26 or dBET6 for 5 hours, and protein levels assessed by western blot. (g) As in f but assessing the degradation of BRD2 and BRD3 by western blot. Experiments in f and g are representative of two independent experiments. Full scans for all western blots are provided in Supplementary Fig. 10. (h) Scatter plot depicting the fold changes in relative abundance comparing 0.1 μM ZXH-3-26 to DMSO control treatment for 4 hours in MM.1s cells determined using quantitative proteomics. Negative log10 false discovery rate adjusted P Values are shown on the x-axis and log2 fold changes on the y-axis. BRD4 is significantly downregulated with a log2 fold change of -1.99, and a FDR adjusted P value of 0.0018. Data shown are of three cell culture replicates measured in a single 10-plex TMT experiment (showing 6311 proteins quantified by > 3 unique peptides). P Values were derived from a moderated t-statistic using the limma package and corrected for multiple hypothesis testing using a Benjamini-Hochberg approach (see methods for details).

References

    1. Gustafson JL, et al. Small-Molecule-Mediated Degradation of the Androgen Receptor through Hydrophobic Tagging. Angew Chem Int Ed Engl. 2015;54:9659–9662. - PMC - PubMed
    1. Bondeson DP, et al. Catalytic in vivo protein knockdown by small-molecule PROTACs. Nat Chem Biol. 2015;11:611–617. - PMC - PubMed
    1. Buckley DL, et al. HaloPROTACS: Use of Small Molecule PROTACs to Induce Degradation of HaloTag Fusion Proteins. ACS Chem Biol. 2015;10:1831–1837. - PMC - PubMed
    1. Lu J, et al. Hijacking the E3 Ubiquitin Ligase Cereblon to Efficiently Target BRD4. Chem Biol. 2015;22:755–763. - PMC - PubMed
    1. Gadd MS, et al. Structural basis of PROTAC cooperative recognition for selective protein degradation. Nat Chem Biol. 2017 doi: 10.1038/nchembio.2329. - DOI - PMC - PubMed

Publication types

MeSH terms