. 2018 May 28:11:177.
doi: 10.3389/fnmol.2018.00177. eCollection 2018.

Endophilin A1 Promotes Actin Polymerization in Dendritic Spines Required for Synaptic Potentiation

Affiliations

Endophilin A1 Promotes Actin Polymerization in Dendritic Spines Required for Synaptic Potentiation

Yanrui Yang et al. Front Mol Neurosci. .

Abstract

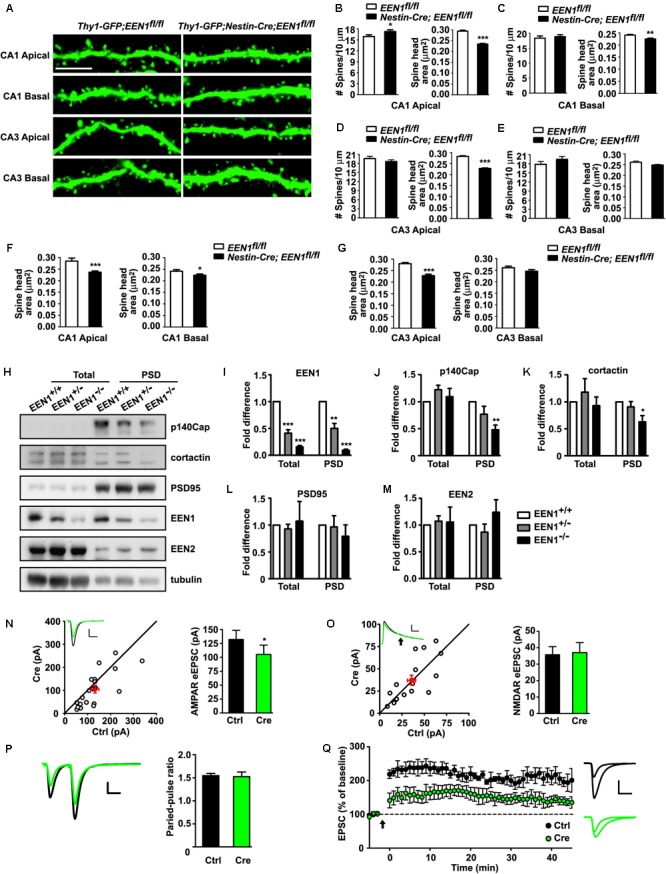
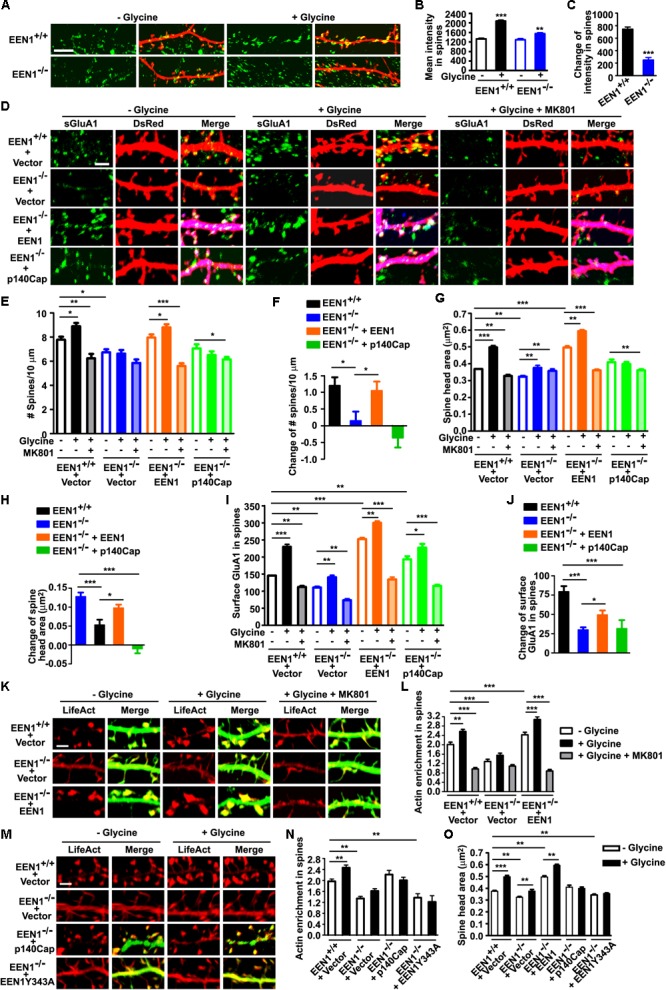
Endophilin A1 is a member of the N-BAR domain-containing endophilin A protein family that is involved in membrane dynamics and trafficking. At the presynaptic terminal, endophilin As participate in synaptic vesicle recycling and autophagosome formation. By gene knockout studies, here we report that postsynaptic endophilin A1 functions in synaptic plasticity. Ablation of endophilin A1 in the hippocampal CA1 region of mature mouse brain impairs long-term spatial and contextual fear memory. Its loss in CA1 neurons postsynaptic of the Schaffer collateral pathway causes impairment in their AMPA-type glutamate receptor-mediated synaptic transmission and long-term potentiation. In KO neurons, defects in the structural and functional plasticity of dendritic spines can be rescued by overexpression of endophilin A1 but not A2 or A3. Further, endophilin A1 promotes actin polymerization in dendritic spines during synaptic potentiation. These findings reveal a physiological role of endophilin A1 distinct from that of other endophilin As at the postsynaptic site.

Keywords: AMPAR; actin polymerization; dendritic spine; endophilin A1; learning and memory; structural plasticity; synaptic potentiation; synaptic transmission.


Figures

FIGURE 1
FIGURE 1
EEN1 KO mice are impaired in long-term spatial and contextual fear memory. (A) Domain structure of EEN1. (B) Schematic representation of the EEN1 gene locus, the KO-first, floxed and mutant alleles after homologous recombination. zptF/R and loxPF/R: primer pairs used for genotyping. neo, the neomycin resistance cassette. (C) Immunoblots of tissue lysates from mouse littermates, probed with antibodies to EEN1 and EEN2. β-Actin serves as loading control. 1, hippocampus; 2, cortex; 3, cerebellum; 4, liver. (D) No differences in the body weight of EEN1+/+, EEN1+/-, and EEN1-/- mice were detected during development (9 EEN1+/+, 11 EEN1+/-, and 14 EEN1-/-). (E–G) No effects of EEN1 KO on the performance in assays of rotarod (E and F) and Y maze (G). Data represent mean ± SEM for each group (18 EEN1+/+, 26 EEN1+/-, and 22 EEN1-/-). (H–K) No effects of EEN1 KO on the social affiliation and sociability (H and I) or social memory and novelty (J and K). Data represent mean ± SEM (9 EEN1+/+, 10 EEN1+/-, and 8 EEN1-/-). (L–S) The Morris water maze test. Shown are escape latency or traveled distance before escaping to the platform among groups in the visible-platform training (L and M), escape latency, and traveled distance before escaping to the platform in the invisible-platform training (N and O), number of crossing with the 1.5× platform area over 35 days after training and the swim trace 7 days after training in the probe test (P and Q), the swim trace and recall ability following training once again on day 35 (R and S). Red circle indicates position of the platform. Data represent mean ± SEM (9 EEN1+/+, 10 EEN1+/-, and 8 EEN1-/-), p < 0.05, ∗∗p < 0.01. (T and U) Contextual fear conditioning. Shown are levels of freezing behavior after 24, 48, and 72 h from contextual fear training, and levels of freezing when animals were exposed to a novel context. Data represent mean ± SEM (9 EEN1+/+, 11 EEN1+/-, and 10 EEN1-/-), ∗∗p < 0.01
FIGURE 2
FIGURE 2
EEN1 expression in the hippocampal CA1 region of adult mice is required for long-term spatial and contextual fear memory. (A) LacZ staining in the sagittal brain section of 10-week-old EEN1 KO-first (EEN1-/-) mice. Right panel is magnification of the hippocampus. Scale bars, 1 mm in the left panel and 100 μm in the right panel. (B) Immunofluorescence staining of EEN1 in hippocampal CA1, CA2, CA3, and DG regions of 10-week-old EEN1+/+ and EEN1-/- mouse brains. Scale bar, 20 μm. (C) AAV virus was stereotaxically injected into the CA1 regions of EEN1fl/fl mice to express GFP alone or Cre and GFP. Shown are GFP signal and DAPI labeling of nuclei 21 days after viral injection. Scale bar, 1 mm. (D) Immunofluorescence staining of EEN1 in brain slices 21 days after injection of AAV virus into the CA1 region of EEN1fl/fl mice. Lower panels are magnification of the boxed areas. Scale bar, 100 μm. (E–L) The Morris water maze test. Shown are escape latency or traveled distance before escaping to the platform in the visible-platform training (E and F), escape latency, and traveled distance before escaping to the platform in the invisible-platform training (G and H), number of crossing with the 1.5× platform area and the swim trace 5 days after training in probe test (I and J), the swim trace and recall ability following training once again 1 month after training (K and L). Data represent mean ± SEM (11 GFP, 13 Cre), p < 0.05, ∗∗p < 0.01. (M and N) Decrease in freezing behavior 72 h after contextual fear training in the Cre virus-injected group. Data represent mean ± SEM (9 GFP, 12 Cre), ∗∗p < 0.01.
FIGURE 3
FIGURE 3
EEN1 overexpression in hippocampal CA1 of adult KO mice restores long-term spatial and contextual fear memory. (A) AAV virus was stereotaxically injected into the CA1 regions of EEN1-/- mice to express GFP alone or EEN1 and GFP. Shown are confocal images of GFP signal and DAPI labeling of nuclei 21 days after viral injection. Scale bar, 1 mm. (B) Immunofluorescence staining of EEN1 in CA1 neurons of brain slices 21 days after injection of AAV virus into the CA1 region of EEN1-/- mice. Right panels are magnification of the boxed areas. Scale bar, 100 μm. (C–J) The Morris water maze test. Shown are escape latency or traveled distance before escaping to the platform in the visible-platform training (C and D), escape latency and traveled distance before escaping to the platform in the invisible-platform training (E and F), number of crossing with the 1.5× platform area and the swim trace 5 days after training in probe test (G and H), the swim trace and recall ability following training once again 1 month after training (I and J). Data represent mean ± SEM (11 EEN1+/+ + GFP, 10 EEN1-/- + GFP, 14 EEN1-/- + EEN1), p < 0.05, ∗∗p < 0.01, ∗∗∗p < 0.001. (K and L) Restoration of freezing behavior in EEN1-overexpressed EEN1-/- mice, compared with control mice. Data represent mean ± SEM (11 EEN1+/+ + GFP, 10 EEN1-/- + GFP, 14 EEN1-/- + EEN1), p < 0.05, ∗∗∗p < 0.001.
FIGURE 4
FIGURE 4
Morphological and functional alterations of EEN1-deficient hippocampal neurons. (A) Confocal micrographs showing spines on GFP-positive apical or basal dendrites of pyramidal cells in hippocampal CA1 or CA3 regions of 10-week-old Thy1-GFP;EEN1fl/fl and Thy1-GFP;nestin-Cre;EEN1fl/fl mice. Scale bar, 5 μm. (B–E) Quantification of spine density or spine head area in A (CA1 apical/basal: 42/34 cells, 2691/3240 spines, total length of dendrites >1500 μm and CA3 apical/basal: 32/31 cells, 2742/2258 spines, total length of dendrites >1000 μm for Thy1-GFP;EEN1fl/fl. CA1 apical/basal: 44/37 cells, 3666/2282 spines, total length of dendrites >1200 μm, and CA3 apical/basal: 39/32 cells, 3998/3002 spines, total length of dendrites >1500 μm for Thy1-GFP;Nestin-Cre;EEN1fl/fl). Data represent mean ± SEM, p < 0.05, ∗∗p < 0.01, ∗∗∗p < 0.001. (F–G) Shown are the average of average spine head area of each CA1 and CA3 pyramidal cells, respectively. Data represent mean ± SEM, n = 31–44, p < 0.05, ∗∗∗p < 0.001. (H) Immunoblotting of indicated proteins in homogenates (total) and PSD fractions from hippocampi of EEN1+/+, EEN1+/-, and EEN1-/- mice. (I–M) Quantification of protein levels in H, normalized to levels of EEN1+/+ mice. Data represent mean ± SEM, N = 4, p < 0.05, ∗∗p < 0.01, ∗∗∗p < 0.001. (N) Dual recording analysis of AMPAR-mediated synaptic responses. Scatter plots show amplitudes of AMPAR-eEPSCs for single pairs (open circles) and mean ± SEM (filled circle). The current amplitudes of infected neurons (Cre) were plotted on the ordinate and those of the control neurons (Ctrl) were plotted on the abscissa. Inset shows sample current traces from a pair of infected (green) and control (black) neurons. Scale bar, 100 pA and 20 ms. Bar graph shows mean ± SEM of AMPAR amplitudes represented in the scatter plots. Control, 132.1 ± 16.3 pA; Cre, 105.1 ± 16.8 pA, n = 20, p = 0.030, paired t-test. (O) NMDAR-mediated eEPSC. Currents were recorded at +40 mV. Data were collected at 150 ms after electric stimulation (arrow), when the AMPAR-mediated EPSC had completely decayed. Scale bar, 50 pA and 50 ms. The NMDA eEPSCs were 35.7 ± 4.6 pA for control and 37.1 ± 5.7 pA for Cre-expressing neurons. n = 16, p = 0.74, paired t-test. (P) Paired-pulse recording of AMPAR eEPSCs. Two identical stimulus pulses were delivered in an interval of 50 ms and AMPAR eEPSCs were recorded at -70 mV. Left were sample traces of eEPSCs from a pair of infected and control neurons. Scale bar, 100 pA and 25 ms. The paired-pulse ratio (PPR) was the enhancement of the second eEPSC relative to the first eEPSC. Bar graph shows mean ± SEM of PPRs. Control, 1.55 ± 0.05; Cre, 1.53 ± 0.10, n = 10, p = 0.81, paired t-test. (Q) LTP was severely reduced in EEN1-deficient neurons. Relative amplitudes of AMPAR-eEPSCs (mean ± SEM) in control and Cre-expressing neurons before and after a whole-cell LTP-pairing protocol (arrow), Vm = 0 mV, 2 Hz SC stimulation for 90 s, normalized to average eEPSC amplitude prior to LTP induction. n = 10 decreased to 6 cells for control and n = 9 decreased to 6 cells for Cre-expressing neurons, respectively. Right shows sample traces of control and Cre before and 40 min after pairing. Sale bar: 100 pA and 20 ms. The potentiation ratio is significantly decreased in EEN1-deficient neurons 40 min after LTP induction, p = 0.020, t-test
FIGURE 5
FIGURE 5
EEN1 is required for the structural and functional plasticity of dendritic spines. (A) Cultured EEN1+/+ and EEN1-/- hippocampal neurons were transfected with pLL3.7.1 on DIV12-13 to express DsRed as volume marker, fixed and immunostained for EEN1 and DsRed on DIV19. Shown are representative confocal images of dendrites. (B) Quantification of EEN1 fluorescent signals in spines in A, normalized to levels of EEN1+/+ neurons. Data represent mean ± SEM, n > 10 neurons, >600 spines per group, ∗∗∗p < 0.001. (C) Cultured EEN1+/+ and EEN1-/- neurons co-transfected with DsRed expression construct and Flag vector, and EEN1-/- neurons co-transfected with constructs expressing DsRed- and Flag-tagged EEN1, EEN2, or EEN3 on DIV12-13 were treated with glycine to induce chemLTP with or without MK801 pretreatment on DIV18, and immunostained for surface GluA1, Flag, and DsRed. Shown are representative confocal images of dendrites. (D) Quantification of spine density in C. (E) Changes of spine density in C. (F) Quantification of spine head area in C. (G) Changes of spine head area in C. (H) Quantification of surface GluA1 levels in spines in C. (I) Changes of surface GluA1 levels in spines in C. Data represent mean ± SEM in D–I, n > 15 neurons per group, >850 spines per group, p < 0.05, ∗∗p < 0.01, ∗∗∗p < 0.001. Scale bars, 2 μm.
FIGURE 6
FIGURE 6
EEN1 promotes actin polymerization in spines undergoing synaptic potentiation. (A) Cultured EEN1+/+ and EEN1-/- hippocampal neurons transfected with construct expressing DsRed on DIV12-13 were treated with glycine to induce LTP on DIV18, followed by immunostaining for p140Cap and DsRed. (B) Quantification of p140Cap mean intensity in spines in A. (C) Changes of p140Cap mean intensity in spines in A. Data represent mean ± SEM, n > 10 neurons, >500 spines per group, ∗∗p < 0.01, ∗∗∗p < 0.001. (D) Cultured EEN1+/+ and EEN1-/- hippocampal neurons co-transfected with DsRed construct and Flag vector, and EEN1-/- neurons co-transfected with constructs expressing DsRed- and Flag-tagged EEN1 or p140Cap on DIV12-13 were treated with glycine to induce LTP with or without MK801 pretreatment on DIV18, followed by immunostaining for surface GluA1, Flag, and DsRed. Shown are representative confocal images of dendrites. (E) Quantification of spine density in D. (F) Changes of spine density in D. (G) Quantification of spine head area in D. (H) Changes of spine head area in D. (I) Quantification of surface GluA1 levels in spines in D. (J) Changes of surface GluA1 levels in spines in D. Data represent mean ± SEM in E–J, n > 15 neurons, >850 spines per group, p < 0.05, ∗∗p < 0.01, ∗∗∗p < 0.001. (K) EEN1+/+ neurons co-transfected with LifeAct–mCherry and GFP constructs, and EEN1-/- neurons co-transfected with LifeAct–mCherry and GFP or EEN1-GFP constructs on DIV12-13 were treated with glycine with orwithout MK801 pretreatment on DIV18, followed by immunostaining with antibodies against GFP and mCherry. Shown are representative confocal images of dendrites. (L) Quantification of actin enrichment in dendritic spines in K. Data represent mean ± SEM, n > 12 neurons, >700 spines per group, ∗∗p < 0.01,∗∗∗p < 0.001. (M) EEN1+/+ and EEN1-/- neurons co-transfected with LifeAct–mCherry construct and Flag vector, and EEN1-/- neurons co-transfected with LifeAct–mCherry and Flag-tagged p140Cap or EEN1 Y343A constructs on DIV12-13 were treated with glycine on DIV18, followed by immunostaining with antibodies against mCherry and Flag. Shown are representative confocal images of dendrites. (N) Quantification of actin enrichment in dendritic spines in M. (O) Quantification of spine head area in M. Data represent mean ± SEM in N and O, n > 10 neurons, >500 spines per group, ∗∗p < 0.01, ∗∗∗p < 0.001. Scale bars, 5 μm in A and 2 μm in D, K, and M

Similar articles

Cited by

References

    1. Bai J., Hu Z., Dittman J. S., Pym E. C., Kaplan J. M. (2010). Endophilin functions as a membrane-bending molecule and is delivered to endocytic zones by exocytosis. Cell 143 430–441. 10.1016/j.cell.2010.09.024 - DOI - PMC - PubMed
    1. Banker G., Goslin K. (1988). Developments in neuronal cell culture. Nature 336 185–186. 10.1038/336185a0 - DOI - PubMed
    1. Barbash S., Hanin G., Soreq H. (2013). Stereotactic injection of microRNA-expressing lentiviruses to the mouse hippocampus ca1 region and assessment of the behavioral outcome. J. Vis. Exp. 76:e50170. 10.3791/50170 - DOI - PMC - PubMed
    1. Boucrot E., Ferreira A. P., Almeida-Souza L., Debard S., Vallis Y., Howard G., et al. (2015). Endophilin marks and controls a clathrin-independent endocytic pathway. Nature 517 460–465. 10.1038/nature14067 - DOI - PubMed
    1. Bromley-Brits K., Deng Y., Song W. (2011). Morris water maze test for learning and memory deficits in Alzheimer’s disease model mice. J. Vis. Exp. 53:2920. 10.3791/2920 - DOI - PMC - PubMed