. 2018 May 28:9:1085.
doi: 10.3389/fmicb.2018.01085. eCollection 2018.

Acclimation and Institutionalization of the Mouse Microbiota Following Transportation

Affiliations

Acclimation and Institutionalization of the Mouse Microbiota Following Transportation

Dan R Montonye et al. Front Microbiol. .

Abstract

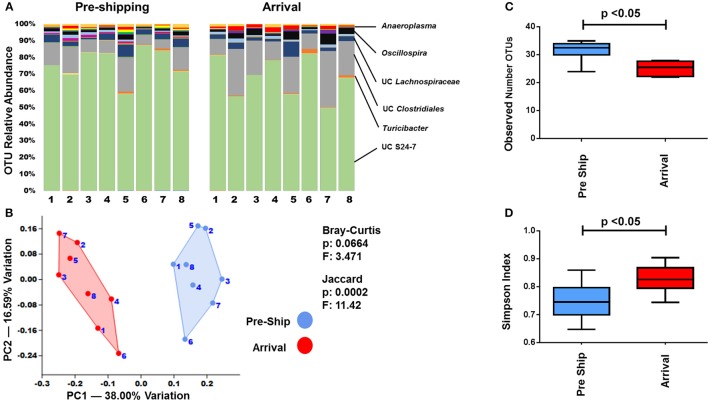
Using animal models, the gut microbiota has been shown to play a critical role in the health and disease of many organ systems. Unfortunately, animal model studies often lack reproducibility when performed at different institutions. Previous studies in our laboratory have shown that the gut microbiota of mice can vary with a number of husbandry factors leading us to speculate that differing environments may alter gut microbiota, which in turn may influence animal model phenotypes. As an extension of these studies, we hypothesized that the shipping of mice from a mouse producer to an institution will result in changes in the type, relative abundance, and functional composition of the gut microbiota. Furthermore, we hypothesized that mice will develop a microbiota unique to the institution and facility in which they are housed. To test these hypotheses, mice of two strains (C57BL/6J and BALB/cJ), two age groups (4 week and 8 week old), and originating from two types of housing (research animal facility under conventional housing and production facilities under maximum barrier housing) were obtained from The Jackson Laboratory. Fecal samples were collected the day prior to shipping, immediately upon arrival, and then on days 2, 5, 7, and weeks 2, 4, and 9 post-arrival. Following the first post-arrival fecal collection, mice were separated into 2 groups and housed at different facilities at our institution while keeping their caging, diet, and husbandry practices the same. DNA was extracted from the collected fecal pellets and 16S rRNA amplicons were sequenced in order to characterize the type and relative abundance of gut bacteria. Principal component analysis (PCA) and permutational multivariate analysis of variance (PERMANOVA) demonstrated that both the shipping and the institution and facility in which mice were housed altered the gut microbiota. Phylogenetic investigation of communities by reconstruction of unobserved states (PICRUSt) predicted differences in functional composition in the gut microbiota of mice based on time of acclimation.

Keywords: 16S rRNA gene sequencing; acclimation; gut microbiota (GM); mouse models; transportation.


Figures

Figure 1
Figure 1
Study design and timeline. Mice were obtained from The Jackson Laboratory and delivered to two facilities at the University of Missouri. Fecal samples were obtained prior to shipping, at arrival, and at days 2, 5, and 7, and weeks 2, 4, and 9. Husbandry conditions (caging, bedding, food, water, carestaff, etc.) were kept the same between groups and between facilities. A second shipment was repeated in this same manner ~7 months following the first shipment to determine if seasonal differences also play a role in the GM response to transportation and acclimation.
Figure 2
Figure 2
Transportation effects on the GM. (A) Bar charts showing the bacterial composition of adult B6J CON mice before and after shipping. Each bar represents an individual mouse and the relative abundance of OTUs observed in each are shown on the y-axis. Prominent families are labeled on the right. A complete taxonomic legend is provided in Supplemental Table 1. (B) PCA with Jaccard and Bray-Curtis PERMANOVA used to demonstrate differences in β-diversity. Numbers on figure correlate with numbers below bar chart. (C,D) Tukey box plots of α-diversity were used to further characterize changes pre and post shipping. Bars denote significant differences (p < 0.05) in mice.
Figure 3
Figure 3
Hierarchical cluster analysis of all mice pre and post shipping. Hierarchical cluster analysis showing the top 25 OTUs with the most variation before shipping and upon arrival. Color intensity shows cube root transformed normalized OTU abundances in each sample. Colored bars on top denote pre-shipping samples from arrival samples. Colored bars along bottom denote the group the mice belonged to.
Figure 4
Figure 4
GM changes throughout acclimation.(A) Bar charts showing the bacterial composition of adult B6J CON mice from arrival through 9 weeks. Each bar represents an individual mouse and the relative abundance of OTUs observed in each are shown on the y-axis. Time points are labeled across the top of bars. Prominent families are labeled on the right. A complete taxonomic legend is provided in Supplemental Table 1. (B) PCA with Jaccard and Bray-Curtis PERMANOVA used to demonstrate differences in β-diversity. Legend of color coded time points is on the right. (C,D) Tukey box plots used to demonstrate differences in richness and diversity. One-way ANOVA demonstrated mice had significant overall differences (p < 0.05) in richness and diversity. Multiple comparison procedures (Student-Newman-Keuls method) revealed numerous significant differences between time points (not shown).
Figure 5
Figure 5
Functional changes of the GM during acclimation. (A) Linear discriminant analysis effect size (LEfSe) generated from PICRUSt and HUMAnN data showing differences in predicted metabolic function of gut bacteria between day 2 and day 7 in adult B6J CON mice. Green bars indicate pathways that are upregulated in day 7 compared to day 2 and red bars indicate pathways that are upregulated in day 2 compared to day 7. An LDA score of 2 indicates significance of p < 0.05. (B) LEfSe data showing functional differences between day 7 and week 4.
Figure 6
Figure 6
Institutionalization of the GM. (A) Bar charts comparing the bacterial composition of adult B6J CON mice prior to shipping and after 9 weeks in two facilities at the arrival institution. Each bar represents an individual mouse and the relative abundance of OTUs observed in each are shown on the y-axis. Prominent families are labeled on the right. A complete taxonomic legend is provided in Supplemental Table 1. (B) PCA with Jaccard and Bray-Curtis PERMANOVA showing differences between institutions as well facilities. Numbers on figure correlate with numbers below bar chart. (C,D) Tukey box plots of α-diversity were used to further characterize changes between institutions and facilities. Bars denote significant differences (p < 0.05) in mice.
Figure 7
Figure 7
Hierarchical cluster analysis of all mice prior to shipping and following 9 weeks at new facilities. Hierarchical cluster analysis showing the top 25 OTUs with the most variation between our facilities and The Jackson Laboratory. Color intensity shows cube root transformed normalized OTU abundances in each sample. Colored bars on top denote pre-shipping samples from samples at each facility following 9 weeks. Colored bars along bottom denote the group the mice belonged to.

References

    1. Abubucker S., Segata N., Goll J., Schubert A. M., Izard J., Cantarel B. L., et al. . (2012). Metabolic reconstruction for metagenomic data and its application to the human microbiome. PLoS Comput. Biol. 8:e1002358. 10.1371/journal.pcbi.1002358 - DOI - PMC - PubMed
    1. Aguila H., Pakes S., Lai W., Lu Y.-S. (1988). The effect of transportation stress on splenic natural killer cell activity in C57BL/6J mice. Lab. Anim. Sci. 38, 148–151. - PubMed
    1. Altschul S. F., Madden T. L., Schäffer A. A., Zhang J., Zhang Z., Miller W., et al. . (1997). Gapped BLAST and PSI-BLAST: a new generation of protein database search programs. Nucleic Acids Res. 25, 3389–3402. 10.1093/nar/25.17.3389 - DOI - PMC - PubMed
    1. Arts J. W., Kramer K., Arndt S. S., Ohl F. (2012). The impact of transportation on physiological and behavioral parameters in Wistar rats: implications for acclimatization periods. ILAR J. 53, E82–E98. 10.1093/ilar.53.1.82 - DOI - PubMed
    1. Bailey M. T., Coe C. L. (1999). Maternal separation disrupts the integrity of the intestinal microflora in infant rhesus monkeys. Dev. Psychobiol. 35, 146–155. 10.1002/(SICI)1098-2302(199909)35:2<146::AID-DEV7>3.0.CO;2-G - DOI - PubMed